

Nasdaq Forecast 2026: AI Trends and Hurst Cycle Analysis
Introduction
The tech-heavy Nasdaq index stands at a fascinating crossroads in May 2026. As Artificial Intelligence continues to redefine market valuations, understanding the underlying cyclical rhythm of the market is more critical than ever.
In this comprehensive report, we apply the Hurst Nominal Model and advanced spectral analysis to decode the current 18-month, 40-week, and shorter-term trading cycles.
While the macro trend remains undeniably bullish, short-term volatility and cycle synchronicity suggest a complex roadmap ahead.
We will examine historical lows from 2022 to recent April 2025 troughs to project where the next major peaks and corrections will manifest.
Whether you are a long-term investor or a short-term trader, this analysis provides the technical scaffolding—including VTL and FLD confirmations—needed to navigate the Nasdaq’s AI-fueled trajectory with professional-grade precision and clarity.
In this update for May 4, 2026, we are diving deep into the Nasdaq stock market to explore a critical question: where will AI-driven momentum lead the index next? We begin our analysis by examining the long-term 18-month cycle.
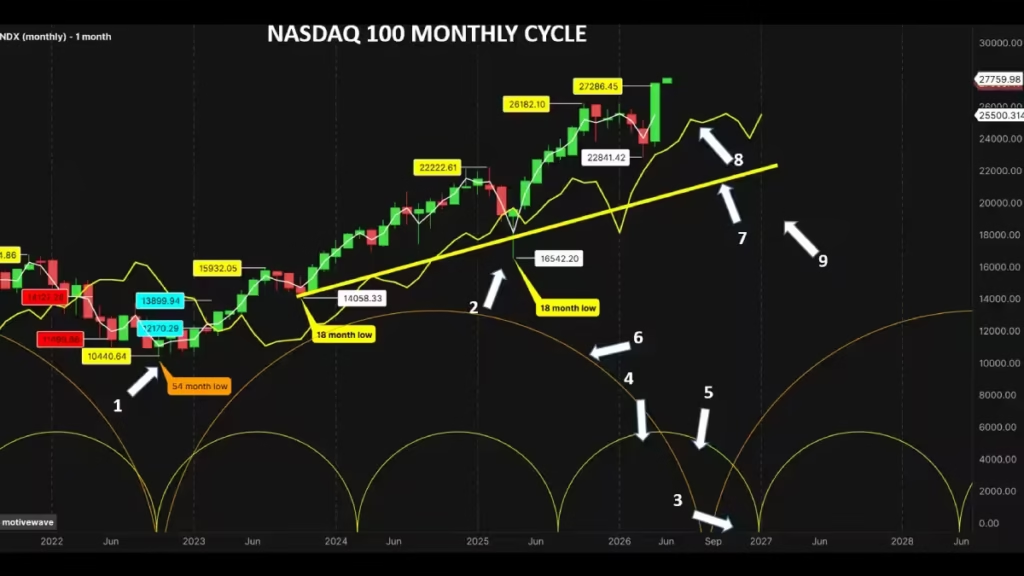
The 18 Month
Currently, the Nasdaq remains in a very bullish trend, but identifying the crest of this 18-month cycle is paramount. The last major low for the Nasdaq occurred in 2022(arrow1), marking the conclusion of the previous 54-month cycle.
More recently, an 18-month cycle low was established in April 2025(arrow2), representing the second 18-month trough within the current 54-month period.
Twelve months have elapsed since April 2025. While the Hurst nominal model suggests an average 18-month cycle length of 17.93 months, my proprietary spectral analysis indicates a current average of 17.2 months—still remarkably consistent with the model J.M. Hurst established over 50 years ago.
Adding 17 months to the April 2025 low points toward September 2026(arrow 3) as the potential date for the next 18-month cycle low.
Due to Hurst’s “Principle of Synchronicity,” this will also coincide with a 54-month cycle low.
Technically, prices typically peak at the cycle crest between 8 to 9 months (arrow 4) after the initial low.
Having reached the 12-month mark, prices are forming their peak on the “right-hand side” of the cycle (right-hand translation) (arrow5).
This setup allows us to anticipate only a moderate correction, despite the significant 54-month cycle influence. The chart confirms that the Nasdaq is also peaking on the right side of its 54-month cycle (arrow 6), reinforcing the sustained bullishness of the tech sector.
We will receive confirmation that the 54-month peak has formed once the Nasdaq crosses below its cycle trend line, or VTL (arrow 7). Furthermore, the first sign of the 18-month cycle peak will be a crossover below the 18-month Future Line of Demarcation (FLD) (arrow 8)—represented by the yellow line.
This crossing will not only confirm the peak but also provide a downside target; the correction could reach the 54-month FLD, which is currently positioned near the $18,200 level.(arrow 9)
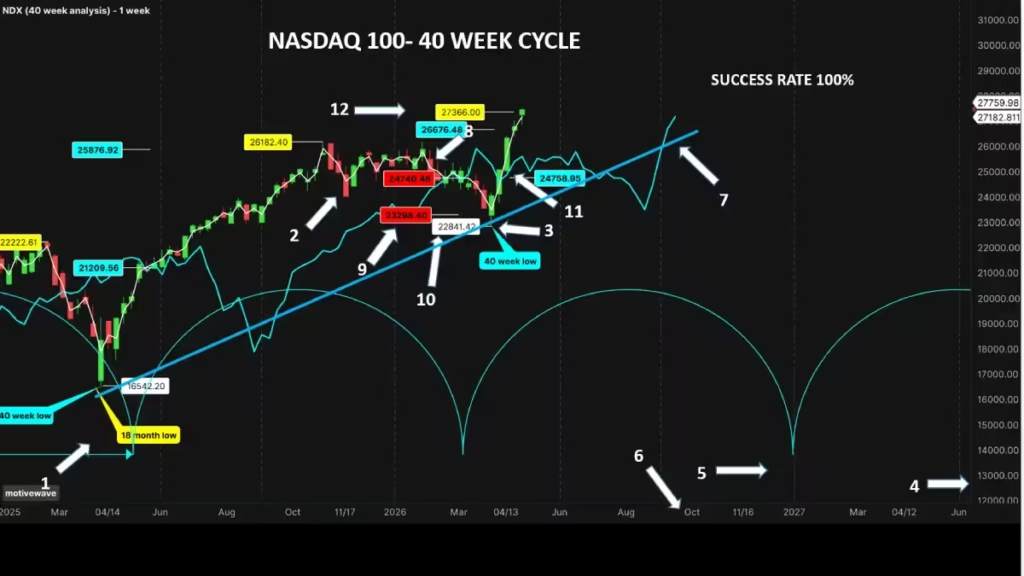
The 40 week
By identifying the first 40-week cycle low following the April 2025 trough (arrow 1) as occurring in late November (arrow 2), we observe a duration of 32 weeks—roughly 6 weeks shorter than the Hurst nominal average of 38.97 weeks.
An alternative scenario places the low in March 2026 (arrow 3), which would extend the cycle to 52 weeks. While 13 weeks longer than the nominal model, the magnitude of the subsequent rally makes this the more probable scenario.
This lack of clarity in identifying the 40-week low is likely attributed to market news.
News affects cycles in two primary ways: by increasing volatility or by shifting cycle lengths. When traders anticipate or react to significant events, cycles can compress or “wait” for the news, causing them to run longer, as seen in the current 40-week period.
What lies ahead? If the second 40-week cycle mirrors the first, the low would occur in March 2027 (arrow 4)—an unlikely outcome.
If the market aligns with the Hurst nominal model, we can expect a low in December 2026 (arrow 5).
However, the most likely path is that the next cycle will be shorter to compensate for the previous extension, bringing the average back to 38.97 weeks. This points to a projected low in October 2026 (arrow 6).
We will monitor the 40-week VTL (arrow 7); a crossover below this line will confirm the 40-week peak and, more importantly, signal the formation of the next 18-month cycle peak.
The March low designation is supported by the fact that after the $26,182 high, the Nasdaq crossed below its FLD at $24,740 (arrow 8), providing a specific $23,298 downside target (arrow 9).
By the last week of March, the Nasdaq hit a low of $22,841 (arrow 10), successfully meeting that target.
According to Hurst’s principles, crossing back above the FLD in April ($24,758) (arrow 11) confirmed the March through as a valid cycle low also triggered a $26,676 upside target ( arrow 12) which has already been met.
This signal maintained a 100% success rate for the year.
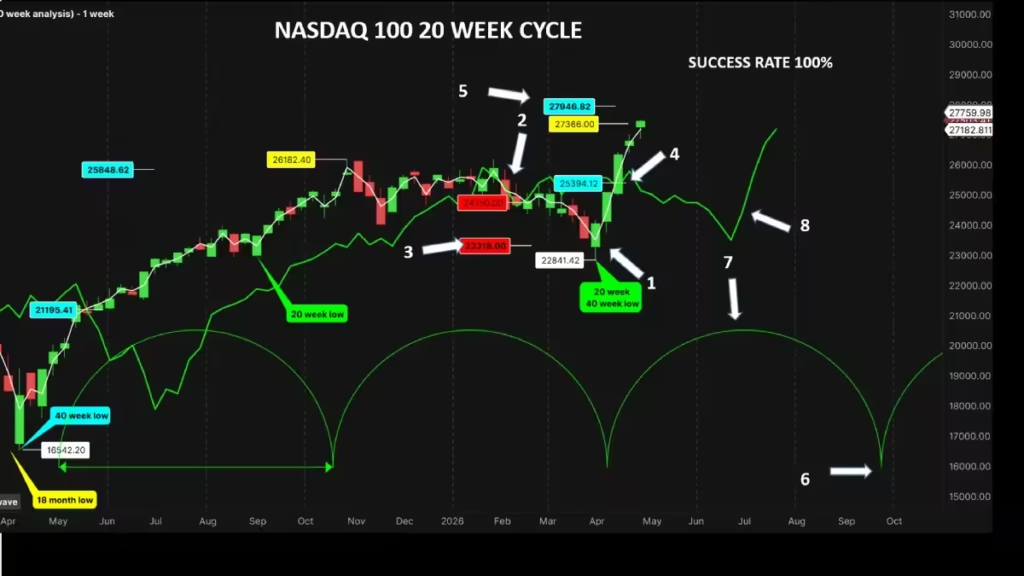
The 20 week
Following the Principle of Synchronicity, the last 20-week cycle low formed simultaneously with the 40-week low in late March (arrow 1).
In February, a crossing below the 20-week FLD at $24,750 (arrow 2) projected a downside target of $23,318, (arrow 3) which the market met and exceeded by late March.
A second trading signal occurred in the second week of April when the Nasdaq crossed above its FLD at $25,394, (arrow 4) providing an upside target of $27,946 (arrow 5).
Based on the Hurst nominal model, the next 20-week low is projected for the first week of August (arrow 6), with a peak likely forming in the first week of June (arrow 7).
At this stage, we anticipate the Nasdaq will eventually cross below its cycle line (arrow 8) to provide a new downside target.
After finding a low in August, we expect a rebound where the cycle line acts as resistance before the final decline toward the last 20-week low of this 18-month cycle.
This will be a crucial indicator of the remaining bullish energy in the market.
To date, the 20-week cycle signals have achieved a 100% success rate.
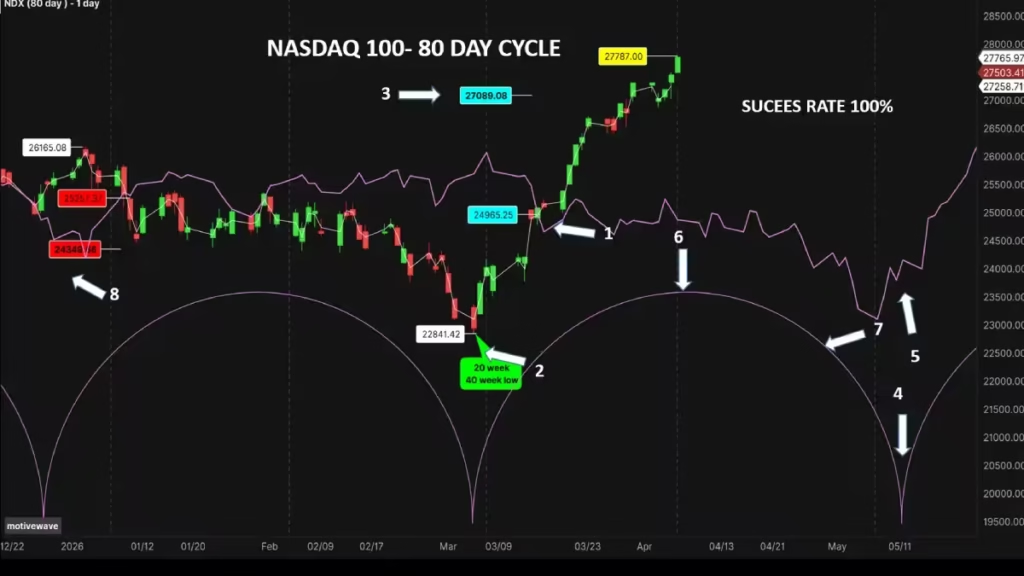
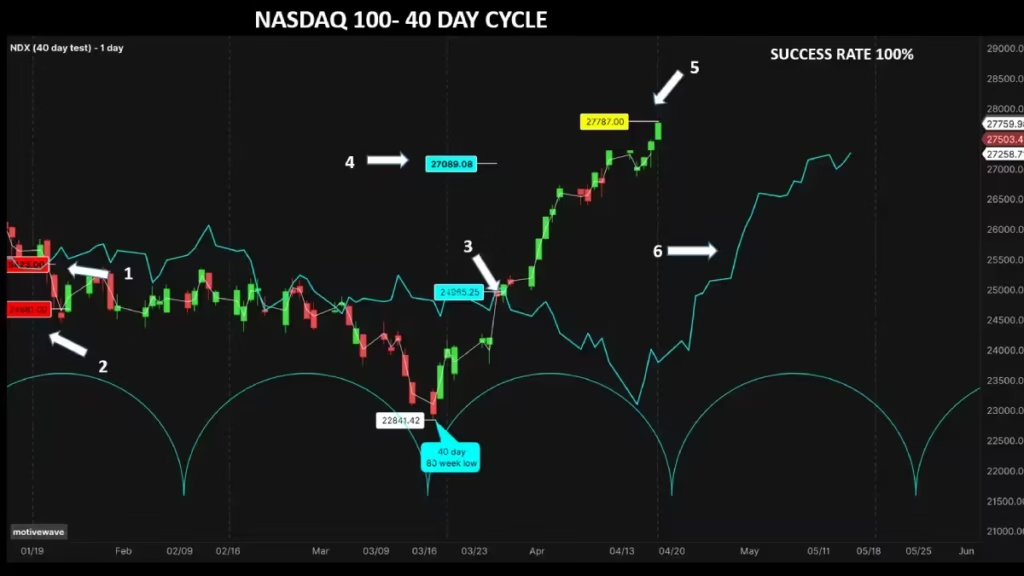
The 80 Day
By crossing above its FLD (arrow 1), the Nasdaq has confirmed that the March low (arrow 2) is at least an 80-day cycle trough.
On April 8, the index crossed above the cycle line at $24,965, projecting a target of $27,089 (arrow 3). By April 23, the market hit this target, yielding a profit of $2,059.
The low for this 80-day cycle is expected around June 7 (arrow 4). It is vital for the future trend that the market finds support on its cycle line during this formation (arrow 5).
We anticipate a peak on May 4 (arrow 6); if this peak occurs on the right side of the cycle (arrow 7), the subsequent correction should remain moderate.
The first 80-day signal of the year in February successfully projected at $24,349 (arrow 8) a target that was met by March 3.
The second signal in April 9 at $24,965 (arrow 9) for a $27.089 target met on the April 24.
Year-to-date, the 80-day cycle has provided two successful signals, a 100% success rate, and $2,963 in total profits.
The 40 Day
The 40-day cycle produced its first signal on February 3 (arrow 1), with a crossing at $25,423 that met its $24,681 target (arrow 2) for a $742 profit the following day.
A second signal on April 10 at $24,965 (arrow 3) reached its $27,089 (arrow 4) target by April 24, securing $2,124 in potential profit.
This cycle also boasts a 100% success rate with total profits of $2,860.
Looking forward, the all-time high of $27,315 (arrow 5) in April likely represents the 40-day peak.
We expect the market to find support near its cycle line at approximately $24,000 (arrow 6) during the next low. Given the intense bullishness, there is a high probability the low forms well above the cycle line.
Once the 40-day low is confirmed, I will utilize the 40-day VTL to identify the timing of the 80-day peak.
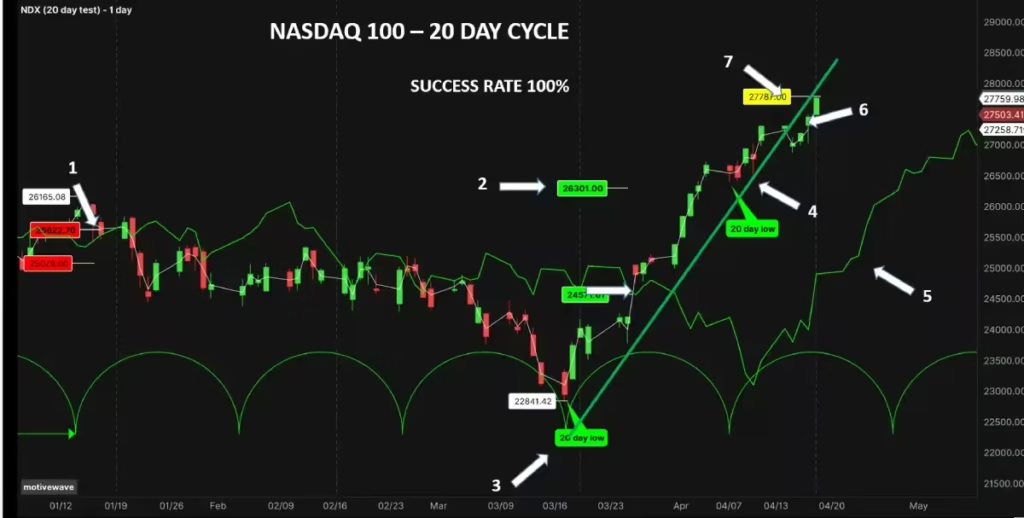
Short-Term Trader’s Corner: The 20-Day Cycle
The 20-day cycle has offered two highly accurate signals this year. The first, on February 2 (arrow 1), captured a $543 profit in just two days. The second, on April 7, projected a target of $26,301 (arrow 2), which was exceeded by April 16 for a gain of $1,780 in nine days.
Due to extreme bullish momentum following the March 30 low(arrow 3), the market formed its subsequent low well above the cycle line (arrow 4). For the next cycle, we expect a crossover below the FLD (arrow 5), targeting the 40-day FLD area.
On Tuesday, April 28, the market crossed below its cycle trend line (arrow 6), suggesting the April 27 (arrow 7)high may indeed be the 40-day peak.
The 20-day cycle maintains a 100% success rate.
The following roadmap is designed to help the trader navigate through the next month.
Please note: this is not trading advice, but rather my personal technical analysis based on Hurst cycle principles.
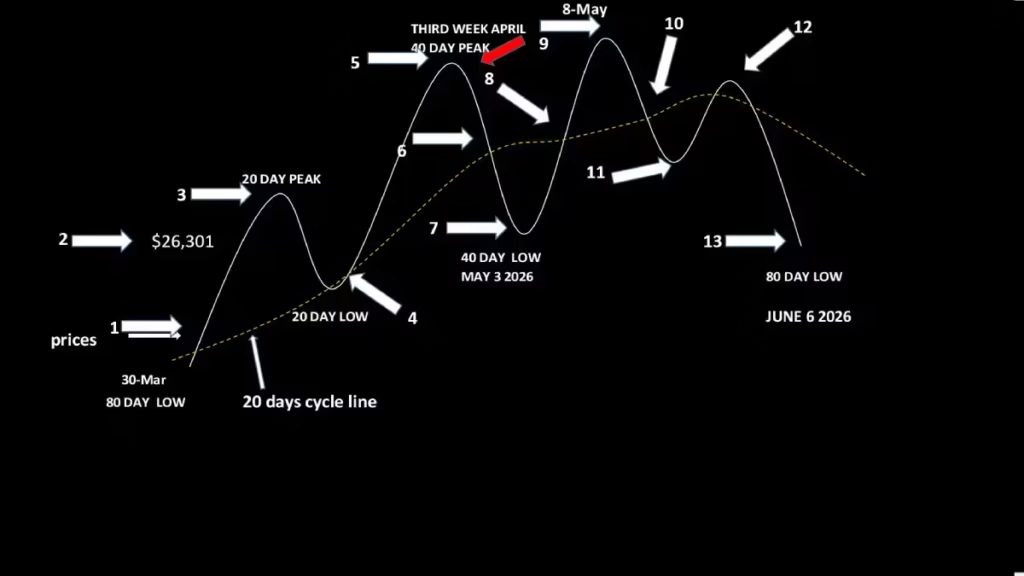
The Roadmap
As mentioned, on April 7, the market crossed above its cycle line (Arrow 1), projecting a $26,301 target (Arrow 2) on its way to its 20-day peak (Arrow 3). Following this, the Nasdaq formed its low well above its cycle line (Arrow 4) and then rebounded to reach the 40-day peak (Arrow 5), likely on April 27. Currently, we are at this juncture ( the red arrow).
After forming this 40-day peak, the Nasdaq is expected to begin a correction and should cross below its cycle line (Arrow 6) on its way to the 40-day low, projected around May 4 (Arrow 7). The market should then rebound, crossing back above its cycle line (Arrow 8) to form its 80-day peak around May 8 (Arrow 9).
Following the peak, the index should cross back below its cycle line (Arrow 10) on its way toward forming the 80-day low.
Before reaching that point, the Nasdaq is expected to form an initial low (Arrow 11) during mid-May, then rebound toward its cycle line (Arrow 12), using it as resistance, before finally resuming its decline toward June 6, where it should establish its major 80-day cycle low (Arrow 13).
Conclusion
In summary, the Nasdaq’s current posture is one of structural strength supported by a powerful 54-month cycle, yet short-term discipline is required as we approach localized peaks.
The integration of AI has extended certain cycles beyond their nominal lengths, but the Hurst principles of synchronicity and summation remain our most reliable guides.
Our analysis of the 80-day and 20-day cycles has yielded a 100% success rate year-to-date, highlighting the accuracy of FLD-based trading signals in the current environment. As we look toward the projected 80-day low in June and the larger 18-month trough in September, traders should remain vigilant for VTL breaches as definitive confirmation of trend shifts.
By adhering to this roadmap, you can capitalize on the inherent bullishness of the Nasdaq while mitigating the risks of the inevitable corrections that define healthy market cycles.
Discover more from tradingmarketcycles
Subscribe to get the latest posts sent to your email.