
Hurst Cycle Analysis: US Dollar & Crude Oil Market Forecast 2026
Introduction
Navigating today’s financial landscape requires looking past the noise of daily news headlines and focusing strictly on market geometry.
By implementing J.M. Hurst’s mechanical cycle principles, we can uncover the underlying rhythmic frequencies that truly govern price action. This comprehensive report delivers a deep structural analysis of two critical global benchmarks: the U.S. Dollar Index and the NYMEX Crude Oil market.
While standard commentators blame recent macroeconomic shocks and sudden geopolitical escalations for violent price swings, our cyclical indicators demonstrate that these precise movements were mathematically turning on schedule.
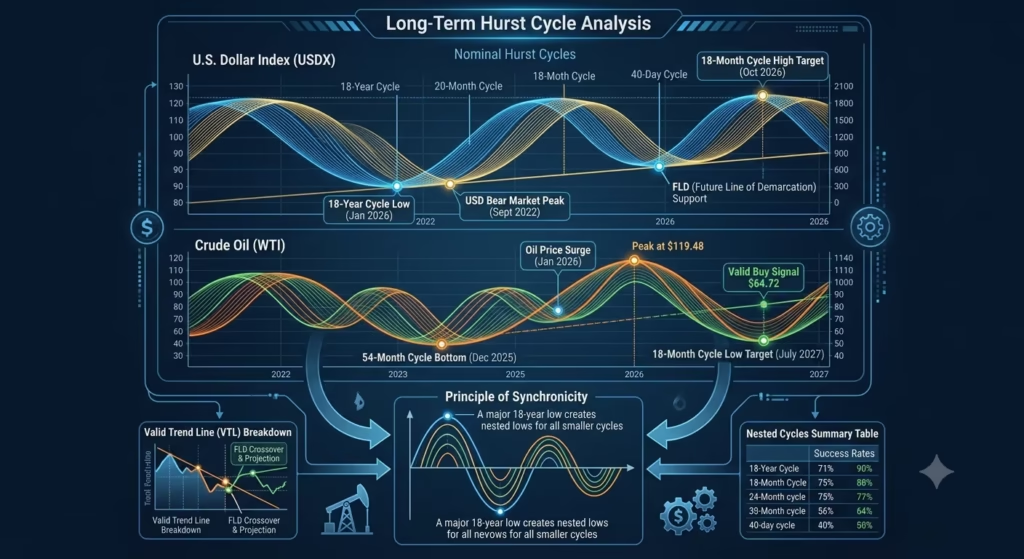
Through key concepts like the Future Line of Demarcation (FLD) and the Principle of Synchronicity, we map out the multi-year structural bottoms established in early 2026.
This technical roadmap separates true structural trend changes from temporary, news-driven volatility, providing active swing traders with highly accurate, validated targets for the ahead horizons.
The Long-Term Picture
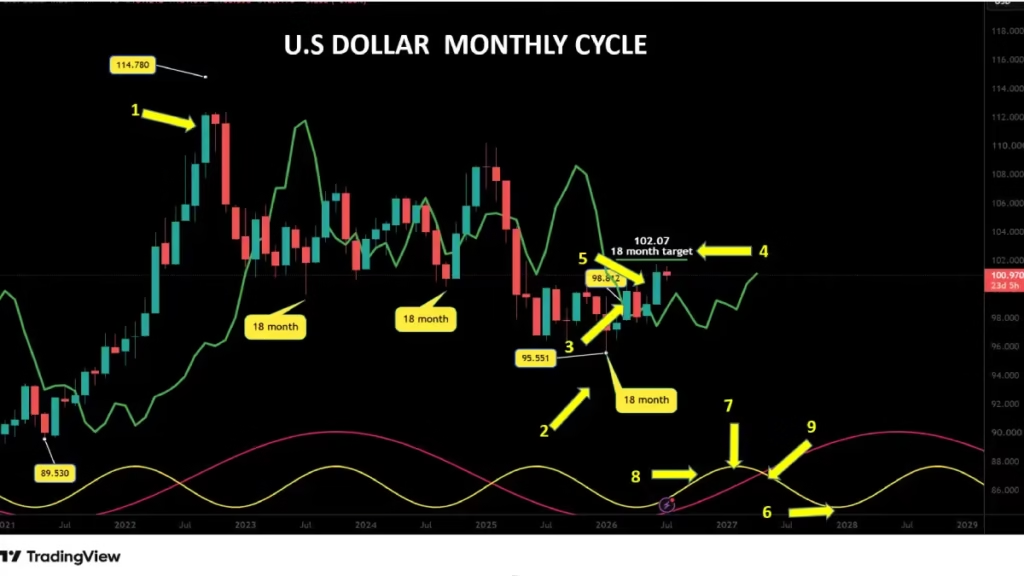
Since reaching a major peak of 114.78 back in September 2022 (arrow 1), the US Dollar has traded within a well-defined structural bear market. Between that September 2022 high and the major low of 95.55 (arrow 2) established in January 2026, the index shed 19.29 points, representing a total decline of 16.75%.
There is currently a very high statistical probability that the January 2026 low marks a significant 18-year cycle low. A look at historical data shows that exactly 215 months or 6,545 days elapsed between the previous major structural low in March 2008 and this January 2026 bottom.
In the standard Hurst nominal model, the 18-year cycle possesses an ideal length of 6,547.2 days, meaning our real-world market cycle missed the theoretical model by a mere two days. To fully understand what the practical implications are from a trading perspective, we must examine the shorter-term cycles.
The 18-Month Cycle
By crossing cleanly above its respective cycle line,(arrow 3) or Future Line of Demarcation (FLD), at 98.81 in April 2026, the U.S. Dollar projected a potential intermediate upside target of 102.07 (arrow 4).
This crucial structural crossing provided traders with another vital piece of analytical information: it officially confirmed that the January 2026 low was indeed a valid 18-month cycle low. Throughout the month of June 2026, the U.S. Dollar rallied to form a local high at 101.80 (arrow 5), which is only 0.27 points or 0.26% below the projected level, meaning our initial target was successfully met.
The next major 18-month cycle low is projected to form around July 2027 (arrow 6), while the crest of this current 18-month cycle is expected to occur in October 2026 (arrow 7). We will need to monitor very closely where this peak prints relative to the nominal cycle center (arrow 8). If the index peaks early—on the left side of the cycle template (arrow 9)—it will signal structural underlying weakness for the U.S. Dollar, and we can expect a sharp correction to follow.
Conversely, if the peak forms later in the cycle window, on the right-hand side (arrow 10), the subsequent correction should remain relatively moderate.
With one positive trading signal out of one attempt, the 18-month cycle maintains a perfect 100% success rate this year.
The 40-Week Cycle
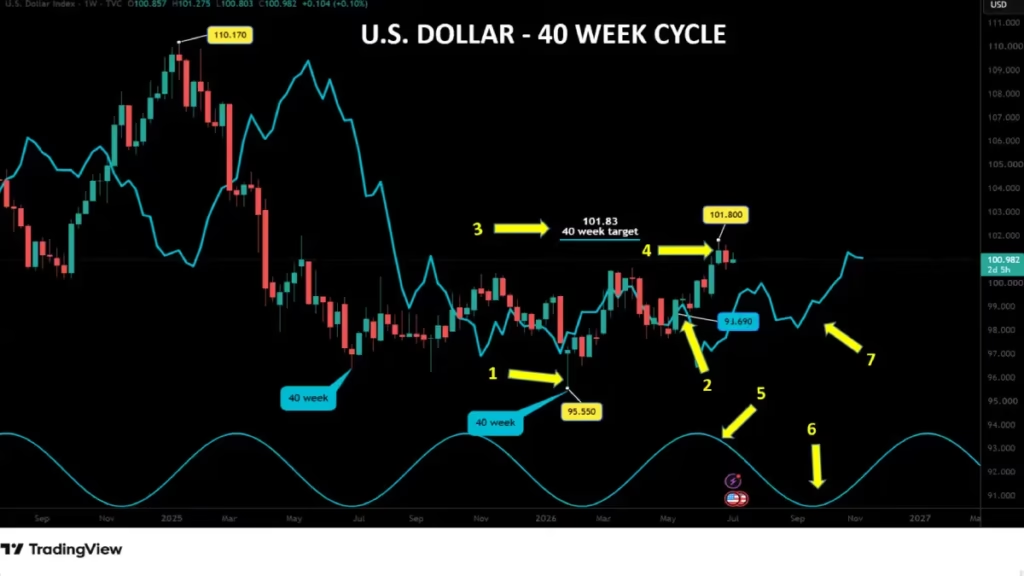
According to the foundational Hurst Principle of Synchronicity, since the major January low was at least an 18-month cycle low, it must simultaneously represent a 40-week cycle low (arrow 1). The bullish crossing above its cycle FLD at 98.69 on May 26 (arrow 2) further verified the formal completion of the 40-week cycle low back in January.
This specific breakout provided an operational upside target of 101.83 (arrow 3). The June high of 101.80 (arrow 4) met this projection perfectly. Because this peak occurred on the right-hand side of the cycle translation (arrow 5), we anticipate a very moderate correction during the development of the next 40-week cycle low, which is expected to find its bottom in September (arrow 6).
The cycle line (FLD) (arrow 7) remains a technically sound candidate for where the U.S. Dollar will establish its next 40-week low.
By successfully hitting its target on the very first trade signal of the year, the 40-week cycle retains a 100% success rate.
The 20-Week Cycle
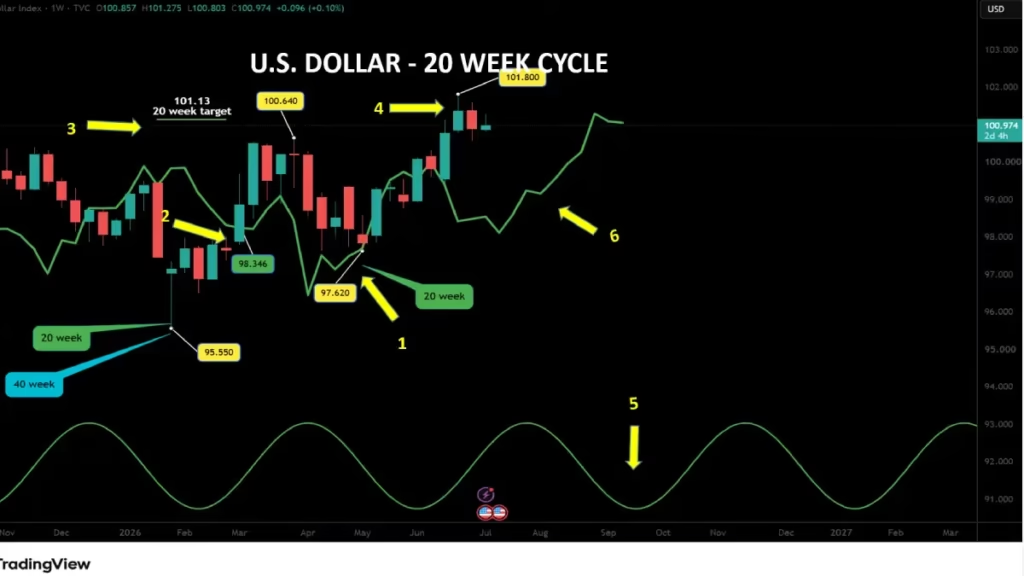
Since the major trend low in January 2026, one complete 20-week cycle concluded its run in May (arrow 1). During the upward expansion phase of this specific 20-week wave, the U.S. Dollar crossed above its dynamic cycle line at 98.34 in March (arrow 2), generating a precise technical target of 101.30 (arrow 3).
After establishing its corrective low in May, the U.S. Dollar staged a strong technical rebound to print a high of 101.80 in June (arrow 4), matching our targeted zone perfectly.
The next 20-week low is expected to form around August (arrow 5). From a technical standpoint, during the downside contraction of this current 20-week cycle, the U.S. Dollar is expected to cross back below its cycle line (arrow 6), which will automatically project a fresh downside price target.
Supported by one highly accurate signal, this cycle boasts a 100% success rate.
The 80-Day Cycle
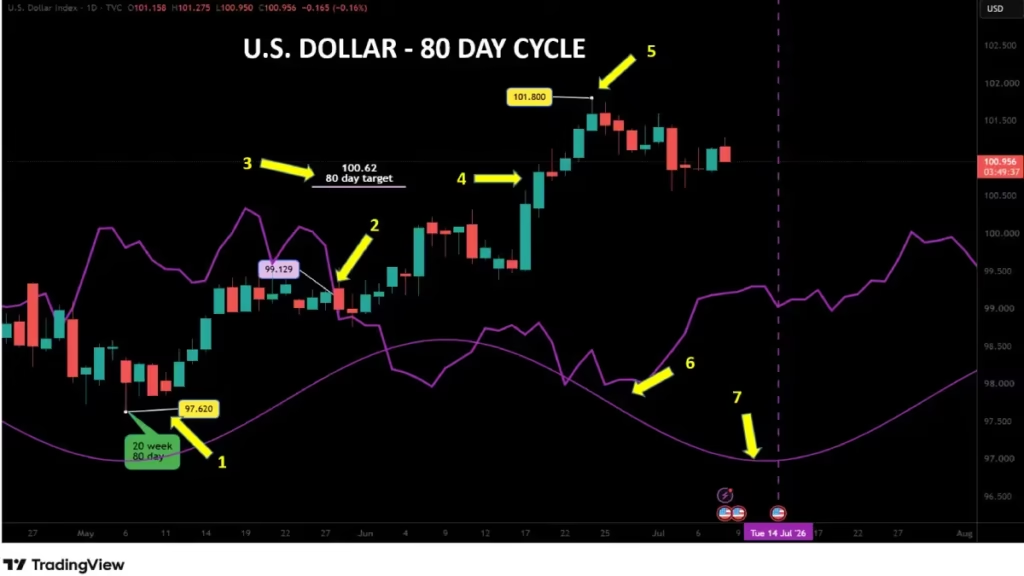
The most recent 80-day cycle printed a formal low on May 6 (arrow 1), aligning perfectly with the conclusion of the previous 20-week cycle low.
On May 28, the U.S. Dollar broke above its 80-day cycle line at 99.12 (arrow 2), establishing a potential short-term upside target of 100.62 (arrow 3). Reaching a high of 100.91 on June 18 (arrow 4), the market once again fulfilled its target flawlessly. Following this achievement, the dollar maintained its upward momentum until eventually carving out a higher peak at 101.80 on June 24 (arrow 5).
This June 24 high represents the formal 80-day cycle peak and occurred on the right-hand side of the cycle alignment (arrow 6), which is an inherently bullish sign for the broader prevailing trend.
Technically, following a right-translated peak, we can expect the upcoming downward correction to be mild. The next cycle low is scheduled to form either late this week or early next week, with the FLD (arrow 7) expected to act as solid structural support.
We must closely monitor the exact geometry of this bottom; if the U.S. Dollar breaks below its cycle line or FLD during this sequence, it will provide a fresh downside projection and signal initial underlying weakness in the dollar’s trend.
The 80-day cycle continues to maintain an unblemished 100% success rate.
The 40-Day Cycle
Utilizing the short-term 40-day cycle is not only highly profitable for active swing trading, but it also serves as a vital tool to identify exactly where the dominant 80-day peak has formed.
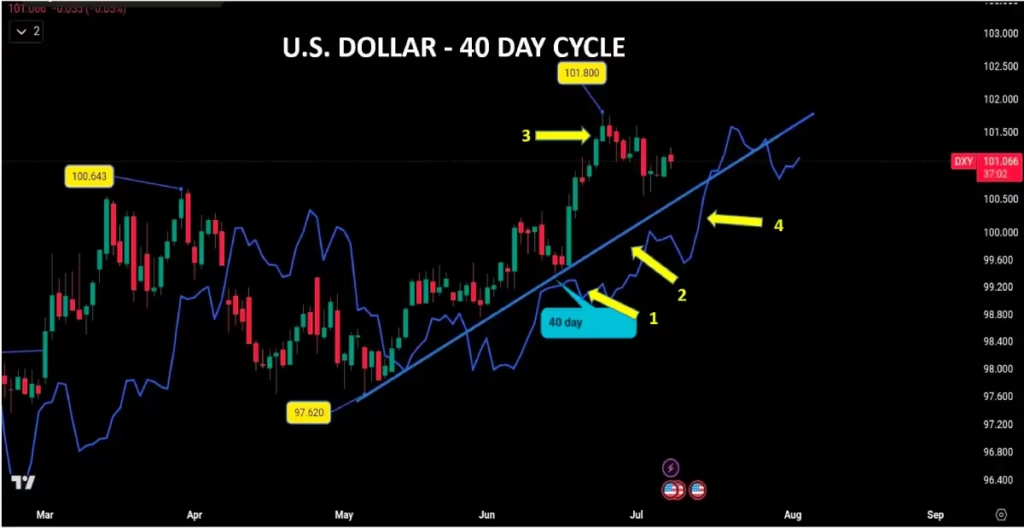
The last 40-day cycle low printed on June 15 (arrow 1). Following the validation of that low, I plotted the official 40-day Valid Trend Line (VTL) the blue line (arrow 2). According to Hurst trading principles, when price breaks cleanly below a valid VTL, it serves as a reliable confirmation that not only has the current cycle peak printed, but the peak of the next longer cycle has also been established.
Therefore, when the U.S. Dollar crosses below this VTL, it will give us final confirmation that the June 24 high (arrow 3) is the official 80-day cycle peak. Mathematically, during the upcoming 40-day low formation, the U.S. Dollar is expected to cross below its short-term FLD (arrow 4) to generate a downside target. This 40-day low is currently on track to form around July 22.
Now, let’s move to the Crude Oil market. To analyze this market, I utilize the Crude Oil Futures market trading on the NYMEX.
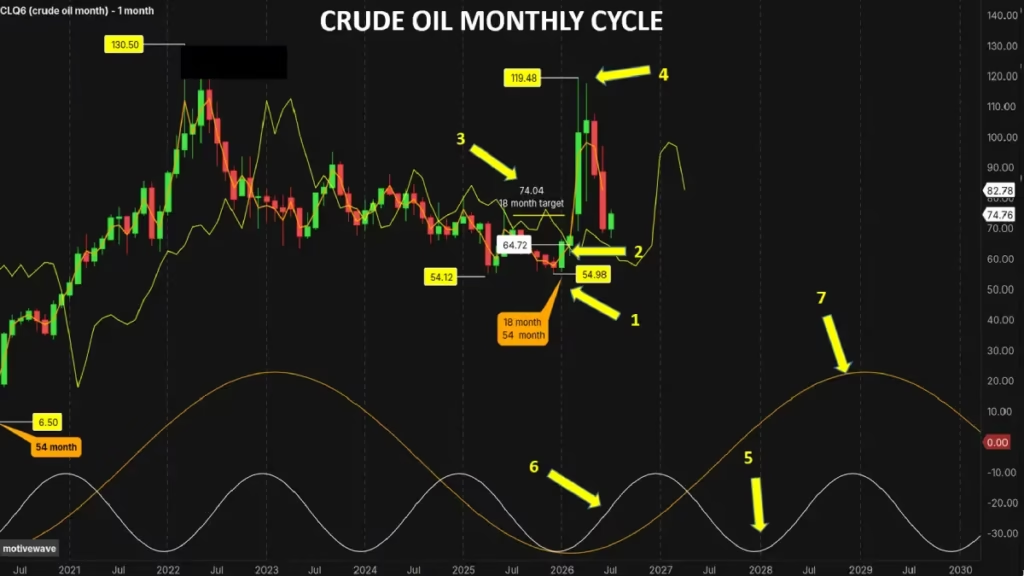
In December 2025, the crude oil market completed a major 54-month (or 3-year) cycle (arrow 1).
This structural bottom is the exact reason why oil prices began to rise in January 2026. It has nothing to do with the war between the USA and Iran. Geopolitical news does not drive the market; news only adds temporary volatility to the price action. We saw this exact same phenomenon with Gold. In January 2026, Gold established a major 16-year cycle peak and has been in a definitive bear market ever since.
If news actually drove the market, the outbreak of war should have caused Gold to surge dramatically. For a deeper analysis of the Gold market, I highly recommend watching my videos or read my posts on Gold.
Let’s return to the long-term cycle analysis for the Crude Oil market.
The Monthly Cycle
In January 2026, the Crude Oil market crossed above its cycle line at $64.72, (arrow 2) triggering a valid buy signal with a projected upside target of $74.04 (arrow 3).
Crucially, this trading signal was generated one month before the war began. The subsequent outbreak of war added extreme volatility to the market, which aggressively pushed Crude Oil up to a peak of $119.48 that same month (arrow 4), easily fulfilling the technical target.
The next major 18-month cycle low is expected to form in July 2027 (arrow 5).
At the bottom of the chart, the white sine waves (arrow 6) represent the 18-month cycle, while the yellow sine waves (arrow 7) track the larger 54-month cycle.
What should we expect next for the Crude Oil market?
Let’s look at the shorter-term horizons, starting with the 40-week cycle.
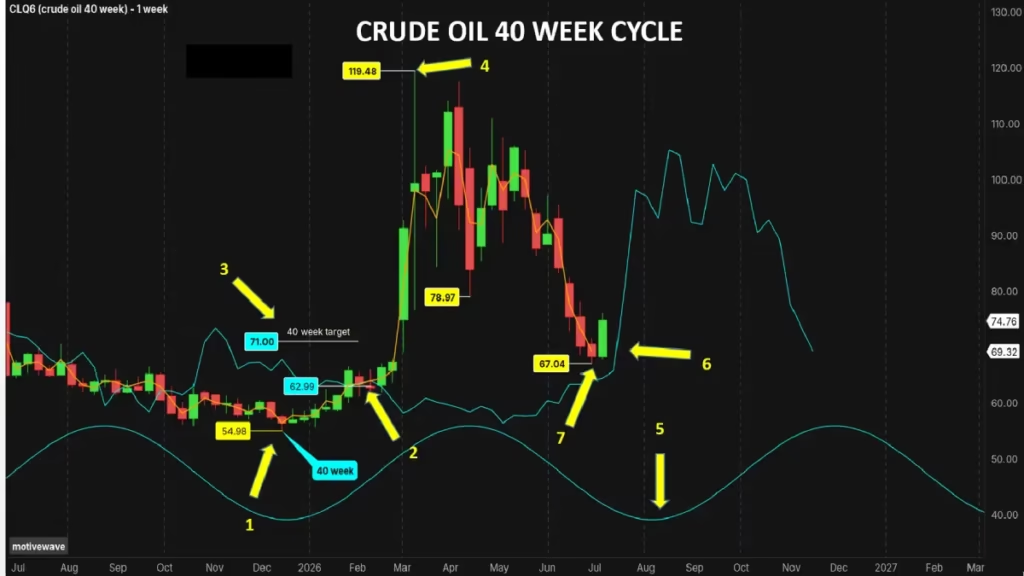
According to Hurst’s critical principle of synchronicity, the last 40-week cycle formed its low simultaneously with the 18-month cycle in December 2025 (arrow 1). During the ensuing rally, the crude oil market crossed above its cycle line at $62.99 (arrow 2), establishing a potential upside target at $71 (arrow 3). Due to the high volatility, this target was rapidly met and significantly exceeded.
After topping out at the $119.48 peak (arrow 4), the crude oil market began its correction on its way down to form the next 40-week cycle low, which is expected to bottom during the second week of August (arrow5).
The cycle line, or Future Line of Demarcation (FLD) (arrow 6), will serve as the ideal technical support for this low.
If the crude oil market breaks sharply below this cycle line during the formation of the 40-week cycle low, we can anticipate further downside and even cheaper oil prices ahead.
During the final week of June, the crude oil market established a low at $67.04 (arrow 7), shedding $52.44 or nearly 44% from its $119.48 peak.
The 20-Week Cycle
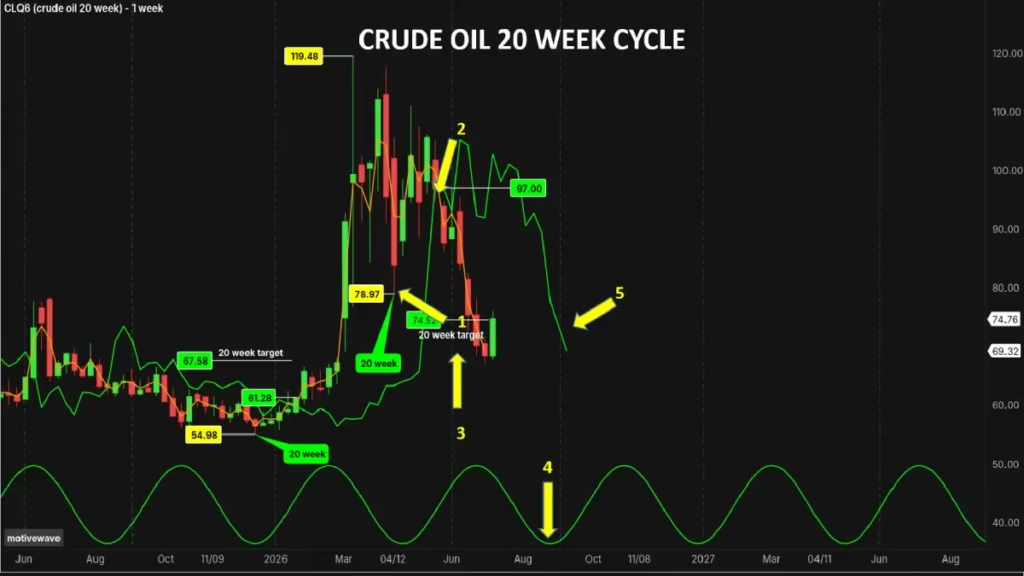
The previous 20-week cycle formed its low on April 17 (arrow 1), experienced a brief rebound, and then resumed its broader decline.
During this downward move, the crude oil market crossed below its cycle line at $97 on May 26 (arrow 2).
This technical cross projected a downside target of $74.52 (arrow 3), which the market successfully met in mid-June.
The next 20-week cycle low is scheduled to form during the second week of August (arrow 4).
Technically, after establishing this upcoming 20-week cycle low, the crude oil market should cross back above its cycle line (arrow 5) to provide a new potential upside target.
This target will likely cluster around the 40-week cycle line. However, if the crude oil market fails to cross above its cycle line (FLD) during this upcoming rally, we can expect the broader decline to resume.
The 80-Day Cycle
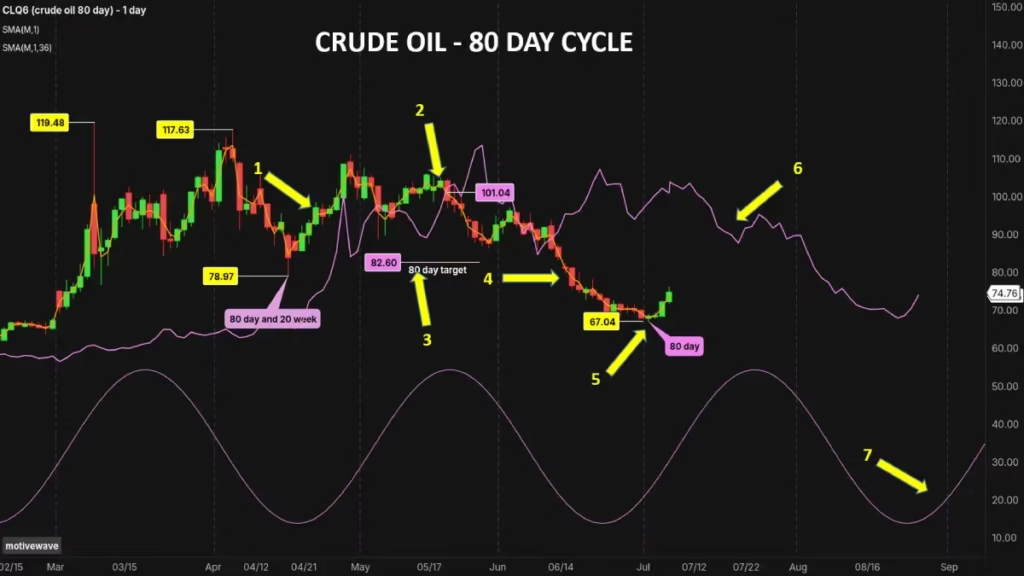
Following the April rally (arrow 1), the crude oil market crossed below its cycle line at $101.04 (arrow 2), generating a downside target of $82.60 (arrow 3).
On June 15 (arrow 4), the oil market met this target and ultimately overshot it to form a structural low at $67.04 on July 2 (arrow 5).
This print marks the completion of the first 80-day cycle since the last 20-week cycle low. Knowing that we always have two 80-day cycles embedded within a single 20-week cycle, we should expect further intermediate decline.
However, on a very short-term basis, we can expect a temporary relief rally toward the cycle line (arrow 6). The market will likely use this line as resistance before turning downward into the next major 80-day cycle low scheduled for September 3 (arrow 7).
The 40-Day Cycle
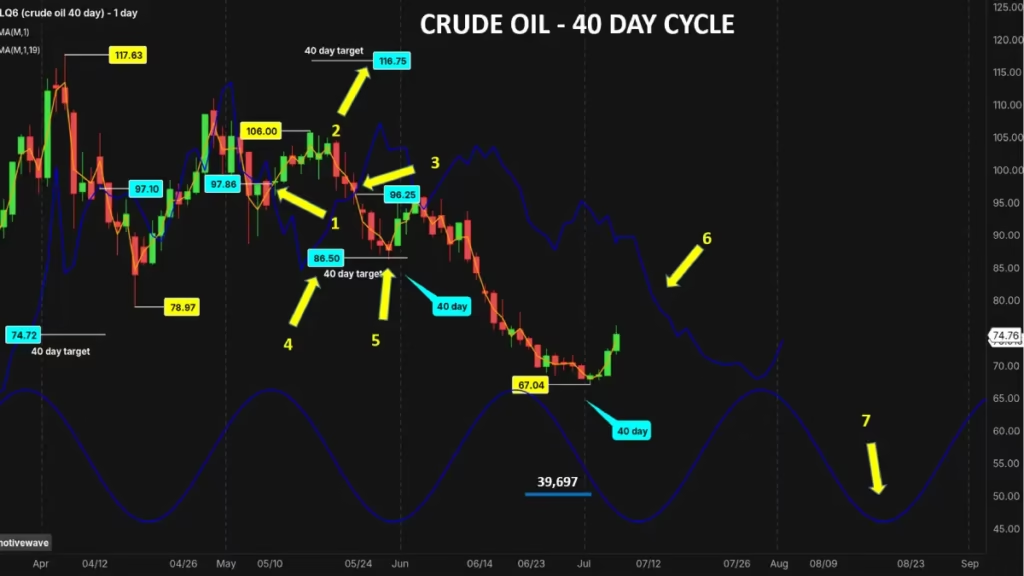
Following the April 17 low, the crude oil market crossed above its cycle line on May 12 at $97.86 (arrow 1), projecting a potential upside target of $116.75 (arrow 2). However, by crossing back below its cycle line on May 26 (arrow 3) before hitting that level, the oil market provided us with two critical pieces of information.
First, by crossing back under the cycle line without meeting the projection, the market completely invalidated the $116.75 target.
Second, and perhaps most importantly, this failure confirms an immense amount of underlying bearishness in the oil market. This downward cross occurred at $96.25 and offered a revised downside target of $86.50 (arrow 4).
The market hit this target the exact day of the 40-day cycle low formation on May 29 with a print of $86.35 (arrow 5), representing a perfect alignment of time and price.
Following the formation of the second 40-day low on July 2, the crude oil market is technically expected to cross above its cycle line (arrow 6) to provide a very short-term upside target. The next 40-day cycle low formation is scheduled for August 5 (arrow 7), and this structural low is highly likely to form well below its cycle line.
Conclusion
Analyzing the structural interconnections between the U.S. Dollar Index and Crude Oil through Hurst’s nominal framework reveals a highly synchronized market environment. The definitive technical landmarks met throughout the first half of 2026 validate the exceptional predictive accuracy of time-and-price clustering. As the U.S. Dollar targets a vital 80-day cycle bottom in late July and moves toward an anticipated 40-week cycle trough this September, its broader translation will dictate the directional momentum for major cross-assets.
Concurrently, Crude Oil’s definitive rejection of unfulfilled upside targets underscores a deep, latent bearishness that news cycles cannot conceal. By tracking price interactions with the Future Line of Demarcation (FLD) across multiple time horizons, traders can successfully sidestep media traps and execute high-probability setups. Stay grounded in these objective cyclical baselines as we approach the next major clusters scheduled for late 2026 and mid-2027.
Discover more from tradingmarketcycles
Subscribe to get the latest posts sent to your email.