
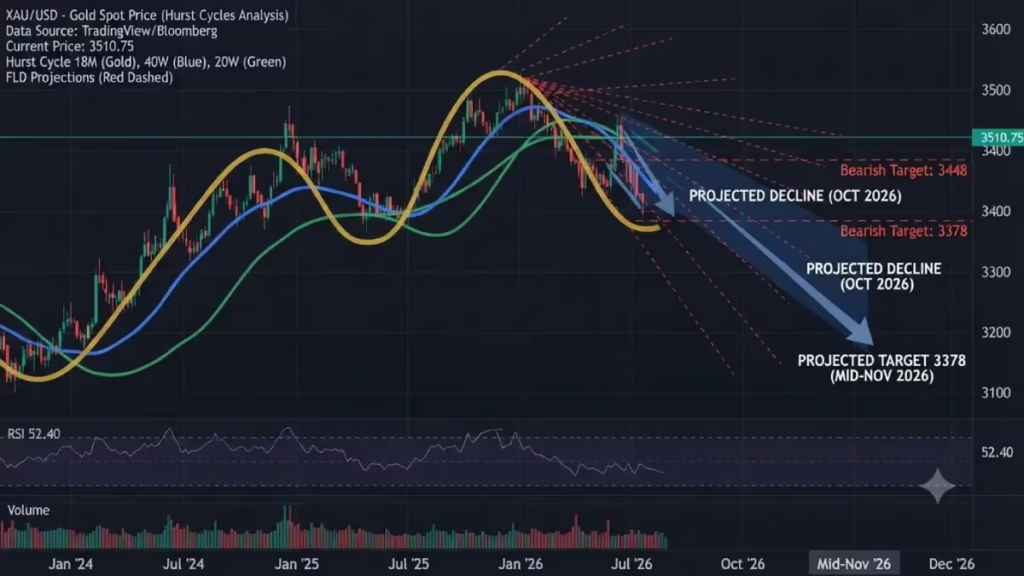
Gold Market Analysis August 2026: Hurst Cycle Projections & FLD Targets
Introduction
Welcome back to the weekly gold market analysis. The $3,378 and $3,448 price levels previously served as the primary 20-week and 40-week downside price targets for gold. The key question traders face right now is whether the gold market will proceed to hit these downside targets or if it is preparing to establish a foundation for a fresh bullish breakout. That is precisely what we will explore and break down in this weekly market update for August 10, 2026.
To gain a clear perspective on current market conditions, we must first refresh our memory regarding the broader cyclic picture.
By examining the overarching 18-month cycle, we can establish the necessary structural framework to understand shorter-term price fluctuations. Navigating these synchronized wave structures allows us to systematically evaluate current momentum, confirm critical technical levels, and anticipate potential turning points in the weeks ahead.
The 18 Month Cycle
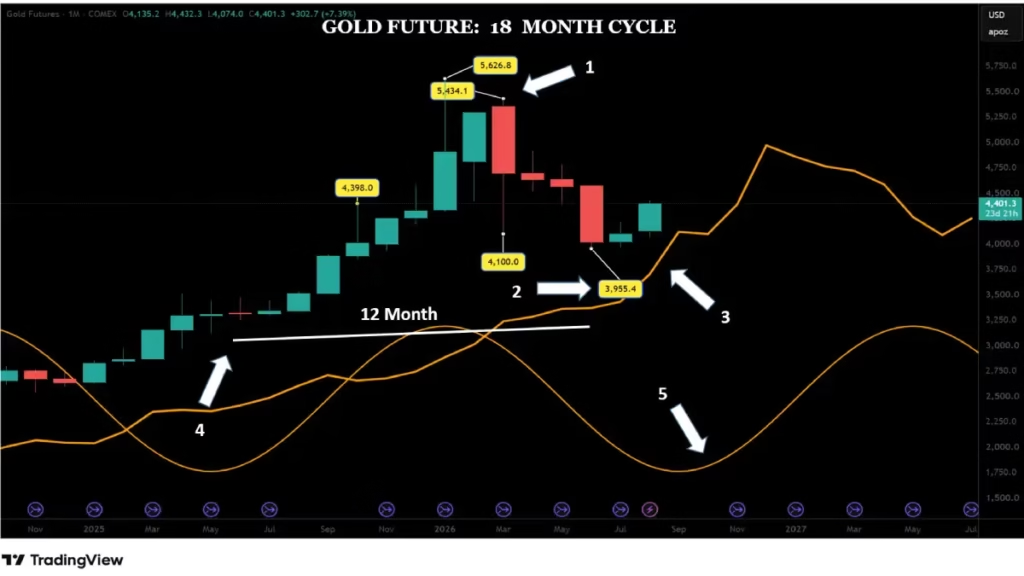
As highlighted in my previous gold market update, the $5,626.80 all-time high recorded in January (arrow 1) stands with high certainty as a very long-term cycle peak—most likely representing a 16-year cycle crest. Since establishing that historic high, the gold market declined significantly into a June low of $3,955.40 (arrow 2), shedding $1,671.40 or 29.70% from its peak. Since making that June low, gold has been trading directly along its Future Line of Demarcation (FLD) (arrow 3). Furthermore, 12 months have now elapsed since the previous 18-month cycle low formed in 2025.(arrow 4)
Does this elapsed time imply that the broader market decline has concluded? To answer this, we must analyze the shorter constituent cycles. Under the standard nominal model, the current 18-month cycle was scheduled to form its trough between November and December (arrow 5). For the long-term trend, it remains critical that gold continues to trade above its FLD; a sharp and decisive cross below this line would signal compounding bearishness, opening the door for significantly further decline.
The 40 week Cycle
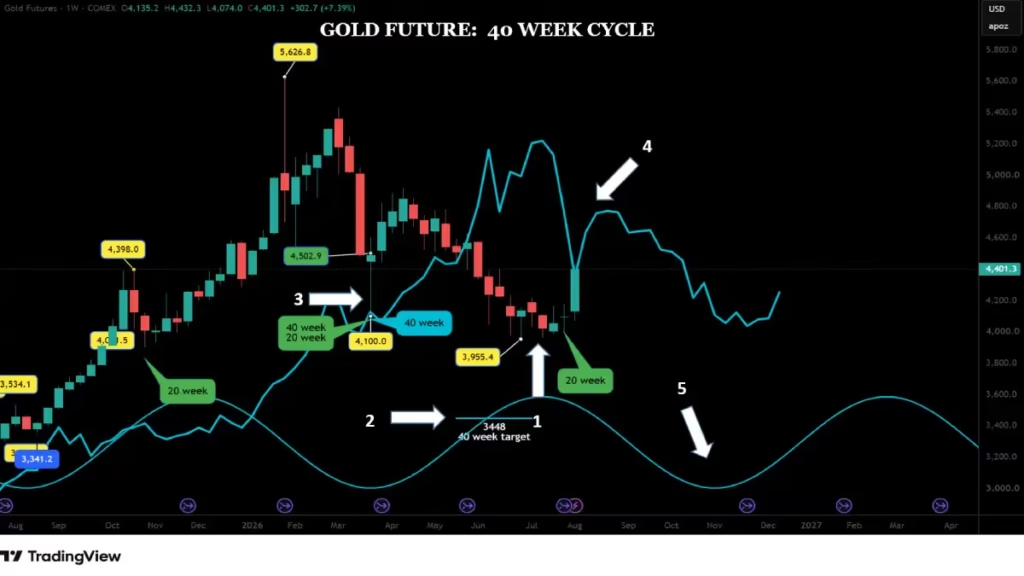
The $3,955.40 low (arrow 1) was formed $507 (or 14.70%) above our lower $3,448 downside target (arrow 2). Since the previous 40-week cycle low in March 2026 (arrow 3), the market has shown no definitive signals that a new macro bull trend has commenced. For a genuine bull run to initiate, the gold market must cross sharply and cleanly above its 40-week FLD (arrow 4). Until such a breakout occurs, the downside target at $3,448 remains fully valid. Currently, gold has rebounded toward its FLD and is expected to treat this line as dynamic overhead resistance. The next major 40-week cycle low is projected to form around mid-November (arrow 5).
The 20 week Cycle
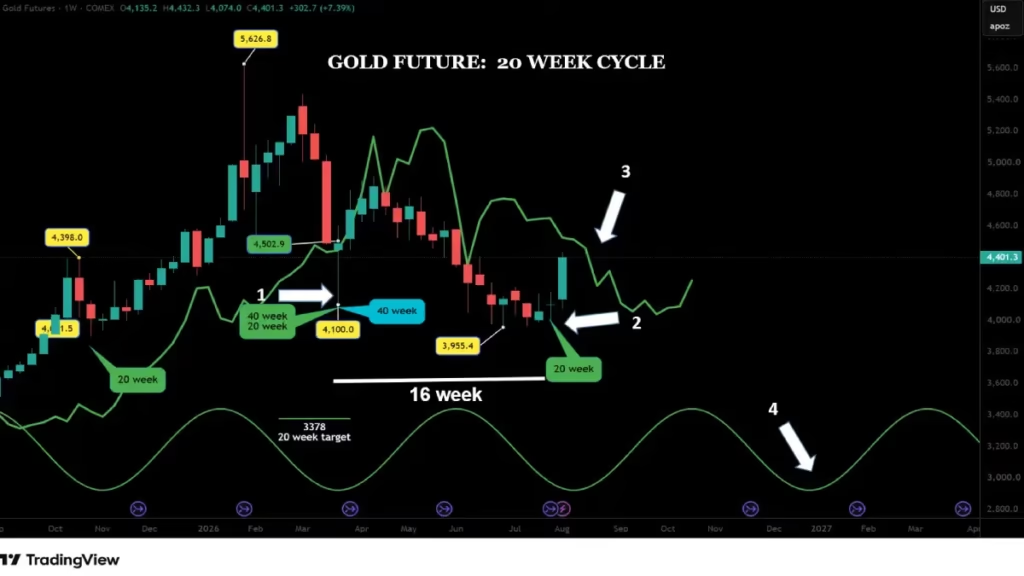
According to Hurst’s Rule of Synchronicity, the March 40-week cycle low was simultaneously a low for the 20-week cycle (arrow 1). Understanding this rule of synchronicity is vital for traders: analyzing shorter cycles frequently enables us to pinpoint longer-term cycle troughs with a high degree of success.
Between the March low and the July trough, 16 weeks elapsed (the white line). Given that the 20-week cycle carries an average nominal length of 19.48 weeks, we can begin evaluating the strong possibility that a 20-week cycle low formed in July (arrow 2). However, we must remain prudent and acknowledge the alternative scenario: the 20-week low may not be fully established yet.
What comes next for the 20-week cycle?
If we assume the July low represents the true 20-week cycle trough, gold should technically encounter resistance at its FLD (arrow 3) before resuming its downward trajectory toward its price targets and forming the final 20-week low of this combined 40-week and 18-month trough structure. This low should materialize around mid-November (arrow 4). If the 20-week low has not yet formed, we will recalculate the timing metrics accordingly. A clean upward breakout through the FLD would definitively confirm that July marked the 20-week trough.
The 80 Day Cycle
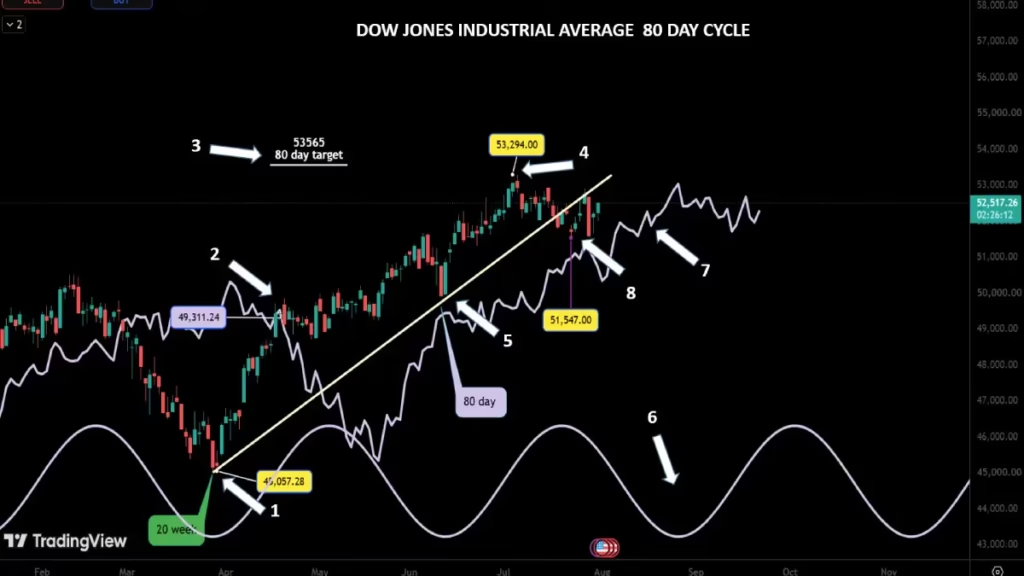
From the March 2026 low (arrow 1), two distinct 80-day cycles have completed: the first concluded on May 28 (lasting 66 days) (the white line) and the second on July 29 (lasting 62 days) (the white line). Both align closely with the Hurst nominal average of 68 days.
On August 5 (arrow 2), gold crossed above its 80-day FLD at $4,185, activating an upside projection toward $4,407 (arrow 3). On Friday, August 7, (arrow 4) gold reached a high of $4,432.30, successfully fulfilling this objective. The next 80-day cycle low is scheduled for approximately October 2 (arrow 5), with the peak expected around late August (arrow 6). We must monitor whether this upcoming peak forms to the left (arrow 7) or right (arrow 8) of the cycle midpoint; a left-translated peak would indicate underlying weakness and signal a sharp decline into the next correction.
The 40 Day Cycle
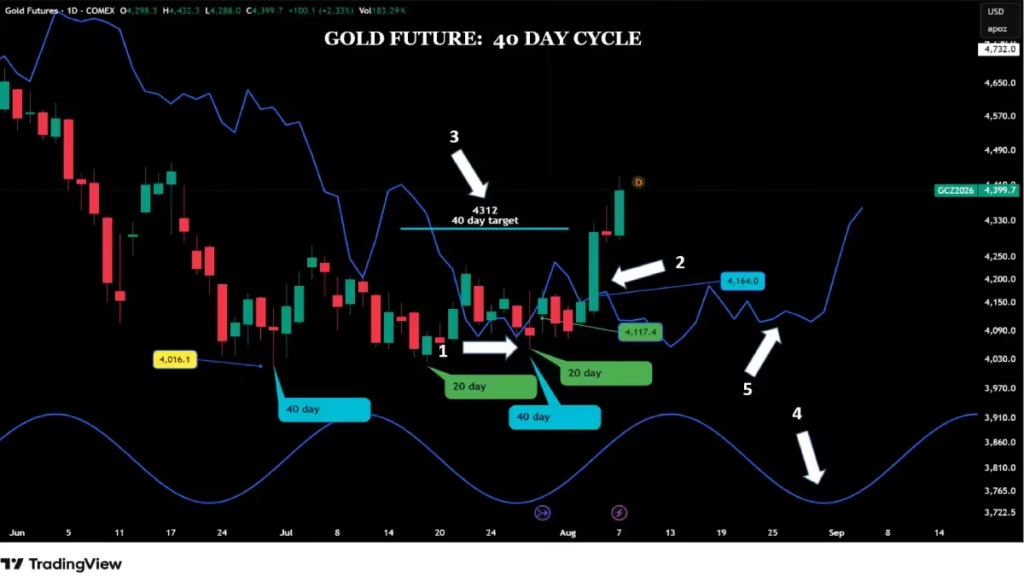
On July 29 (arrow 1), gold completed its latest 40-day cycle low. Because this represents the fourth 40-day cycle since the March low, it reinforces the likelihood that the July low also served as the larger 20-week cycle trough.
On July 5, gold crossed above its FLD at $4,164 (arrow 2), projecting an upside target of $4,312 (arrow 3), which was met that very same day during a powerful $207 daily expansion range. This magnitude of price action confirms July 29 as a major structural turning point, placing the odds heavily in favor of a completed 20-week low. By crossing its FLD, gold confirmed July 29 was at least a 40-day trough. The next 40-day low is expected around September 1(arrow 4). In a balanced market structure, gold should find support along its cycle line (arrow 5) near $4,220 during this pullback; conversely, a clear breakdown below the FLD would reconfirm lingering bearish pressure.
The Short-Term Trader’s Corner: The 20-Day Cycle
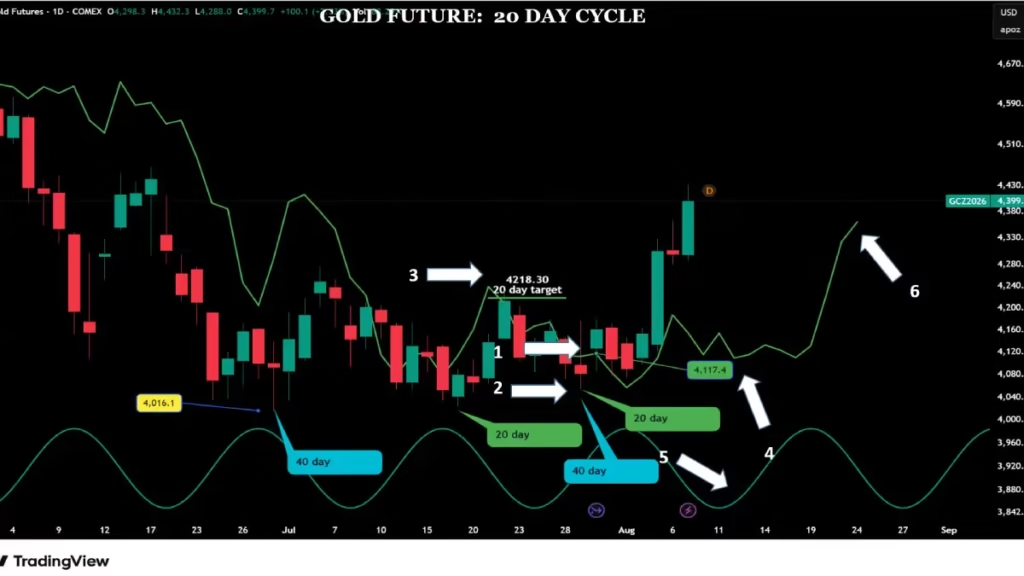
The day after establishing its 20-day cycle low on July 29, gold crossed back above its FLD, providing two critical pieces of information:
1. Crossing the cycle line (arrow 1) confirmed that July 29 was at least a 20-day low (arrow 2), and as the eighth 20-day cycle since March, it solidifies the case for the July 20-week cycle low.
2. The breakout projected a short-term upside target of $4,218 (arrow 3), which was hit rapidly on August 5.
Looking ahead, we anticipate the next 20-day cycle low to form around August 15 (arrow 4), ideally finding support near its cycle line at $4,100 (arrow 5). Following this low, price should rebound toward its next 20-day peak.
Once that peak forms, gold is expected to cross back below its cycle line (arrow 6), triggering a downside target toward its 40-day FLD. After forming the 40-day low, price may briefly pop above its cycle line to set a minor upside target; however, because the dominant longer-term cycles are down-trending, there is a high probability this upside target will fail to reach completion. Gold should then cross back below its FLD into the October 2 low, triggering further downside projections. Before hitting that October 2 target, expect an initial minor low around late August to early September, followed by a retest of the FLD as resistance before descending into the major October low.
Conclusion
In summary, the gold market is navigating a complex matrix of overlapping cycle frequencies. While short-term upside targets—such as the recent 80-day FLD projection at $4,407—have been successfully achieved, the larger macro picture remains constrained by longer-term cyclic forces. The upcoming price action into late August and early September will be vital for short-term and long-term traders alike, as we monitor whether gold respects its FLD levels as dynamic resistance.
As we approach key timing windows—specifically the projected 80-day cycle low on October 2 and the major synchronized 20-week, 40-week, and 18-month cycle troughs in mid-November—risk management remains paramount. Traders should closely track FLD crossovers and support/resistance interactions at the $4,100 and $4,220 levels to confirm structural bias. Stay disciplined, stick to the cycle roadmap, and join us next week as we continue to track these evolving price projections.
Discover more from tradingmarketcycles
Subscribe to get the latest posts sent to your email.