
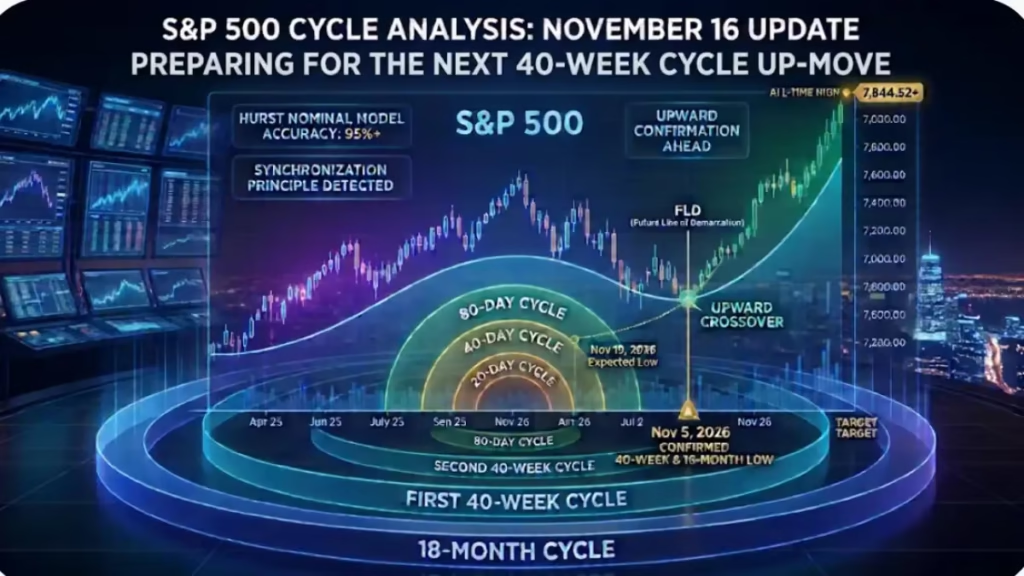
S&P 500 November 16, 2026 Weekly Update & Cycle Analysis
Introduction
S&P 500 November 16 Update
Weekly Update for November 16, 2026 — This week, we will analyze the S&P 500. It has been a while since our last update on the index; at that time, we expected a 40-week and an 18-month cycle to run their course. Let’s see if the expected cycles have formed.
The 40 weeks
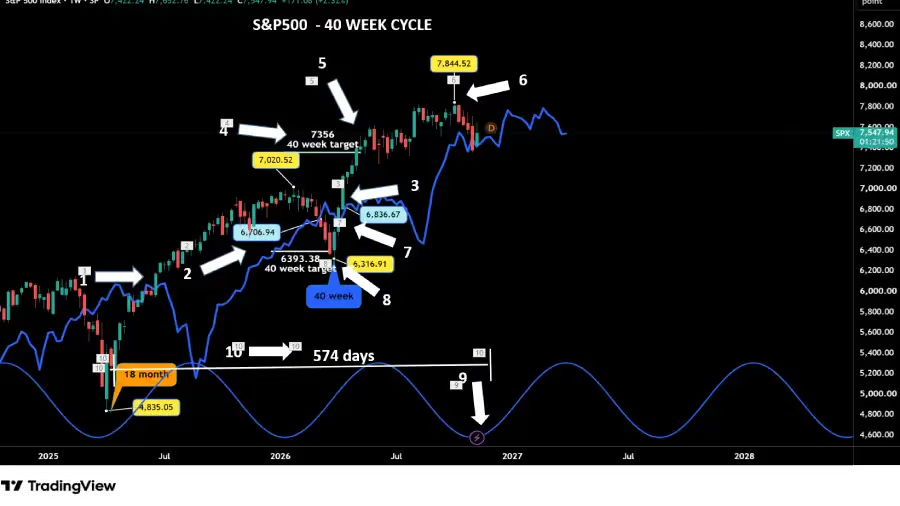
Let’s start with the 40-week cycle. During my last update on June 29 (arrow 1), we expected the 40-week cycle to form in mid-August (arrow 2). Let’s see what has happened since then. As mentioned in that update, the S&P 500 crossed above its cycle line at 6,836 (arrow 3), providing a potential upside target of 7,356 (arrow 4).
This target was met about one month later in May (arrow 5), and the index went on to form a new all-time high at 7,820.90 on June 2. After forming that peak, the S&P 500 continued its upward move until reaching an all-time high of 7,844.52 on October 5 (arrow 6).
The crossing above the 40-week cycle FLD on April 6 (arrow 7) confirms that the March low (arrow 8) is at least a 40-week cycle low. Because of this, the regular November 2025 possible 40-week low had to be displaced to March 30, 2026. The first 40-week cycle was 50 weeks long. Adding 34 weeks from that point gives us the week of November 23 (arrow 9) for the second and final 40-week cycle in this 18-month cycle.
The November 5 low of 7,350.35 is the possible second 40-week cycle low. If we place the 40-week low on November 5, this will be 574 days since the last 18-month cycle low in April 2025 (arrow 10).
On the Hurst Nominal Model, the 18-month cycle is 545.6 days long, which is just 29 days longer than the original model discovered more than 50 years ago. Therefore, we can assume with a very high degree of confidence that the November 5 low is both the 40-week cycle low and the 18-month cycle low.
However, before officially labeling this low as the 40-week and 18-month bottom, we need confirmation. We will get that confirmation by analyzing the shorter cycles, especially the 20-day cycle.
The 20 weeks
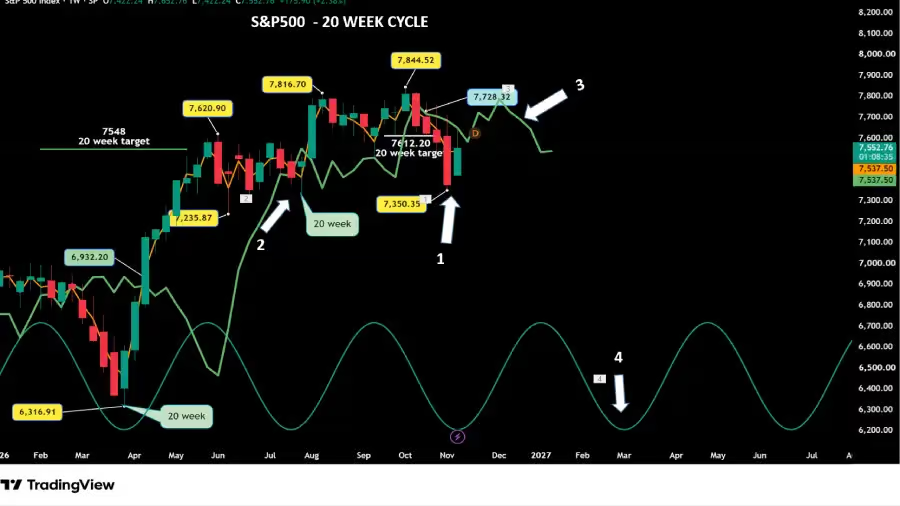
Now, let’s move to the 20-week cycle. If we place the second 20-week cycle since the last 40-week cycle on November 5 (arrow 1), this 20-week cycle will be 14 weeks long—3 weeks shorter than the Hurst Nominal Model.
The first 20-week (arrow 2) cycle was 17 weeks long, which was 2.48 weeks shorter than the original Hurst Nominal Model. When will we have confirmation of the actual 20-week cycle formation?
The first confirmation will occur on the 20-day cycle when the market crosses above its cycle line, and the second confirmation will happen when the S&P 500 crosses above its 20-week FLD (arrow 3).
Both crossovers will also provide a potential upside target. If the 20-week cycle truly formed on November 5, then we can expect the next one to form during the second week of March 2027 (arrow 4). In the meantime, we will focus on the shorter cycles, starting with the next one down: the 80-day cycle.
The 80 Day
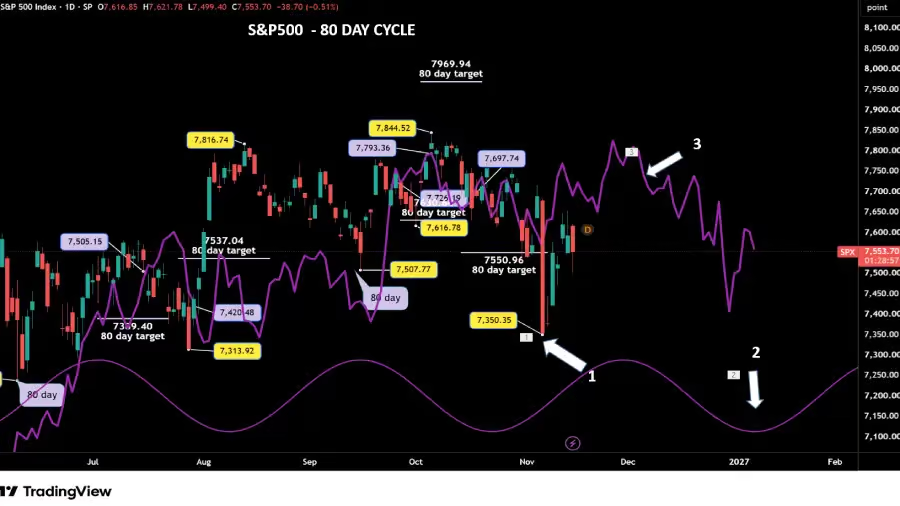
Let’s assume the 20-week cycle formed on November 5 (arrow 1). Because of the Principle of Synchronization, it is also the 80-day cycle low, meaning we have started a new 80-day cycle, and the next 80-day cycle low is scheduled for January 12, 2027 (arrow 2).
To confirm that the 80-day cycle formed on November 5, the S&P 500 has to cross above its FLD (arrow 3); when this happens, the crossover will trigger a new potential upside target. If November 5 is also an 18-month cycle low, we can expect a very strong upside move.
For followers who want to trade the 80-day cycle, I recommend studying the 20-day cycle analysis , where I explain in detail the roadmap using the 20-day cycle and its FLD to successfully trade the 80-day cycle.
If the actual 80-day cycle low is still ahead of us and forms around the second or third week of November—as expected at the beginning—then we should move the January 12, 2027 target date for the next 80-day cycle forward by the same number of days.
According to Hurst’s rules, the 80-day cycle low will be confirmed when the S&P 500 market crosses above its cycle line. However, for some traders, that is a long time to wait; to avoid missing potential upside moves, the best approach is to use the 20-day cycle.
The 40 Day
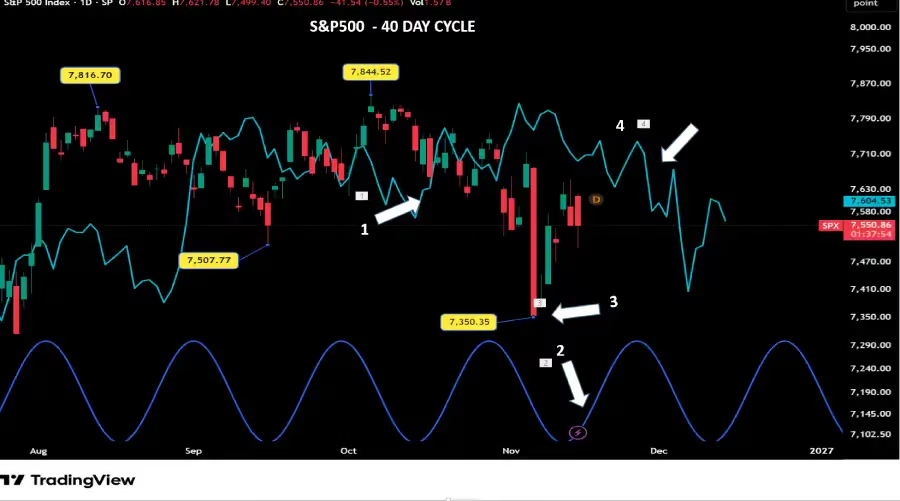
Up to date, the current 40-day cycle, which started on October 16 (arrow 1), is only 28 days long. To match the Hurst Nominal Model’s average length of 34 days, we need 6 more days. In this case, we can expect the low to form on November 19 (arrow 2).
This 40-day cycle should technically complete the 40-week cycle that started in March 2026. However, as I mentioned earlier, November 5 (arrow 3) could also be the 40-week cycle low. When the S&P 500 crosses above its FLD (arrow 4), we will be certain that the 40-day cycle has formed its low. The lowest point before crossing above its FLD will mark the 40-day, 80-day, 20-week, and 40-week low. In the meantime, we need to wait for confirmation.
The 20 Day
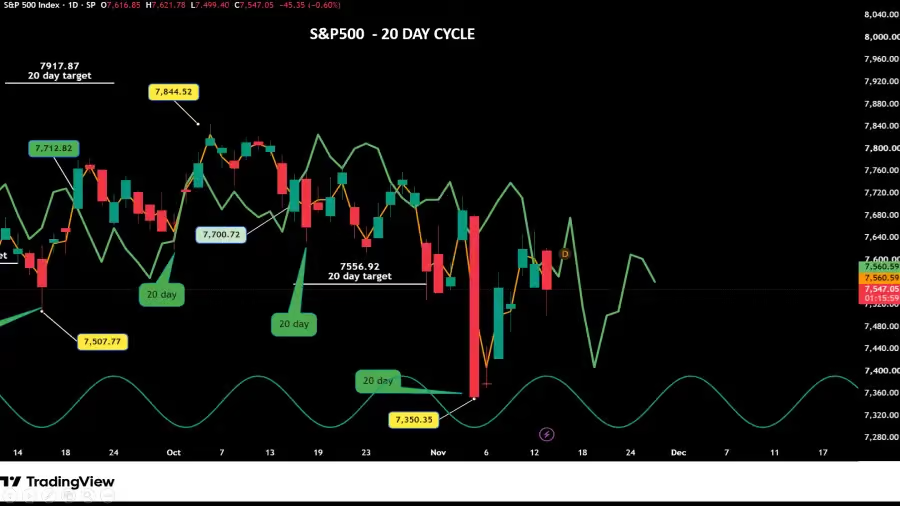
For the 20-day cycle this week, we will use the Roadmap to follow the S&P 500 market. Following the formation of an 80-day cycle low, the market sequence is expected to unfold as follows:
The Roadmap of the S&P 500
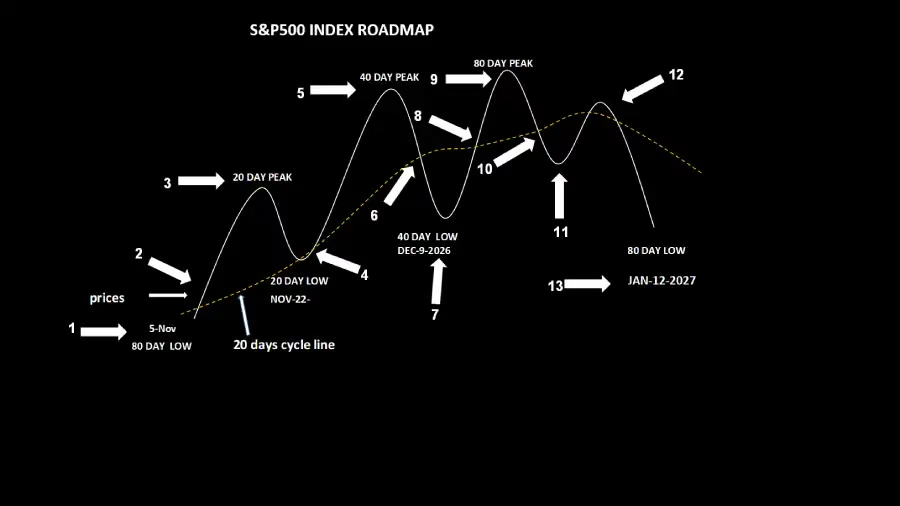
- Initial Rally & 20-Day Low: Assuming the 80-day low formed on November 5 (arrow 1), we expect the market to cross above its cycle line (arrow 2), providing a potential target on its way to forming its 20-day peak (arrow 3). Then, the S&P500 market should start a correction to form its 20-day cycle low along its cycle line around November 22 (arrow 4), and subsequently rebound as it moves toward the 40-day cycle peak, which can be expected later this week (arrow 5).
- 40-Day Cycle Low: After peaking, the S&P 500 should cross back below its FLD (arrow 6) to establish its 40-day cycle low around December 9 (arrow 7). This downward crossover will generate a new short-term downside target.
- Rebound to 80-Day Peak: The S&P 500 will then cross back above its FLD (arrow 8), projecting a short-term upside target for the 80-day cycle peak (arrow 9).
- Final Decline into January 2027 Low: After reaching the 80-day peak, price will cross below its FLD (arrow 10) on its way to the next 80-day cycle low. Prior to reaching the final bottom, price will form a preliminary low (arrow 11), rally back toward the FLD (arrow 12)—using it as resistance—and resume its decline to form the full 80-day cycle low around January 12, 2027 (arrow 13).
Note: If the 40-week cycle low is still ahead of us, this means we can expect another 20-day cycle to develop. In that case, we will update the roadmap dates accordingly based on Hurst model cycle lengths.
Conclusion
Even though using Hurst cycle principles when trading or analyzing the stock market is very efficient, it is not a crystal ball. Sometimes we encounter situations where it is not easy to identify the low at the exact moment, usually due to market news—which is actually the case right now with the 40-week cycle. What is happening in the stock market right now is a textbook example.
Here is the story: as I said before, we are expecting the 40-week cycle to form its low during the week of November 23. However, there is a possibility that the 40-week cycle ended two weeks ago with the big drop. If this is the case, the 40-week cycle will have been a bit shorter than expected—31 weeks long instead of 34. This is common because Hurst established the Principle of Variation, which means that cycles are sometimes a little longer and sometimes a little shorter.
At the same time as the 40-week cycle, the 18-month cycle is also supposed to end (due to the Principle of Synchronization), because this is the second 40-week cycle since the last 18-month cycle. The last 18-month cycle occurred in April 2025; if it ends this month, it will have been 19 months long. On Hurst’s model, the 18-month cycle has an average length of 17.93 months. Technically, to follow Hurst’s model perfectly, we are still missing a few days, so there is slight uncertainty regarding the exact end of the 18-month and 40-week cycles.
How do we resolve this? It is very simple: when there is doubt regarding the end of a long cycle, you must analyze the shorter cycles—starting with the 20-week cycle, and if there is still doubt, moving down to the 80-day cycle, and so on—until you reach the cycle where you are certain of the low’s formation. Since Hurst established the Principle of Synchronization, if an 18-month or 40-week cycle has just ended, all shorter cycles must end at the same time.
Therefore, you have to look down to the 20-day cycle, which must bottom out alongside all the longer cycles. We will have confirmation that the 40-week cycle has indeed ended when the market crosses above its FLD. Remember, when the market crosses above its FLD, this not only provides a potential upside target, but also confirms that the cycle corresponding to that FLD has formed. However, waiting for a long-term FLD crossover can take several weeks.
Fortunately, there is a shorter-term solution for getting confirmation. In our case, since we are waiting for the formation of at least a 40-week cycle—and applying the Principle of Synchronization—the 20-day cycle should also form at the same bottom.
Therefore, when price crosses above the 20-day FLD, it will confirm not only that the 20-day cycle is complete, but also that all the longer cycles—including the 40-week cycle—have ended. Once we get that confirmation, it will be time for traders to re-enter the market.
Discover more from tradingmarketcycles
Subscribe to get the latest posts sent to your email.