

Gold Market Analysis & Price Prediction: September 7 Weekly Cycle Update
Introduction
Welcome to this week’s Gold Market analysis for the week of September 7. Navigating the precious metals market requires a clear, systematic approach, and Hurst Cycle analysis provides the precise roadmap traders need.
Since my last gold update, there has been no fundamental shift in our long-term monthly cycle framework, leaving our primary projections completely intact. In this analysis, we will break down every active temporal wave—from the overarching 40-week cycle down to the actionable 20-day cycle—to determine key support levels, upside targets, and critical FLD intersections.
By evaluating cycle synchronicity and price translation, we can cut through daily market noise and establish high-probability trade setups. Whether you are holding long-term positions or looking for short-term tactical entries, this comprehensive weekly breakdown will guide you through the expected price action, upcoming cycle crests, and key inflection points heading into the autumn months.
The 40 week Cycle
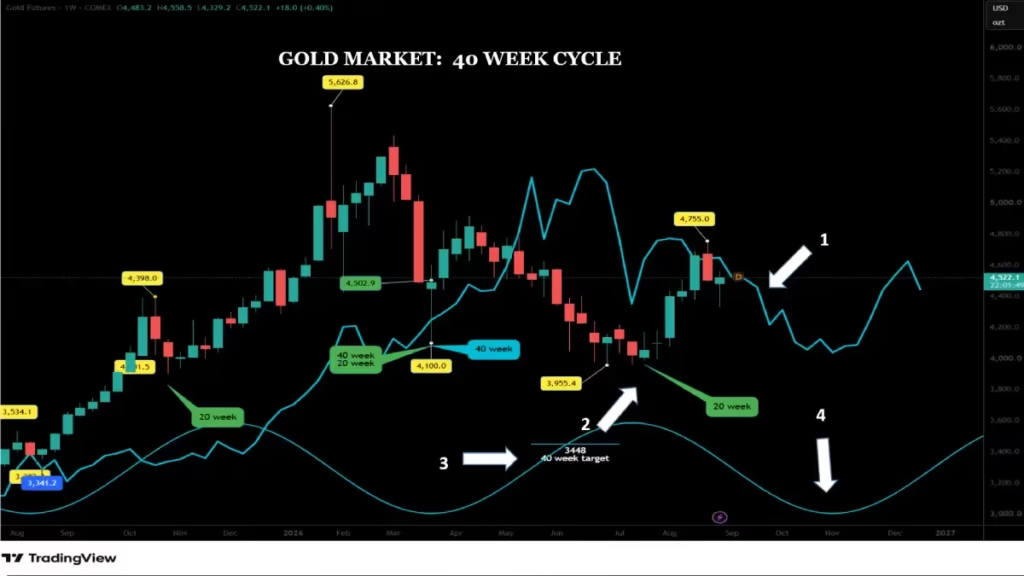
Since my last gold update, there has been no real change in the monthly cycle analysis. So, let’s start with the 40-week cycle. As mentioned in my last update, to initiate a new bull trend, the gold market needs to cross sharply and clearly above its FLD (arrow 1). Since the $3,955 low on the week of June 29 (arrow 2), the gold market has rebounded along its FLD, finding resistance without crossing above, which for now keeps the $3,448 downside target (arrow 3) valid.
This target will become invalid only if the gold market crosses sharply and clearly—such as with a large green candlestick—above its FLD. The low for this 40-week cycle is still scheduled for mid-November (arrow 4).
We must monitor any signs of the gold market changing direction very closely; however, until the gold market forms its next 40-week cycle bottom, I do not expect any crossing above its FLD. We will gain more details on how to trade the 40-week cycle by analyzing the 80-day cycle and building a roadmap with it.
The 20 week Cycle
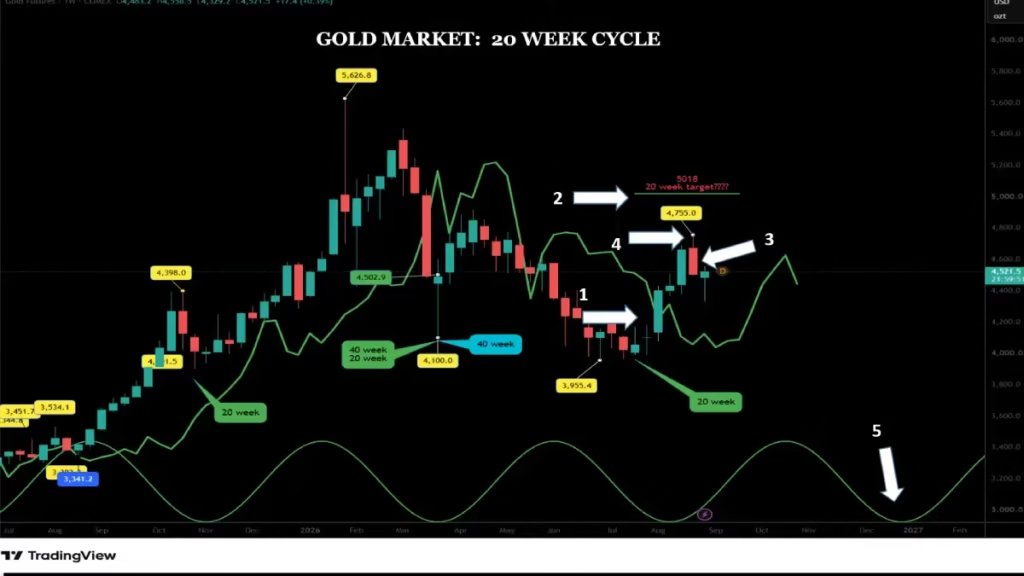
On the 20-week cycle, we have mixed information. Two weeks ago, the gold market crossed above its cycle line at $4,489 (arrow 1), providing a potential $5,018 upside target (arrow 2). However, the week following the cross produced a red candlestick (arrow 3), which is not a very encouraging signal. For this reason, we must take this trading signal with a grain of salt and wait until we analyze the shorter cycles before taking a position on the 20-week cycle. This crossing creates an interesting dilemma: what should a trader do in this scenario?
There are two possibilities. The first option is to validate the signal by waiting until the gold market makes a higher high than the previous week’s level at $4,755 (arrow 4), which would simultaneously push it above its 40-week cycle line or FLD. The second option is to move down to a lower timeframe—such as the 80-day or even the 40-day cycle—to determine if the gold market provides an actionable upside trading signal and whether the market has already reached this target.
For now, I will not take the 20-week cycle trading signal too seriously. Technically, during the formation of the upcoming 20-week cycle low, the gold market should cross below its cycle line. This low is expected to form around mid-November (arrow 5).
The 80 Day Cycle
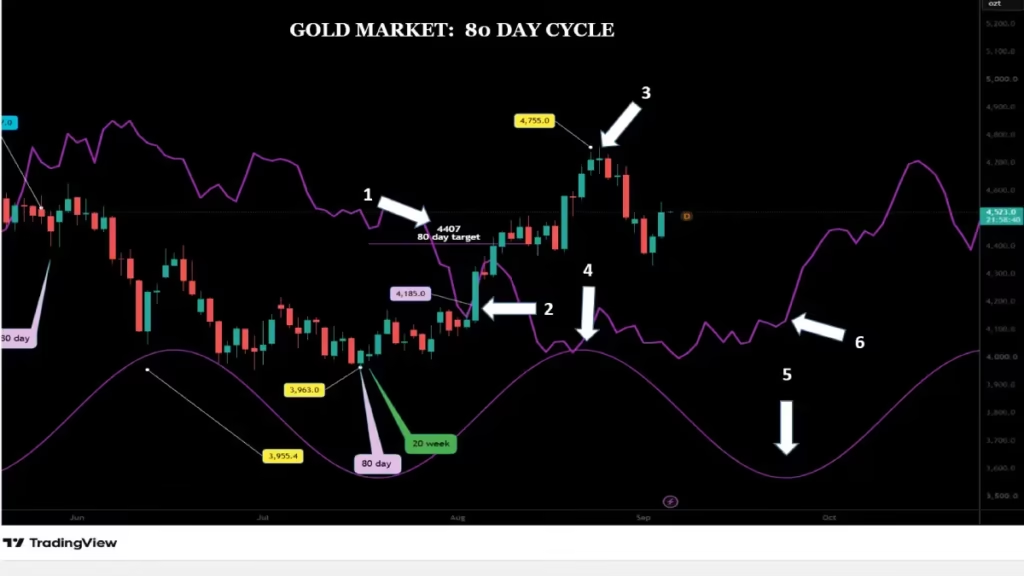
Moving on to the 80-Day Cycle: The $4,407 target (arrow 1) triggered by the August 5 crossing ( arrow 2) was met 2 days later, after which the gold market reached a high of $4,755 on August 25 (arrow 3). If the August 25 peak represents the 80-day peak, this peak occurred precisely at the crest of the cycle (arrow 4). This indicates a neutral stance and serves as the first sign that the gold market may be running out of steam.
The low for this 80-day cycle is still expected in September 22 (arrow 5) or early October. Technically, we can expect the next 80-day cycle low to form below its cycle line (arrow 6); by crossing below its FLD, it will provide a new potential downside target. If the next low forms above or directly on its FLD, it could indicate that some underlying bullishness is entering the gold market.
However, because we are in the first 80-day component of the final 20-week cycle before the market forms its broader 18-month cycle low, we should expect this 80-day cycle to remain neutral, while the following one should turn bearish.
The 40 Day Cycle
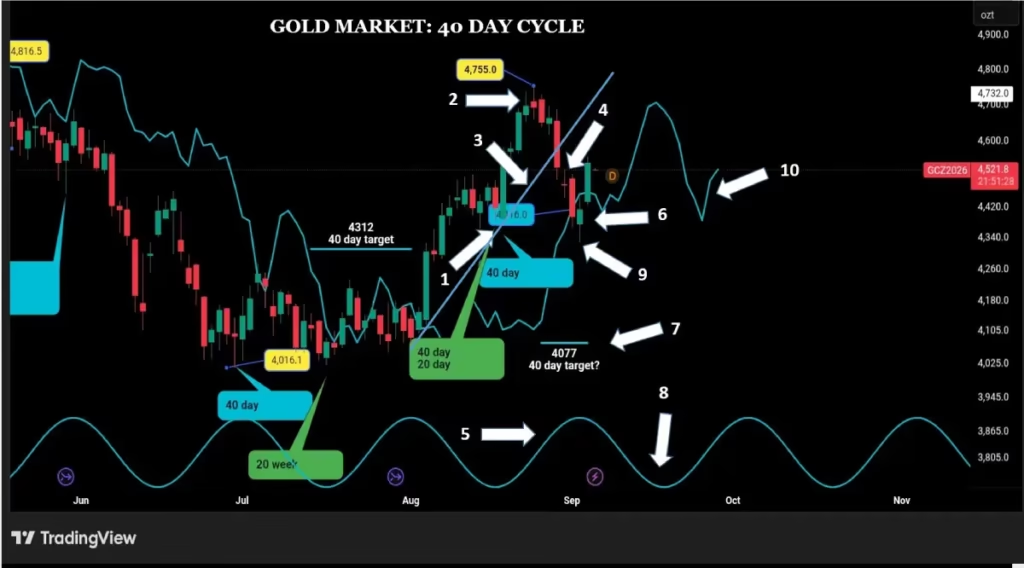
The 40-Day Cycle: With a $4,378 low printed on August 19 (arrow 1), the gold market established its last 40-day cycle low on that exact date. After forming this low, the market rallied to a high of $4,755 on August 25 (arrow 2). Once the last 40-day low was confirmed, I drew the 40-day Valid Trend Line (VTL) (arrow 3). By crossing below this VTL on August 31 (arrow 4), the gold market confirmed that the $4,755 high is indeed the 40-day cycle peak and, even more importantly, that the 80-day peak has formed or is currently forming.
Let’s analyze where this 40-day cycle peak formed relative to the rest of the cycle. The 40-day peak materialized just 4 days after its prior low. Technically, in a balanced market, the peak should form around September 11. By topping out early on August 25, the market provides critical information: this peak occurred on the left side of the cycle (left-translated) (arrow 5).
According to the Hurst Rule of Time Translation, left translation is a negative structural sign, meaning we can anticipate a relatively sharp correction. The gold market reconfirmed the August 25 high as the 40-day peak when it crossed slightly below its cycle line on September 2 at $4,416, (arrow 6) generating a $4,077 potential downside target (arrow 7).
The next 40-day low is projected for the third week of September (arrow 8), around September 22. We should observe an initial low around September 4 (it is possible that the September 2 low fulfilled this role) (arrow 9), followed by a temporary rebound toward its cycle line before resuming its decline into the third week of September.
After forming its next 40-day cycle low during that third week of September, the gold market should technically cross back above its cycle line or FLD (arrow 10), providing a very short-term upside target. Depending on how much bullish momentum remains, there is a high probability that the gold market will fail to reach this short-term upside target and will cross back below its cycle line, trading beneath its cycle line or FLD until the end of November.
The 20 Day Cycle
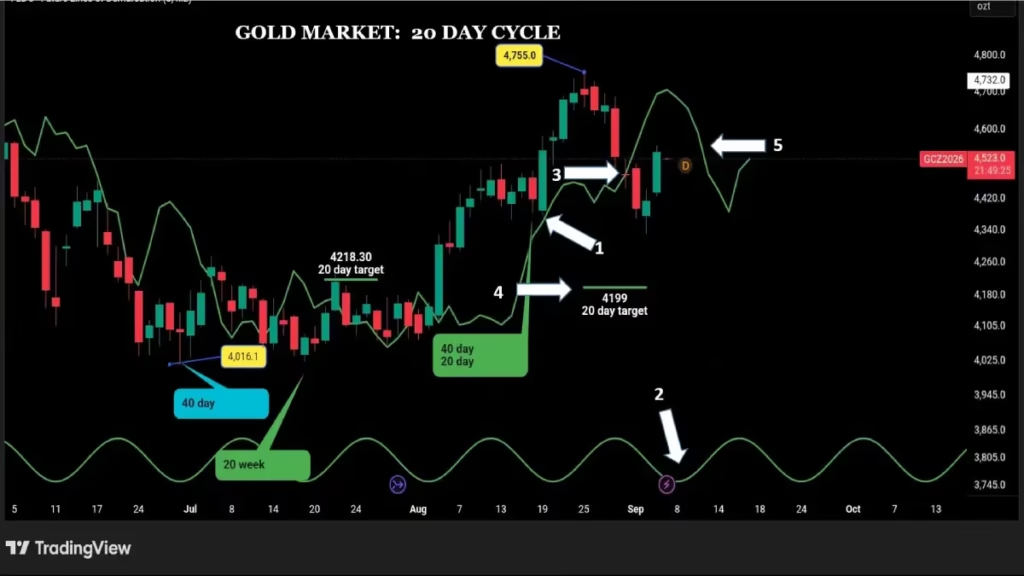
The 20-Day Cycle: According to the Hurst Rule of Synchronicity, the last 20-day cycle low occurred simultaneously with the 40-day cycle low on August 19 (arrow 1). The next low is expected on September 4 (arrow 2). In a balanced market, the gold market should form its next 20-day low below its FLD, yielding a brief downside target. As anticipated, on September 1, the gold market crossed below its cycle line at $4,477 (arrow 3), generating a $4,199 potential target (arrow 4).
There is a possibility that this 20-day cycle low was established on September 2 when gold printed a low of $4,414. If so, this active 20-day cycle length would measure 14 days, compared to the nominal Hurst model average of 17 days. Technically, after completing its 20-day cycle low, gold should rebound toward its cycle line (arrow 5) before resuming its decline toward the next 20-day cycle low expected around September 22.
After forming its low on September 22, we expect the market to cross back above its cycle line to start a new cycle. The 20-day cycle is extremely useful for 80-day cycle traders. Technically, the new cycle starting after September 22 will be the fourth and final 20-day cycle preceding the broader 18-month cycle low.
The Roadmap for the next 80 day cycle
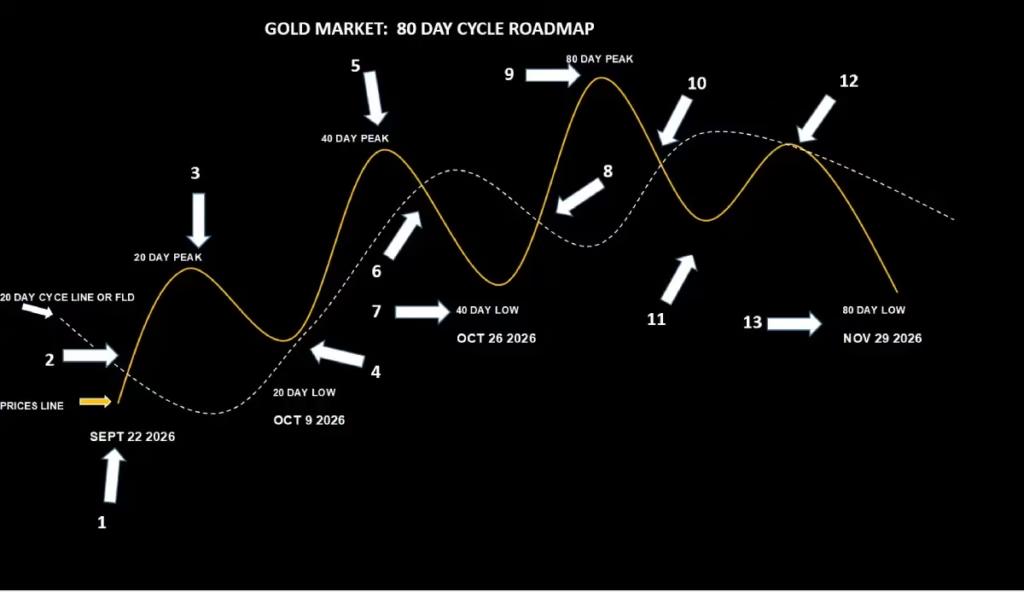
Now, let’s establish the scenario for the upcoming 80-day cycle using the 20-day FLD, assuming the current 80-day cycle forms its low on September 22. (If the low forms on a different date, we will adjust future projected dates accordingly using the Hurst nominal model.)
After forming its low on September 22 (arrow 1), the gold market will cross above its cycle line (arrow 2), providing a target for the 20-day cycle peak. Then, after forming the 20-day peak (arrow 3) estimated around September 30, the market will decline to form its first 20-day cycle low on October 9. This first 20-day low should form directly on its cycle line (arrow 4).
Next, the gold market will resume its uptrend as it works toward its 40-day peak (arrow 5). After forming this 40-day peak, gold should cross below its cycle line (arrow 6), providing a short downside target heading into the 40-day low expected on October 26 (arrow 7).
Following that, the gold market should cross back above its cycle line or FLD (arrow 8), providing an upside target on its way toward the 80-day cycle peak (arrow 9), After forming its 80-day peak the market should cross back below its cycle line (arrow 10), triggering a downside target for the next 80-day low scheduled for November 29.
However, prior to reaching that November 29 low, the gold market will form an initial low (arrow 11) before rebounding toward its FLD (arrow 12), using the line as resistance before driving downward toward the final November low (arrow 13).
Conclusion
In summary, the Gold Market continues to navigate a pivotal transitional phase within its broader Hurst Cycle structure. While shorter-term cycles offer temporary tactical rebounds, the overall path of least resistance remains anchored toward the anticipated multi-cycle lows scheduled for late autumn.
Monitoring how price interacts with the Future Line of Demarcation (FLD) across the 80-day and 20-day timeframes will be essential to validating each stage of our projected roadmap. Remember that failing to break cleanly above key resistance signals ongoing underlying weakness, keeping downside targets active. As we track the progression toward the final 18-month cycle bottom expected in mid-November, adaptability and risk management remain your best assets.
Be sure to bookmark this site, subscribe for weekly updates, and review our step-by-step roadmap diagrams to stay ahead of major market turns. Thank you for reading, and wish you a successful trading week ahead.
Please note that I will be taking a short break and heading on vacation for about a month.
There will be no weekly posts and video updates during September, but I will be back in October with fresh market updates and new cycle projections.
Thank you all for watching, stay disciplined with your trading strategies, and I look forward to seeing you all when I return in October!
Discover more from tradingmarketcycles
Subscribe to get the latest posts sent to your email.