

Gold Market Analysis: Identifying the 40-Week and 18-Month Cycle Lows
Introduction.
Welcome to this week Gold Market Analysis, this week’s technical analysis of the gold market for the week of November 2. Using J.M. Hurst Cycle Analysis, we examine the underlying rhythm of gold prices from multi-year macro trends down to short-term trading cycles.
Having reached critical downside targets, gold is now approaching significant cycle inflection points. In this article, we map out the 18-month, 40-week, 20-week, 80-day, 40-day, and 20-day cycles to provide a precise roadmap for the weeks ahead.
The Gold Market Analysis of 18 Month Cycle.
I wrote this article on Gold Market Analysis on Thursday October 29, this November 2 week analysis will be about gold.
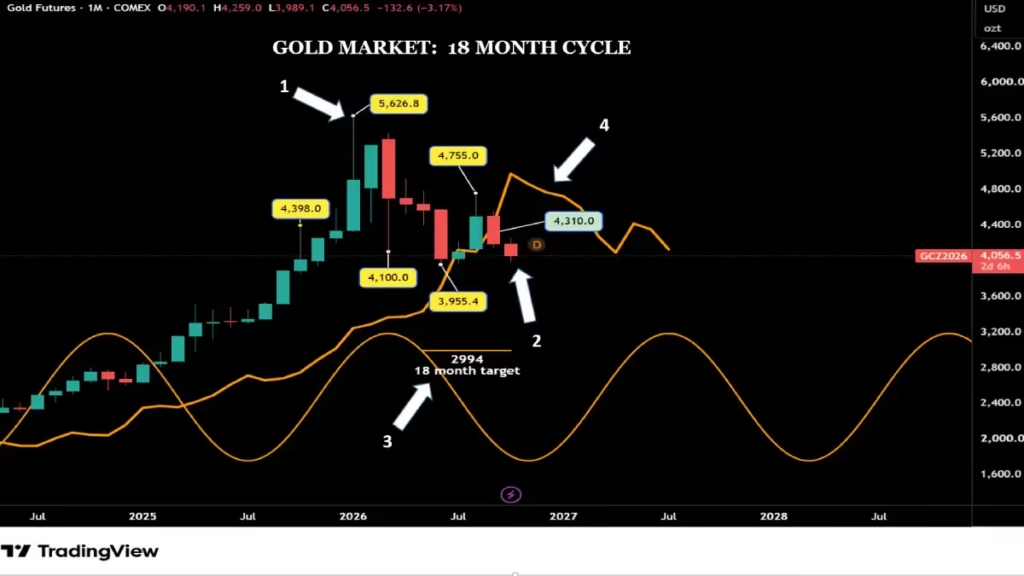
Since we are just at the beginning of a new month, let’s start with the 18-month cycle. The January $5,626.80 peak (arrow 1) was an 18-month cycle peak, and even the peak of a much longer cycle, like the 16-year cycle.
Last month, by crossing below its 18-month cycle FLD (Future Line of Demarcation), (arrow 2) the gold market confirmed January 2026 as at least an 18-month cycle peak. But this crossing gives us another important piece of information: a potential downside target.
The crossing occurred at $4,310, triggering a $2994 potential downside target (arrow 3). To get a valid signal, we need to wait for confirmation. During the next few months, the gold market has to keep trading below its 18-month FLD. (Arrow 4)
The 40 week Cycle
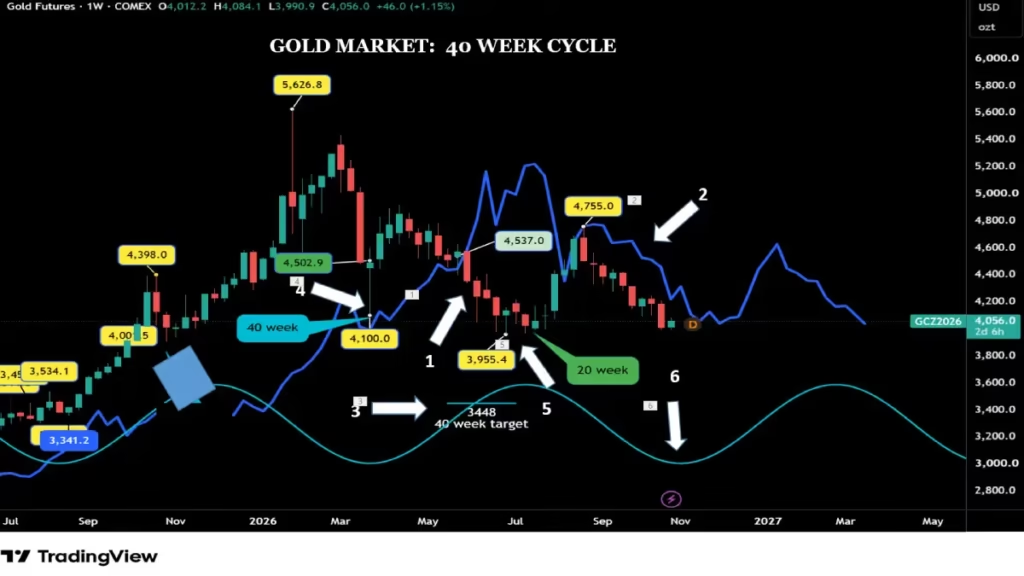
Since its last June crossing below its FLD,(arrow 1) the gold market is still trading below its 40-week FLD. (Arrow 2) During this crossing, the gold market provided a $3,448 potential downside target (arrow 3). This target remains valid until the gold market crosses above its FLD.
If the gold market crosses above its FLD without reaching its $3,448 target, not only will this crossing invalidate the downside target, but it will also give us another valuable information, there is some bullishness starting to come into the gold market.
During the last move up, the gold market was so bullish that it was very difficult to identify the last 18-month cycle. This happens very often when a market is very bullish, since the corrections are not very easy to identify. The first option for the 18 month cycle was in June 2025, and the second possibility was in October 2025.
What is the implication for the 40-week cycle? If we take the first option, the first 40-week cycle formed during the third week of March 2026.(arrow 4) Using the second option, the first 40-week cycle should be placed at the end of June 2026. (arrow 5)
For this week’s analysis, I will use the first option, with the 40-week cycle in March 2026; this option is the more suitable one. If we use this option, we can expect the gold market to form its next 40-week low this month (arrow 6). For the second option, the best probable date will be during the second week of February 2027.
How can we resolve this problem?
We will be able to solve this problem by analyzing the 80-day cycle. Remember, all cycles follow the same pattern. By building an 80-day roadmap and by following the gold market on this roadmap, we will be able to identify where we can place the 40-week cycle low. But as mentioned many times, for now, it is not very important for short-term traders to know with certainty where to place the previous 40-week cycle low.
The 20 week Cycle
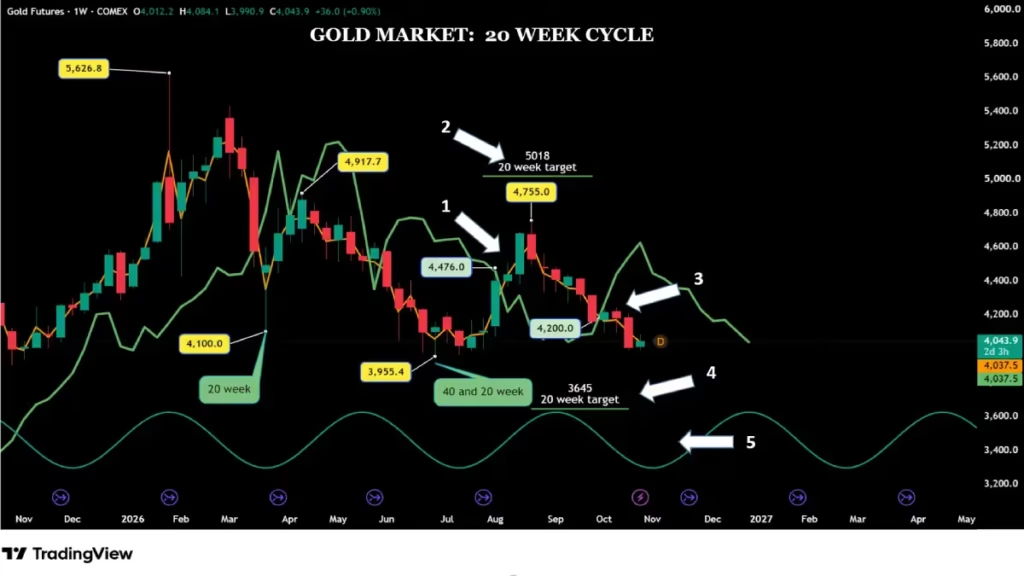
During the second week of August, (arrow 1) the gold market crossed above its FLD, providing a $5,018 potential upside target (arrow 2). The gold market not only missed its target, but crossed back below its FLD at $4,200 (arrow 3) during the second week of October, confirming that the bears in the gold market are in control.
This crossing provides a $3,645 (arrow 4) potential downside target. The next 20-week cycle low is expected to form during the second week of November (arrow 5).
The 80 Day Cycle
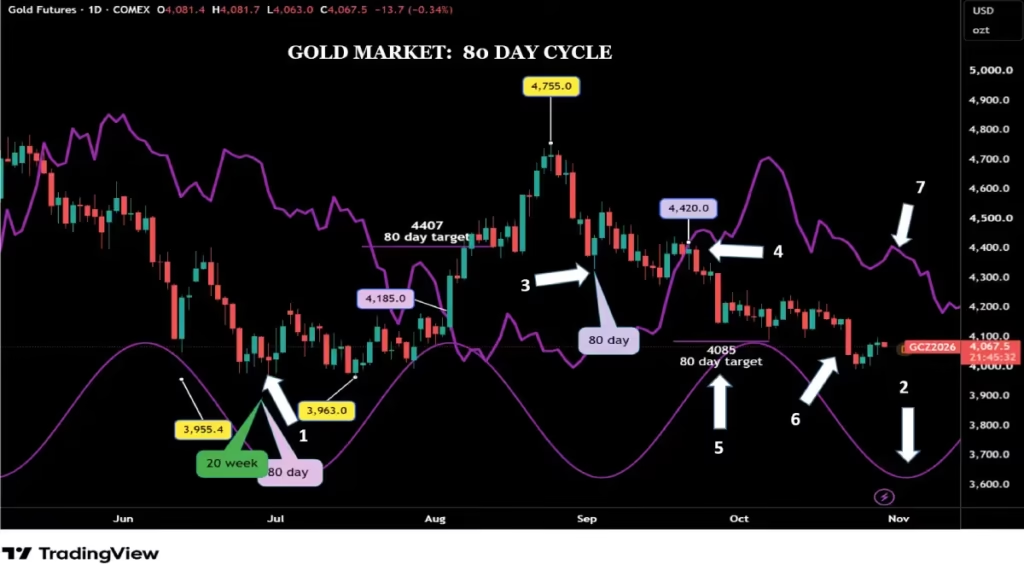
The first 80-day cycle formed its low just in July (arrow 1). The new one is expected to form about now on November 9 (arrow 2). According to the Hurst Rule of Synchronicity, at the time of the next 80-day low formation, the 20-week low will also form.
The previous 80-day cycle formed on September 16 (arrow 3). This 80-day cycle was 63 days long, only 5 days shorter than the 68-day average length on the Hurst Nominal Model. If the gold market keeps following this nominal model, we can expect the next 80-day cycle to form on November 23. After forming his September 80 day low, the gold market crossed below his FLD at $4,420 (arrow 4) for a$4,085 downside target (arrow 5), this target has been met on October 22 (arrow 6).
What can we expect after the next 80-day formation?
After the 80 day low formation, the gold market should rebound and cross above its FLD (arrow 7), providing a new trading signal and a potential upside target.
Approximately 68 days later, around January 30, 2027, the gold market should print another 80-day cycle low. During this low formation, it will be very helpful to see where the gold market will form comparatively to its FLD,
Indeed, if the gold market forms it’s low on its FLD and rebounds sharply, this will be very valuable information. In fact, this will confirm the previous 40-week cycle formation in November 2026.
Otherwise, June 2026 will be the best candidate to label the 40-week cycle.
But like I mentioned above, for short-term trading, knowing with exactitude where the 40-week cycle formed is not very important. We know with certainty for the traders who trade the 80-day cycle that the gold market after the November low formation should cross above its FLD and trigger a potential upside target.
The 40 Day Cycle
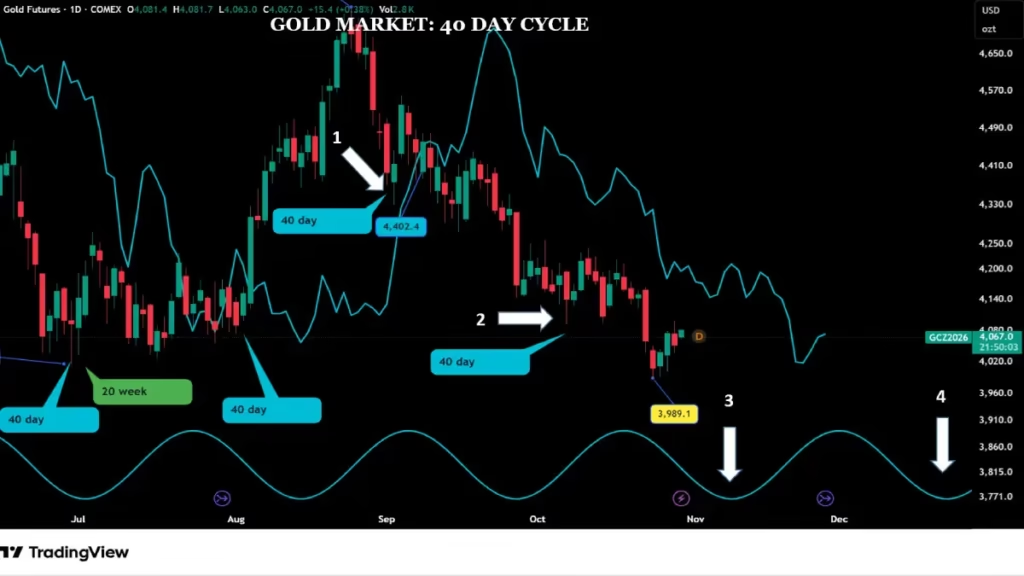
The last 40-day cycle formed on Sept 16 (arrow 1), which was also the last 80 day cycle, since this date we have completed one 40-day cycle, which formed on October 7 (arrow 2), this cycle was 35 days long. The 40-day cycle of the original Hurst Model was 34 days. It is amazing to see the precision of the Hurst Nominal Model. I just remind you that Hurst discovered the nominal model more than 50 years ago.
What’s Next?
After the formation of the next 40 day low, we can expect the gold market to cross above its cycle line, or FLD, providing a potential upside target. The next 40-day cycle low is expected to print on November 10 (arrow 3)
After the crossing, we can expect the gold market to print its low on its FLD around the December 14 (Arrow 4).
The 20 Day Cycle
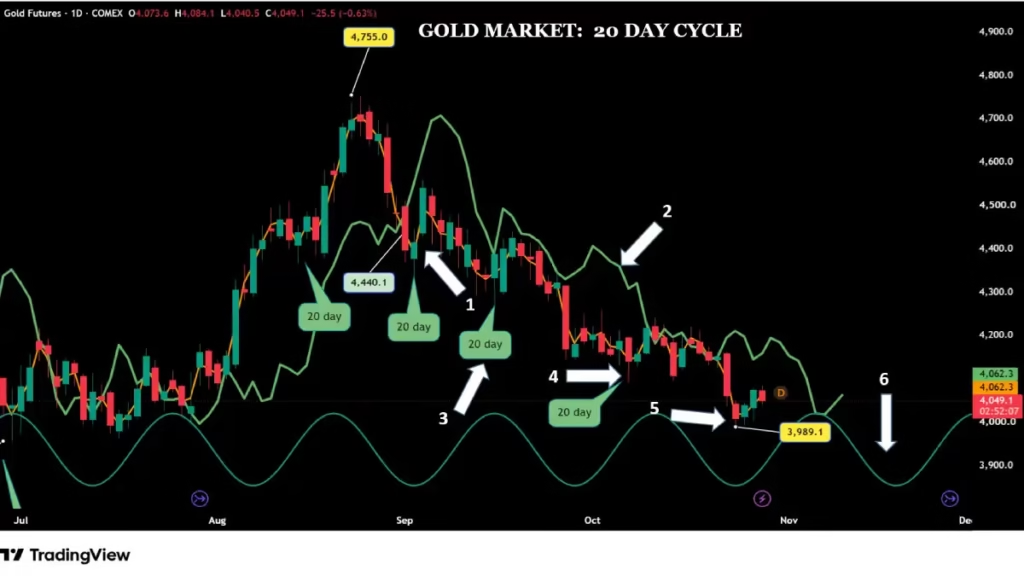
Since the gold market crossed below its FLD during the September first trading day (arrow 1), the gold market has been trading below its FLD (arrow 2).
Since the last 80 day cycle low on September 2 we have completed three 20-day cycles.
The first one was on September 16( arrow 3) (this was 14 days long), the second on October 7 (21 days) (arrow 4), and the third one is on October 23, (16 days) (arrow 5)making an average of 17 days, matching exactly the Hurst nominal model discovered 50 years ago, we still need one more 20 day cycle, this last 20 day is expected around November 9, (arrow 6) to complete this 80-day cycle—and accordingly to the Hurst Rule of Synchronicity, also at least the 20-week cycle.
We will get confirmation of the 20 week cycle having formed its low when the gold market crosses above its 20 day cycle line. So what can we expect for the next 2 months? Let’s go through the roadmap to see how we can trade the next move.
Let see the Roadmap & Next Steps for the 20-Day & 80-Day Cycles
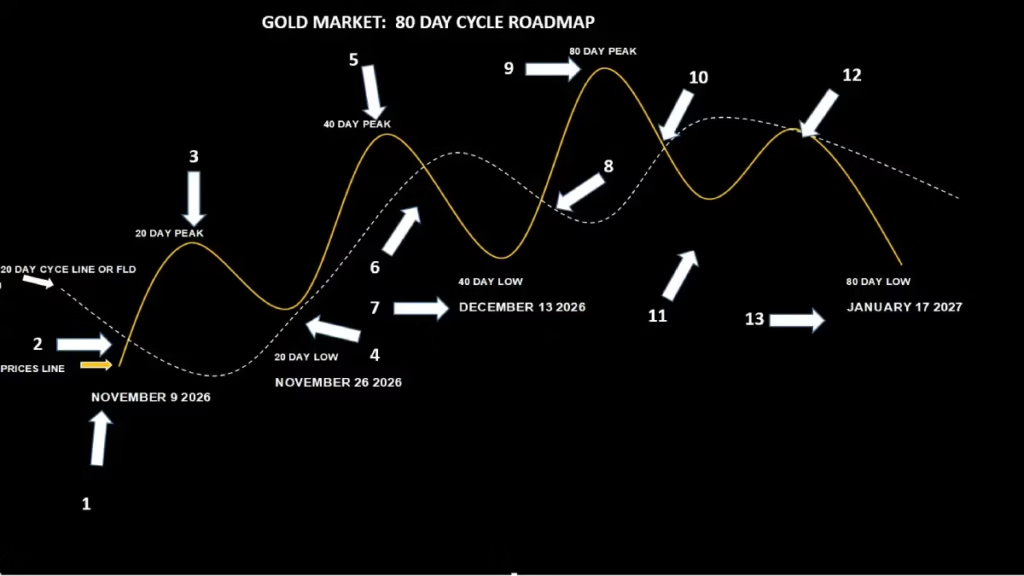
Following the formation of an 80-day cycle low, the market sequence is expected to unfold as follows:
assuming the last 20 day form on November 9, The first 20-Day Cycle Low: The index formed its first 20-day cycle low along its cycle line around the November 26 (arrow 4) and then rebound as it moves toward the 40-day cycle peak (arrow 5).
40-Day Cycle Decline: After peaking, the Dow Jones should cross back below its FLD (arrow 6) to establish its 40-day cycle low around December 13 (Arrow 7). This downward crossover will generate a new short-term downside target.
Then will rebound to 80-Day Peak: The market will then cross back above its FLD (arrow 8), projecting a short-term upside target for the 80-day cycle peak (arrow 9)
Final Decline into January 17 2027 Low: After reaching the 80-day peak, price will cross below its FLD (arrow 10) on its way to the next 80-day cycle low. Prior to reaching the final bottom, price will form a preliminary low (arrow 11), rally back toward the FLD (arrow 12) (using it as resistance), and resume its decline to form the full 80-day cycle low around the second week of January 2027 (arrow 13).
Conclusion
In summary, gold is moving through a cluster of key cycle lows throughout November. As the shorter 20-day and 40-day cycles complete their troughs, watch closely for Future Line of Demarcation (FLD) upside crossovers to confirm the next major swing setup.
Discover more from tradingmarketcycles
Subscribe to get the latest posts sent to your email.