
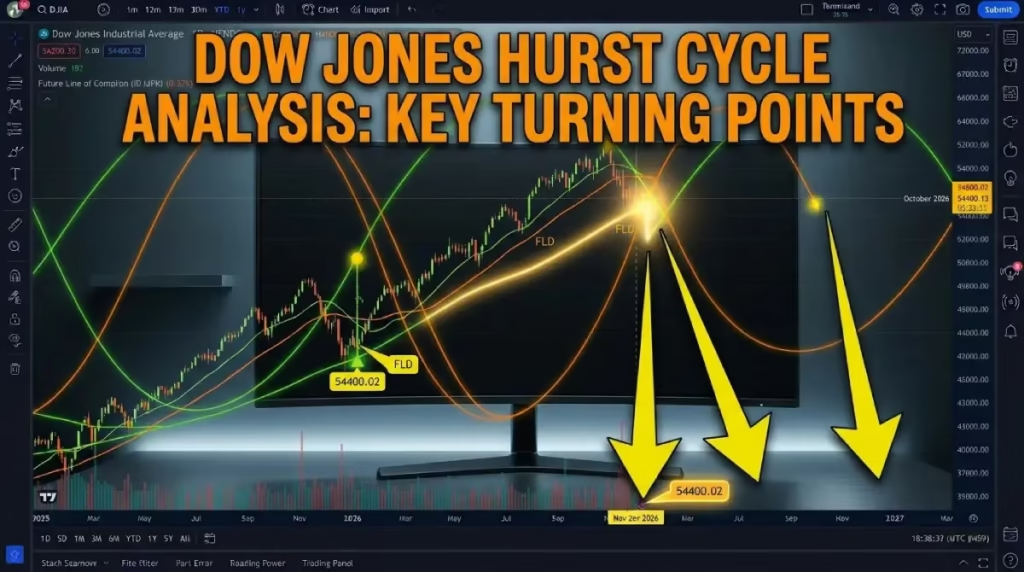
Dow Jones Hurst Cycle Analysis: October 2026 Market Outlook & Projections
Introduction:
Welcome to this week’s comprehensive market update for October 26, 2026! Today, we take an in-depth look at the Dow Jones Industrial Average from a long-term cyclical perspective using J.M. Hurst’s cycle principles.
Following the recent 4,197-point correction from the August all-time high, traders are asking whether the overall bullish structure remains intact or if a deeper cyclical low lies ahead.
In this analysis, we break down the updated nominal models—from the macro 18-month and 40-week cycles down to the short-term 20-day price action—evaluating key Future Line of Demarcation (FLD) levels, Valid Trend Lines (VTLs), and downside targets heading into November.
Dow Jones Hurst Cycle Analysis: The 18 Month Cycle
It has been a while since we analyzed the Dow Jones Industrial Average from a long-term perspective, so let’s start by looking at the 18-month cycle.
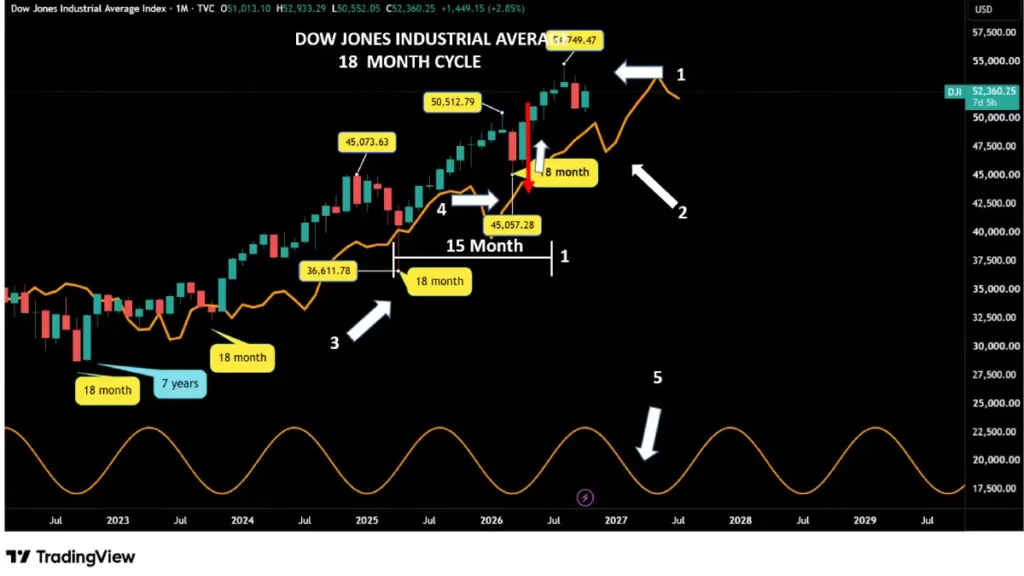
Despite the 4,197-point (or 7.66%) (The red arrow) decline from its August 2026 all-time high (arrow 1), the Dow Jones Industrial Average remains in a bullish trend because it is still trading above its Future Line of Demarcation (FLD), or cycle line (arrow 2).
The Dow Jones Industrial Average seems to be running on a shorter cycle length than the original Hurst model. Under the original Hurst nominal model, the Dow Jones Industrial Average has an average cycle length of 17.93 months.
However, lately it appears that the Dow Jones is following a shorter average cycle length of 15 months. If this observation is correct, we now need to explore the implications of this change.
The previous 18-month cycle low occurred in April 2025 (arrow 3). Adding 15 months to that low projects a potential 18-month cycle low in July 2026 (line 1). However, July was actually one month prior to the all-time high of 54,749. In this scenario, the most logical place to pin the 18-month cycle low is in March 2026 (arrow 4).
Placing the 18-month cycle low in March makes this specific cycle 11 months long—4 months shorter than the new 15-month average. While that is somewhat short, it is certainly not impossible, especially given that the Dow Jones Industrial Average is still in a strong bullish trend. If this analysis holds true, we can expect the next 18-month cycle low to form around June 2027 (arrow 5).
What about the original Hurst nominal model?
We must keep in mind the possibility that the 18-month cycle low is still ahead of us. Following the 17.93-month nominal average length, the next 18-month cycle low was scheduled for November 2026.
Therefore, we will know very soon which of these two scenarios is the correct one.
For the rest of this week’s analysis, I will use the shorter cycle model, assuming an average 18-month cycle length of 15 months, as this appears to be the most probable case for now.
However, we must keep in mind the possibility that the 18-month cycle low will form in November. We will get our first major clue if the Dow Jones Industrial Average experiences a sharp decline over the next few weeks leading into the third week of November.
If a sharp drop occurs, it will confirm that the 18-month cycle low is forming in November. Otherwise, I will continue analyzing the market using the new, shorter cycle model.
The 40 week Cycle:
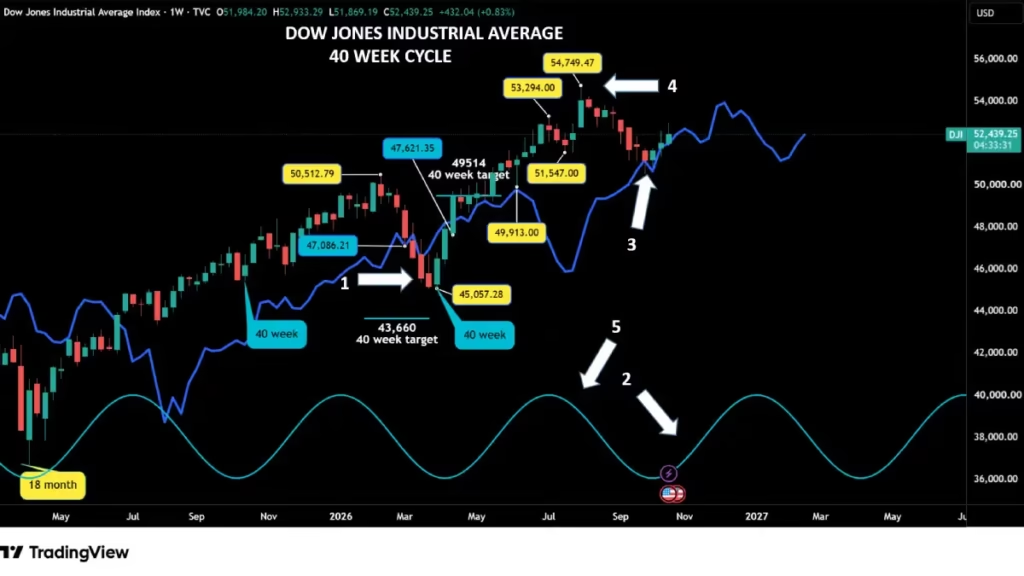
According to the Hurst Rule of Synchronicity, if the March 2026 (arrow 1) low was the last 18-month cycle low, it was also the low for the 40-week, 20-week, 80-day, 40-day, 20-day, and 10-day cycles.
In the new nominal model, the 40-week cycle is 32 weeks long. Adding 32 weeks to the March 2026 low gives us the week of November 9th (arrow 2)as a potential date for the actual 40-week cycle low.
During the last week of September (arrow 3), the Dow Jones Industrial Average formed a low right on its Future Line of Demarcation (FLD) at 50,552.05. Measuring from the March low, this was only 26 weeks into the cycle. Since that low, the Dow Jones Industrial Average has been trading along its cycle line, the FLD.
Once the 40-week cycle low is confirmed, I will draw the 40-week cycle Valid Trend Line (VTL). This line will provide crucial information when the Dow Jones Industrial Average crosses below it: a cross below the VTL will confirm that the peak of the next 18-month cycle has either formed or is currently forming.
The all-time high of 54,749(arrow 4) set during the first week of August was the 40-week cycle peak. This peak formed on the right side of the cycle (right translation) (arrow 5), which according to Hurst principles is a bullish signal. In this case, we can expect a moderate correction.
If the next 40-week cycle low (or the 18-month low under the second scenario) forms right on its cycle line, it will confirm that the Dow Jones Industrial Average still retains a significant amount of bullish momentum.
The 20 week Cycle:
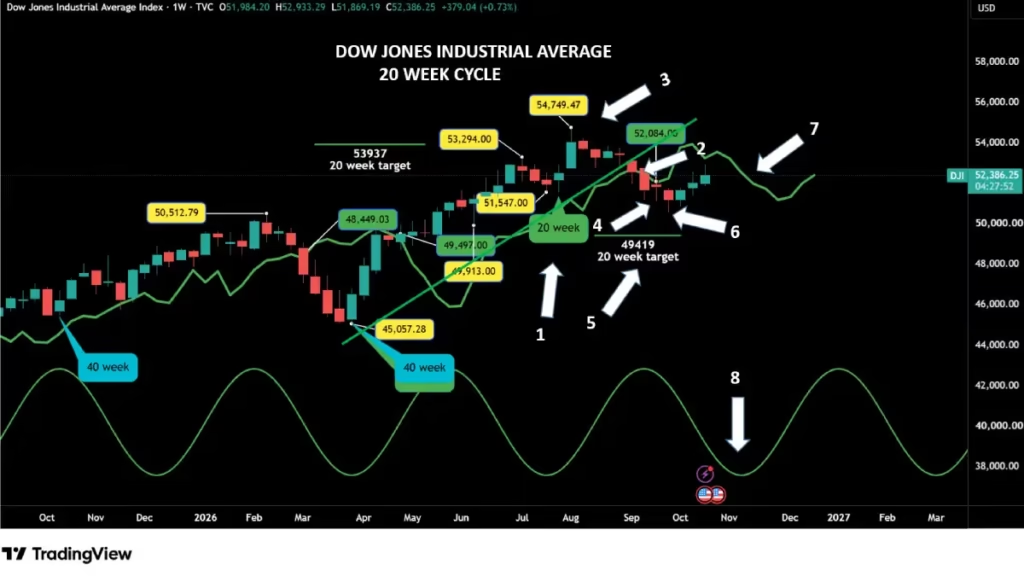
The best place to position the 20-week cycle low is during the third week of July (arrow 1). This makes the 20-week cycle exactly 16 weeks long, which matches perfectly the new 20-week cycle length under the updated nominal model.
After confirming the first 20-week cycle low following the March 2026 major low, I drew the 20-week cycle VTL (the green trend line). During the last week of August (arrow 2), the Dow Jones Industrial Average closed below this VTL, confirming that the August high (arrow 3) was a 20-week cycle peak as well as the 40-week cycle peak.
We received additional confirmation of the 20-week cycle peak when the Dow Jones Industrial Average closed below its FLD (arrow 4) during the third week of September at 52,084. This breakdown projected a short-term downside target at 49,419(arrow 5).
The October 1st low (arrow 6) of 50,552 sat 1,133 points (or 2.29%) above this downside target. This target remains valid until the Dow Jones Industrial Average crosses back above its FLD (arrow 7). If the market continues to follow the new nominal model, the next 20-week cycle low is expected to form during the first two weeks of November (arrow 8).
Outlook & Upside Targets
After forming its next 20-week cycle low, the Dow Jones Industrial Average should rebound and cross back above its FLD, which will generate a new upside target.
If the market forms its low well above the 49,419 target and crosses back above its FLD without hitting that downside target, it will be a very bullish sign. In that scenario, there is a very high probability that the Dow Jones Industrial Average will exceed its next upside target.
The 80 Day Cycle:
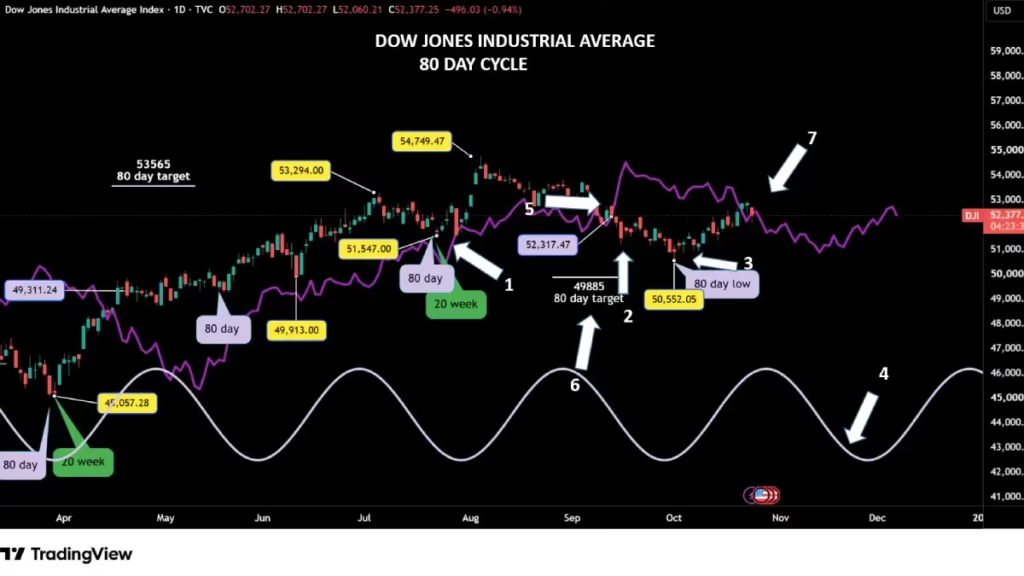
The new 80-day cycle length under the updated nominal model is 56.98 days.
The previous 80-day cycle low formed at 51,547 during the July 23 (arrow 1) trading session. Adding 57 days to that July low projected September 18(arrow 2) as a potential date for the next 80-day cycle low.
On October 1st (arrow 3), the Dow Jones Industrial Average established a low at 50,552, making this low the best candidate for the 80-day cycle low. The subsequent 80-day low is expected to form during the last week of November (arrow 4).
During the development of the previous 80-day cycle, the Dow Jones crossed below its Future Line of Demarcation (FLD) on September 15 (arrow 5) at 52,317, establishing a potential downside target of 49,885 (arrow 6).
What’s next for the 80-day cycle?
The Dow Jones should use its FLD (arrow 7) as a resistance level before resuming its decline into the third week of November. In accordance with Hurst’s Rule of Synchronicity, this low should form at the exact same time as the 40-week cycle low.
The 40 Day Cycle:
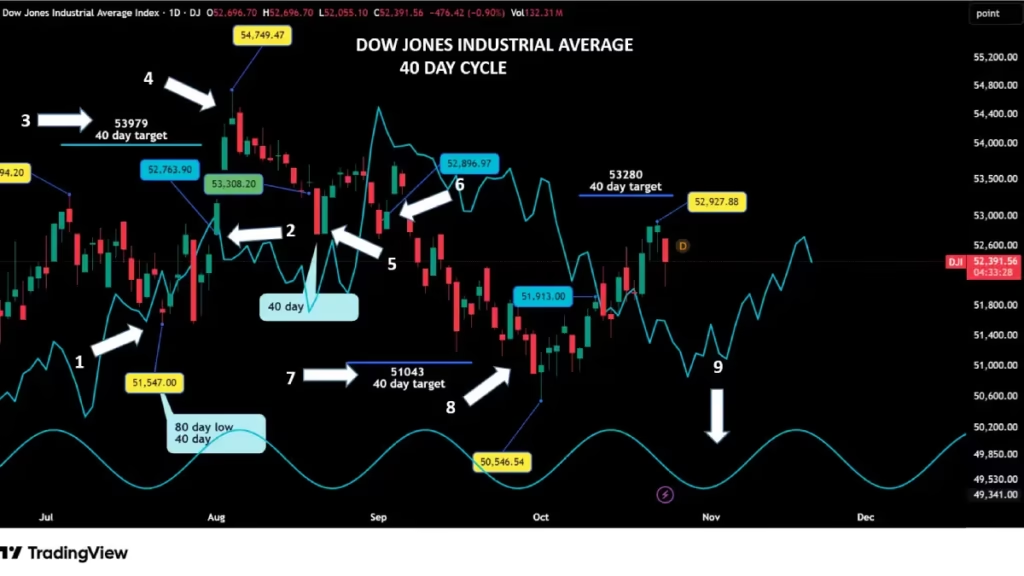
After forming the 40-day cycle low at 51,547, (arrow 1)the Dow Jones Industrial Average crossed above its FLD at 52,763 on August 3(arrow 2), 2026, projecting a potential upside target of 53,979 (arrow 3). Just two days later, on August 5, the Dow established a new all-time high at 54,749(arrow 4).
On September 1 (arrow 5) the market formed its next 40-day cycle low. The following day, price crossed below its cycle line at 52,896 (arrow 6) projecting a potential downside target of 51,043(arrow 7).
This target was achieved on September 29 (arrow 8) two days before the next 40-day cycle low was established at 50,546.
The next 40-day cycle low is projected to form around November 3. (Arrow 9)Technically, two more 40-day cycle lows must form before the market undergoes a broader rebound.
The 20 Day Cycle:
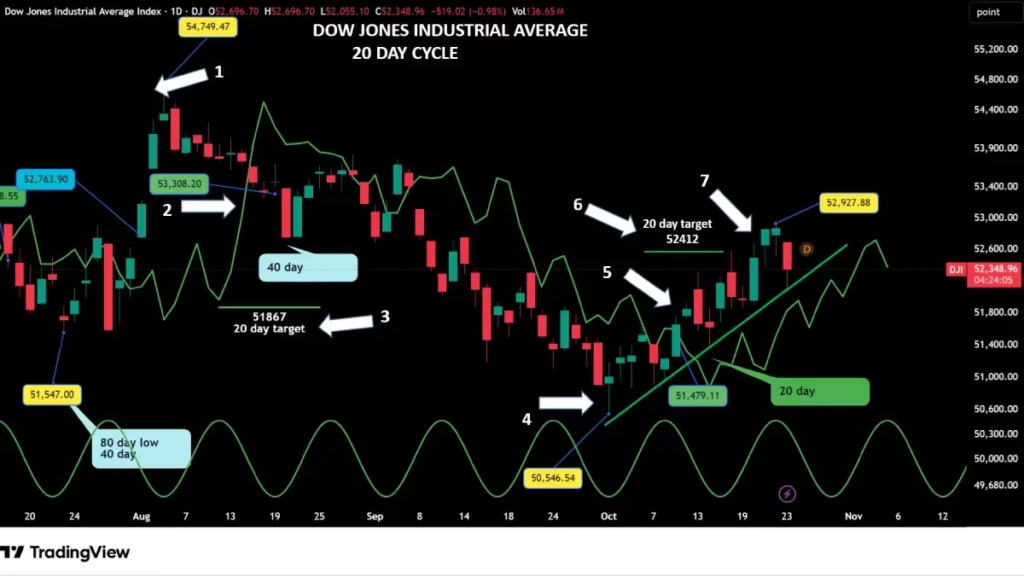
After reaching its new all-time high of 54,749 (arrow 1) the Dow Jones initiated a correction. During this decline, the Dow Jones Industrial Average crossed below its FLD at 53,308 (arrow 2) establishing a potential downside target of 51,867(arrow 3)—a target that was met on September 16.
After setting its last 80-day cycle low on October 1st at 50,546 (arrow 4) the market crossed back above its cycle line at 51,479(arrow 5). This crossover provided two key pieces of information:
The October low represents at least a 20-day cycle low. Furthermore, because it marks the fourth 20-day cycle since the July low, it confirms the completion of an 80-day cycle and the start of a new one.
Crossing back above the FLD projected a short-term upside target of 52,412(arrow 6). On October 16(arrow 7), the Dow Jones Industrial Average reached a high of 52,663, successfully fulfilling this target.
Let see the Roadmap & Next Steps for the 20-Day & 80-Day Cycles
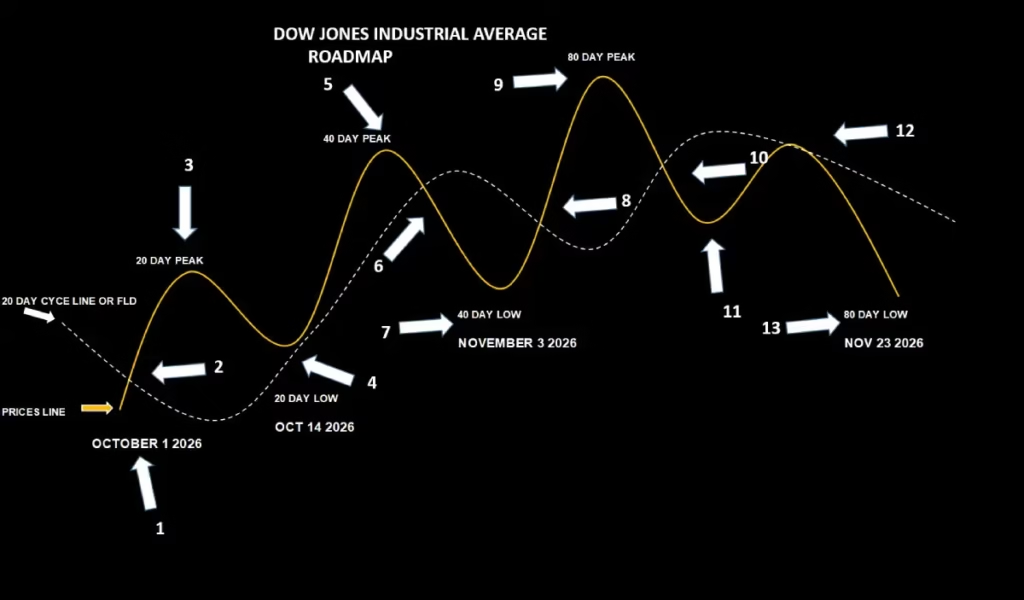
Following the formation of an 80-day cycle low, the market sequence is expected to unfold as follows:
First 20-Day Cycle Low: The index formed its first 20-day cycle low along its cycle line around the October 14 (arrow 4) and then rebound as it moves toward the 40-day cycle peak which can be expected between last week and this week (arrow 5).
40-Day Cycle Decline: After peaking, the Dow Jones should cross back below its FLD (arrow 6) to establish its 40-day cycle low around November 3. (Arrow 7). This downward crossover will generate a new short-term downside target.
Then will rebound to 80-Day Peak: The market will then cross back above its FLD (arrow 8), projecting a short-term upside target for the 80-day cycle peak (arrow 9)
Final Decline into November Low: After reaching the 80-day peak, price will cross below its FLD (arrow 10) on its way to the next 80-day cycle low. Prior to reaching the final bottom, price will form a preliminary low (arrow 11), rally back toward the FLD (arrow 12) (using it as resistance), and resume its decline to form the full 80-day cycle low around the third week of November (arrow 13).
Conclusion:
In summary, while the Dow Jones Industrial Average has experienced a sharp pullback from its August peak, the broader market structure remains technically bullish as long as price holds above critical macro cycle lines.
The upcoming weeks leading into mid-to-late November will be crucial.
Whether the market confirms our updated shorter 15-month nominal cycle model or pushes toward a major 18-month cycle trough in November, following the sequence of 20-day and 40-day FLD crossovers will give us clear advance clues.
Keep a close eye on the downside targets and FLD resistance levels outlined above, and stay tuned for next week’s update as these key cycle turns unfold.
Discover more from tradingmarketcycles
Subscribe to get the latest posts sent to your email.