

The Dow Jones (August 3, 2026): Is the 18-Month Cycle Trough Approaching?
Introduction
Welcome back to our weekly market breakdown for August 3, 2026. Today, we turn our attention back to the Dow Jones following our last detailed review in June. A critical question currently facing market participants is whether the overarching 18-month cycle peak has already materialized. By systematically analyzing the shorter, underlying sub-cycles, we can gather essential clues to answer this question accurately.
However, before dissecting the fine details of the short-term swings, it is vital to establish a solid foundation by examining the longer-term perspective. We will start by reviewing the 18-month cycle structure to map out the big picture. Hurst cycle theory provides a clear framework to cut through short-term market noise, helping average traders navigate incoming volatility. Let’s dive straight into the numbers, evaluate key price targets, and project where the market is headed next
The 18 Month Cycle
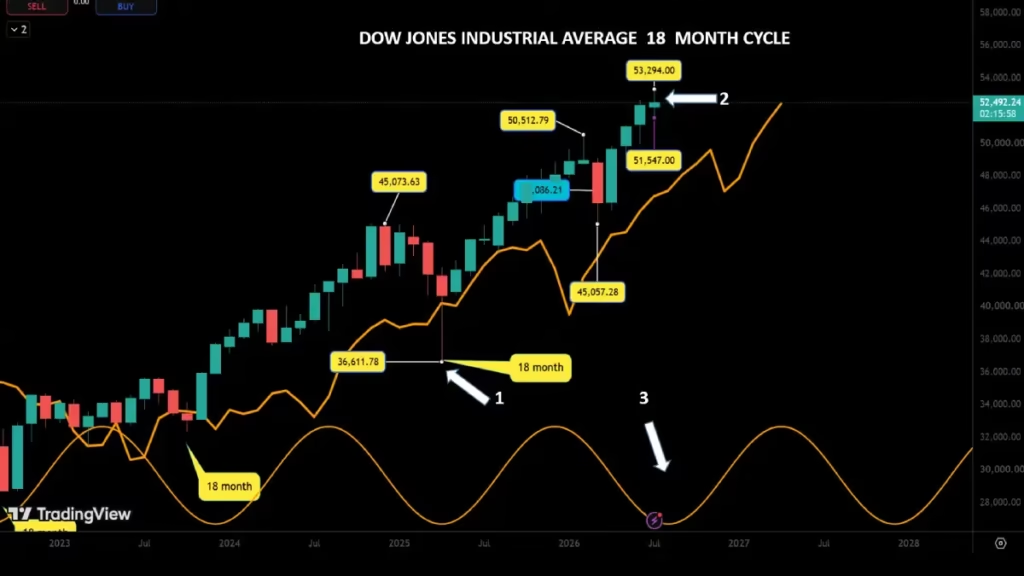
From the previous April 2025 18-month cycle low (arrow 1) to the July 7 new all-time high (arrow 2), 15 months have elapsed. Since the Hurst nominal model assigns the 18-month cycle an average duration of 17.93 months, it remains reasonable to project the next 18-month cycle trough forming between September and October (arrow 3). For detailed alternative scenarios, I recommend referencing our June analysis.
Because this timeline is an estimation—and because sound trading relies on precise information provided by cycle analysis rather than guesswork—the 18-month cycle itself is not ideal for executing direct trades. Relying on monthly cycles offers structural long-term perspective. As of right now, the 18-month cycle for the Dow Jones Industrial Average remains in a fundamentally bullish posture.
Now, let us inspect the next shorter wave—the 40-week cycle—to gather clearer insights into what lies ahead in the near term.
The 40 week Cycle
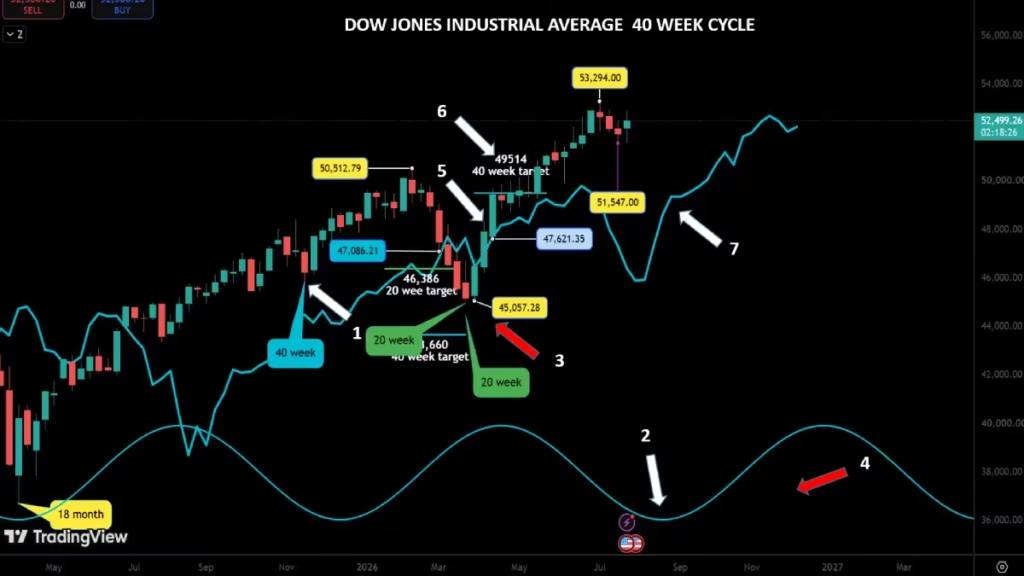
The 45,728 low (arrow1) from November 2025 remains, for now, the last recognized 40-week cycle trough.
Applying the Hurst nominal model’s average length for a 40-week cycle—which is 38.97 weeks or 272.80 days—we can reasonable expect the next 40-week cycle low to form during mid-August (arrow 2). By the Hurst rule of synchronicity, this feature should also align with the upcoming 18-month cycle trough.
Why is there such a discrepancy between the monthly and weekly analysis? First, the monthly average incorporates data from the last four 18-month cycles. It takes considerable time for recent price action to shift the monthly historical average. When this lag occurs, it is always best practice to weigh the shorter cycles more heavily, as they adjust to price developments much faster.
Second, there is a distinct possibility that the last 40-week low was misplaced. If so, the next best placement for that 40-week low is March (red arrow 3), which would stretch that specific cycle to 50 weeks long. Remember, the nominal average length for the 40-week cycle is 38.97 weeks, making 50 weeks exceptionally long and projecting the last week of November (red arrow 4) as the probable target for the next 18-month cycle low. If the Dow Jones forms its low at the end of November—and since cycles in bear trends tend to run longer than standard nominal averages—this would signal clear bearishness.
During the last rally, the Dow Jones triggered a valid buying signal by crossing above its cycle line at 47,621 (arrow 5), setting a upside target of 49,514 (arrow 6). That price target was reached very quickly and even exceeded. For now, there are no major signs of fundamental weakness, and the market trades comfortably far above its FLD (arrow 7).
The 20 week Cycle
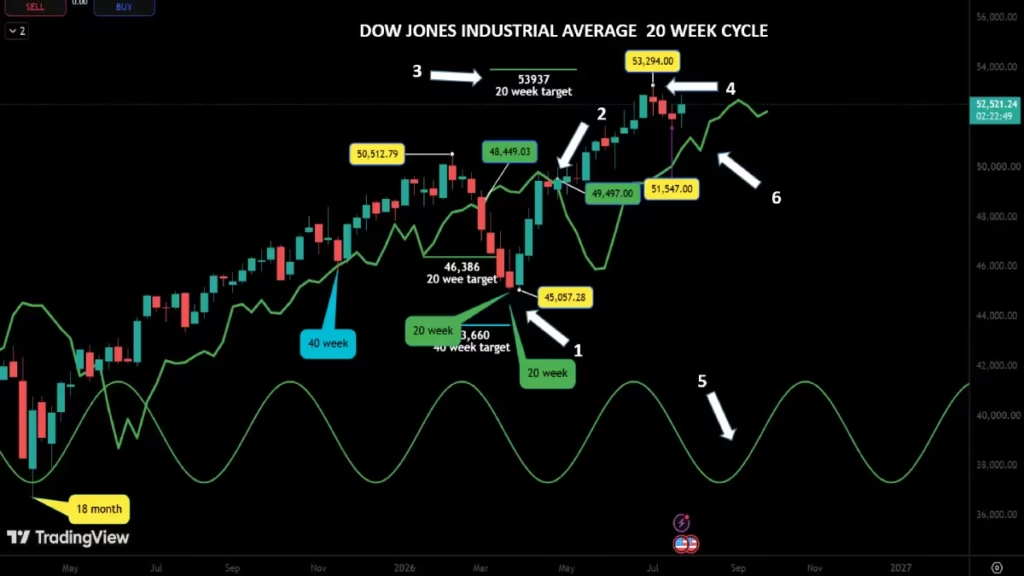
Even if the 40-week cycle low position remains open to debate, the 20-week cycle brings clarity to the overall setup. Whether we place the 40-week low in November 2025 or March 2026, the rule of synchronicity designates the March 2026 low (arrow 1) as a confirmed 20-week cycle low.
As mentioned earlier, even if we anchor the 40-week low in March—making it 50 weeks long—dividing 50 weeks by the 19.48-week nominal average yields roughly 2.56 cycles (nearly 3 full cycles). Therefore, we can label the March 2026 trough as a 20-week low with a very high degree of confidence.
For 20-week cycle traders, this offers highly valuable actionable data. This setup was confirmed when the market crossed above its cycle line at 49,497 (arrow 2), projecting a potential upside target of 53,937 (arrow 3)—a 4,440-point move. By printing a new all-time high of 53,294 on July 7 (arrow 4), the Dow Jones missed its projected target by just 643 points (or 1.19%). This upside projection remains technically valid until price crosses back below its cycle line.
What can we expect next for the 20-week cycle?
Only 18 weeks have elapsed since the March low. As highlighted in my previous update, the next 20-week cycle trough is still anticipated around the second week of August (arrow 5). However, with a low forming at exactly 17 weeks, there is a chance the actual 20-week low already occurred during the third week of July. We will need confirmation from shorter cycles to verify this.
Technically, at this stage of the cycle, the Dow Jones should cross below its cycle line (arrow 6) during the next correction to provide a downside target. However, if the market remains strictly above its FLD during the next 20-week low formation, it will confirm an extraordinary amount of underlying bullish strength in the American stock market.
The 80 Day Cycle
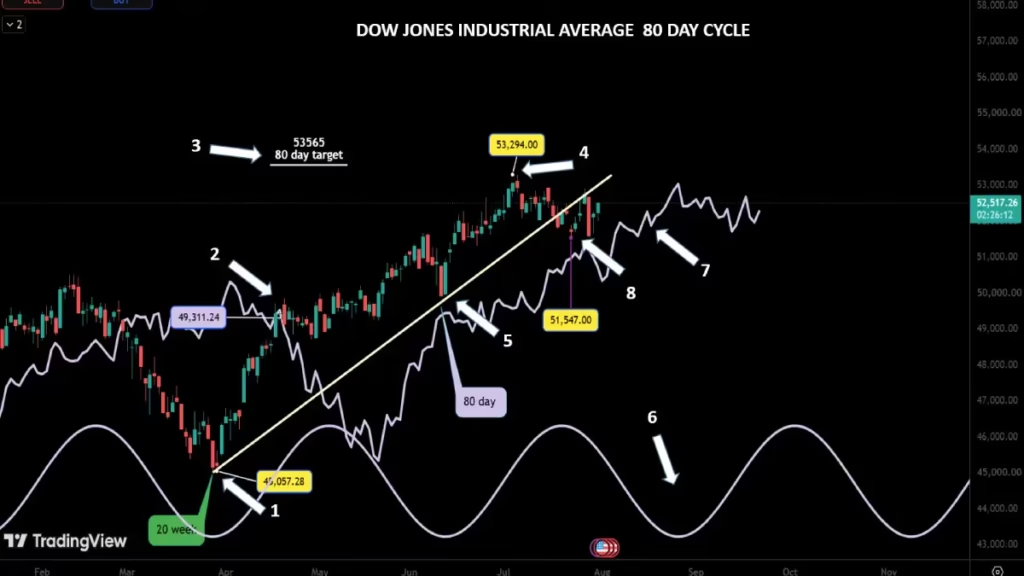
Following the Hurst rules of synchronicity, the March 2026 trough was also an 80-day cycle low (arrow 1).
Following this 80-day low formation, the market crossed above the 80-day FLD at 49,311 on April 22 (arrow 2), projecting a potential upside target of 53,565 (arrow 3)—representing a 4,254-point or 8.62% potential move. On July 7 (arrow 4), with the new all-time high of 53,294, the Dow Jones came within just 271 points (0.50%) of its target. Because this peak fell comfortably within the standard 1% margin of error, the target is considered fully met, maintaining a 100% success rate across two consecutive positive trading signals.
The first 80-day cycle following the March low concluded on June 10, (arrow 5) lasting 76 days—just 8 days longer than the 68-day nominal average discovered by J.M. Hurst over 50 years ago. The next 80-day cycle trough is expected to form around August 17 (arrow 6). According to synchronicity, this should coincide with the 20-week, 40-week, and 18-month cycle lows.
Technically, price should cross below its FLD (arrow 7) to confirm the 80-day cycle peak. Following the June 10 low, I drew an 80-day Valid Trend Line (VTL) (the yellow uptrend). A cross below this VTL confirms not only the 80-day peak but also signals that the peak of the next longer cycle (the 20-week) is either formed or forming. By printing a low of 51,547 on July 23 (arrow 8), the market crossed below its VTL, confirming that the July 7 all-time high is potentially both the 80-day and 20-week cycle peak.
We must now monitor closely where the rally following the July low stalls relative to its VTL.
The 40 Day Cycle
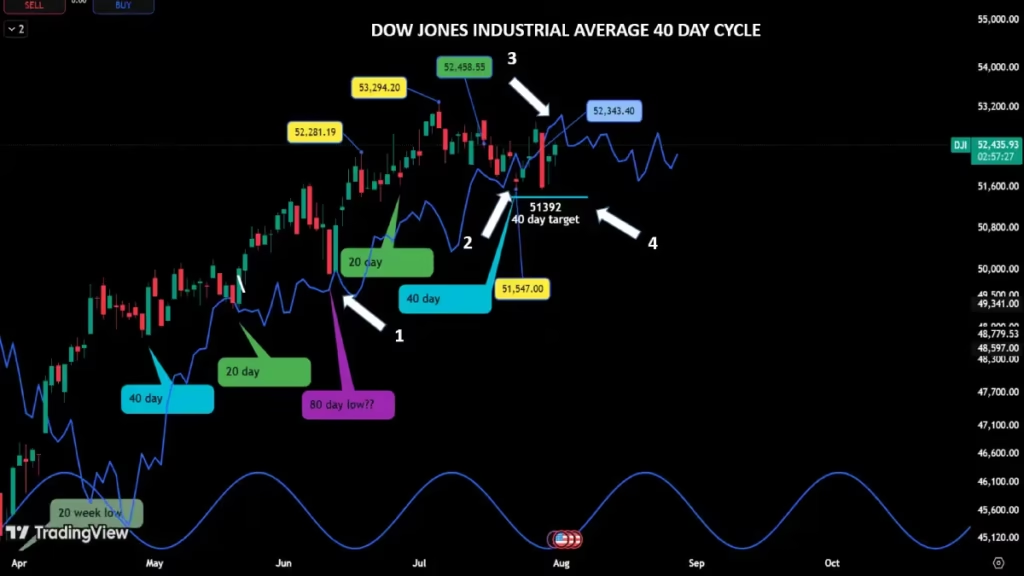
In my June update, the 40-day cycle low was expected to land on June 5. Just 5 days after that projected date, on June 10 (arrow 1), the Dow jones formed a low at 49,913 right on its cycle line, reinforcing strong market bullishness. Adding 34 days (the Hurst average length for a 40-day cycle) to this low yielded July 16 as the potential target date for the next 40-day low.
In reality, 7 days later (July 23) (arrow 2), the DJIA formed a low at 51,547. During this move, price crossed slightly below its cycle line (FLD), but the cross was not clear enough to trigger a formal downside trading signal. The market subsequently rebounded, trading along its FLD on its way to forming the next 40-day cycle peak.
During the next 40-day cycle trough sequence, scheduled around August 26, the market is expected to cross cleanly below its FLD to project a new downside target. On August 29, the DJIA crossed below its cycle line at 52,343 (arrow 3), establishing a downside target of 51,392 (arrow 4). However, because this low should theoretically align with longer cycles, we can anticipate a sharper overall decline.
The 20 Day Cycle
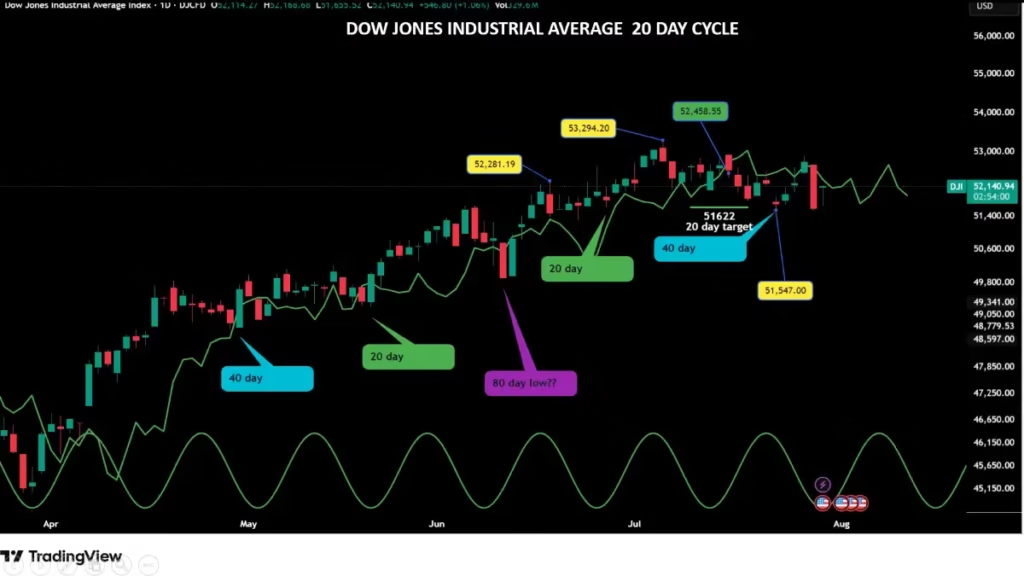
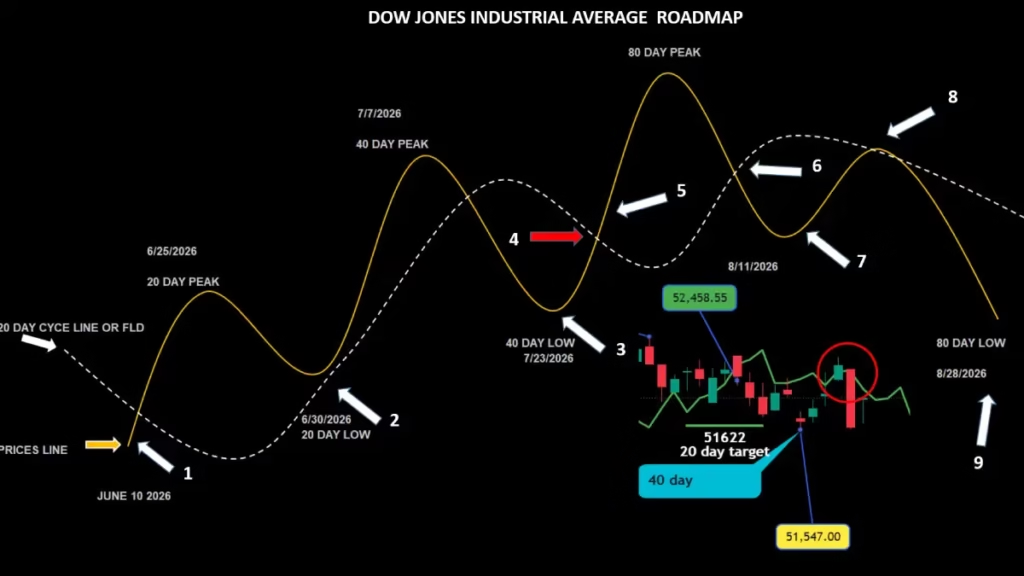
The 20-day cycle is extremely useful for short-term traders, particularly when timing entries within the broader 80-day cycle structure. As we will observe on the roadmap, price consistently follows these underlying wave dynamics.Let’s step through the current roadmap: since the June 10(arrow 1) 80-day low, two complete 20-day cycles have finished. The first ended on June 30 (lasting 20 days)(arrow 2), and the second concluded on July 23 (lasting 23 days)(arrow3), totaling 43 days.
This provides valuable tactical information: short cycles are starting to stretch, signaling that market momentum is losing steam.Right now, we are positioned right at this juncture following the 40-day cycle low (red arrow 4). Technically, after completing a 40-day low, price should cross back above its cycle line (arrow 5) to offer a quick short-term upside target. However, on July 28, the market bounced but failed to cross above its cycle line.
The very next day, the Dow jones dropped over 2%, confirming a loss of momentum (the red circle).After completing its peak, price is expected to cross back below its cycle line (arrow 6) on its way down to the major 80-day cycle low. It should form an initial low (arrow 7), bounce toward its FLD to test it as resistance (arrow 8), and then resume its decline into August 28 (arrow 9), where a major cycle low should form. Because the market failed to cross above its FLD following the 40-day low, there is a high probability the DJIA will continue trading beneath its FLD through the end of the month.
THE ROADMAP
Conclusion
Navigating the current market landscape requires strict alignment between short-term tactical trades and long-term cycle structures. As our analysis demonstrates, while the overarching 18-month cycle on the Dow Jones maintains its long-term bullish context, the convergence of shorter 20-day, 40-day, and 80-day cycles signals clear momentum exhaustion. The failure to reclaim key Future Line Demarcation (FLD) levels suggests that caution is warranted as we approach late August.
Traders should keep a close eye on critical cycle lines and VTL confirmations to manage risk effectively. Synchronized lows across multiple timeframes often create the cleanest trading opportunities of the year. Stay disciplined, respect your stop levels, and let the cycle roadmap guide your execution. Make sure to subscribe to the newsletter and bookmark our site so you never miss our upcoming weekly cycle updates and price target revisions.
Discover more from tradingmarketcycles
Subscribe to get the latest posts sent to your email.