
THE SP500 INDEX
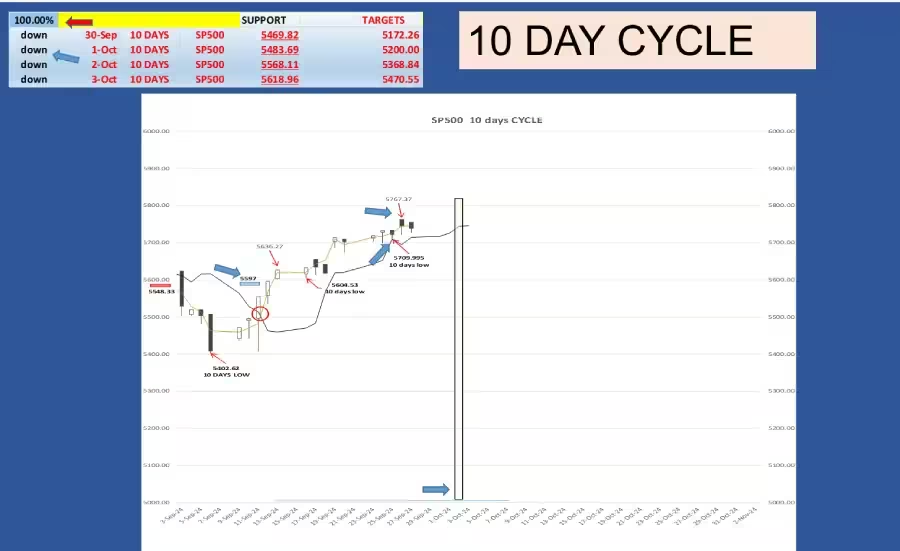
The 10 days cycle.
The SP500 index meet his target shorty after triggered his signal and keep moving up, to make a new a time high on Thursday September 26 at 5,767.37
The last 10 days cycle formed certainly on September 25, finding support on his cycle line.
On the next decline to form the next 10 days cycle low, the SP500 index should cross his cycle line, and provide a downside target.
The next low is schedule for October 3.
The cycle trend for the 10 days cycle is down.
As explained in previous posts, the cycle trend is not the market trend, the cycle trend is, in which phase the cycle is.
The success rate for the 10 days cycle is 100%, meaning if we trade each and every signal on this cycle, we have 100% of success.
Sometimes the target is met the same day of the signal, and we have no time to enter the market and take the signal,
For that reason when trading the 10 days cycle, is good to go to the lower time frame, the 5 days cycle to anticipate a potential signal, for example put 50% on the 5 days cycle signal, and the other 50 % when we get the signal on the 10 days cycle.
All depend too how far the low or the peak compare to the crossing point is.
Since when the SP500 index cross above or below the 5 days cycle line, this will confirm at least the end of the 5 days cycle.
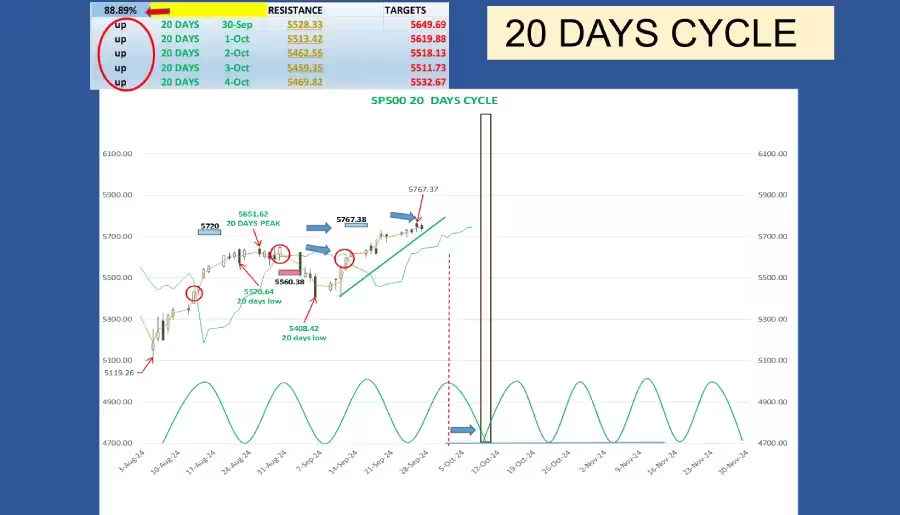
The SP500 INDEX- 20 days cycle.
On my last update, I mentioned the importance for the SP500 to stay above his cycle line.
I also said, if the SP500 index, cross below his cycle line, it will be the first sign of possible weakness to coming into the market.
The SP500 index, stay above his cycle line and made a new a time high at 5,767.37, right on the target provided by the Friday 13 signal, when the SP500 index crossed above his cycle line at 5585, providing an upside target at 5767.38.
Like as expected in previous video, a new all-time high have been made, meeting his target perfectly.
The next 20 days cycle low is certainly occurring now, and the next one is schedule between October 13 and 15.
On his way to form his low, the SP500 index, should cross below his cycle line, providing a potential downside target, and this target could be around the 80 days cycle lines.
The success rate for the 20 days cycle is 88% and the cycle trend is up.
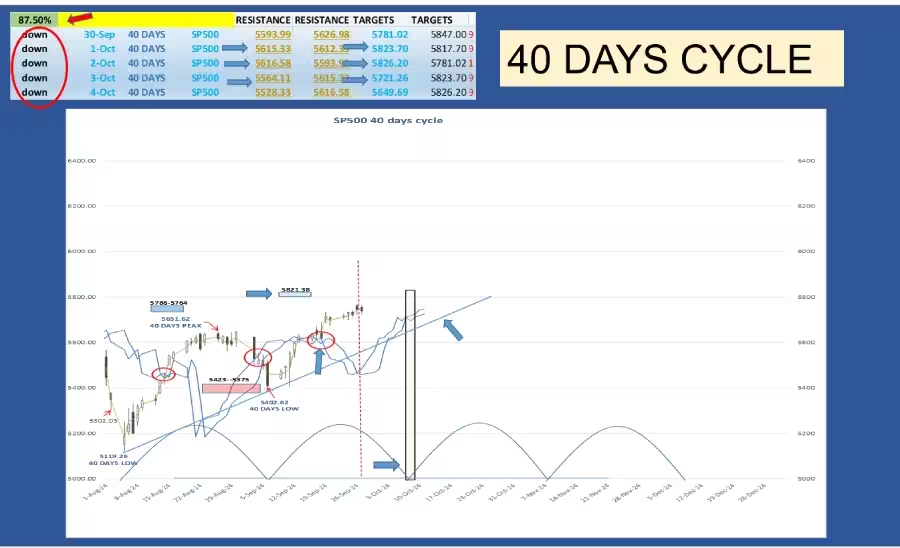
The SP500 INDEX – 40 days cycle.
After forming his low, as expected the SP500 index crossed back above his cycle line on September 17 at 5612, providing a potential upside target at 5821, or 209 dollars or 3.73%.
On September 26, the SP500 index made a new all-time high at 5767, this high is only 54 dollars, or 0.93% away from his target, since the high is within the 1% margin of error, and the target is considerate meet.
What next for this cycle?
Like mentioned in my previous video, since the last 40 days cycle low is confirmed, I draw the 40 days cycle trend line, the blue line, what’s Hurst call VTL, for more details about VTL, I recommend to watch my series of videos on my YouTube channel, tradingmarketcycles, you will find the links in the video page, or in the VTL post.
This trend line will help us to identify the next 40 and 80 days cycle peak, when the SP500 index will cross below.
The next 40 days low is expected to occur on October 10, the yellow zone.
Since it’s the second 40 days cycle since the August 5 low, during the formation of the next low, the SP500 should cross below his cycle line, providing a potential downside target, close to the 80 days cycle lines.
On the top left of the chart, you will find the cycles lines for this week and their potential targets, if the SP500 cross below this week.
The cycle trend is down and the success rate is 87%.
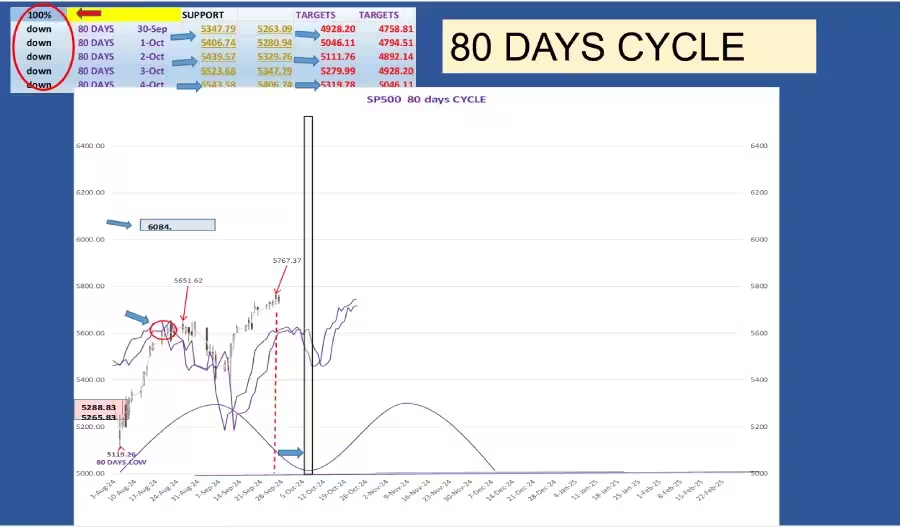
The SP500 INDEX- 80 days cycle.
6084 is the target for the 80 days cycle peak, this target has been triggered in August when the SP500 index crossed above his cycle lines at 5602.
With a high at 5767 on September 26, the SP500 index is 317 points below his target, since the low for this 80 days cycle is schedule for October 15, the time is running out to reach his target.
There is a high probability the SP500 index won’t meet his target this time.
At the time of the low formation, the SP500 index should find support on his cycle lines, which will be between 5640 and 5570.
Like mentioned in my last update, a cross below his cycle lines, will confirm some bearishness coming into the market.
On the top left of the chart, there is the cycle lines and their potential targets.
This week the cycle trend is down and the success rate is 100%.
Let’s see on the roadmap where we are.
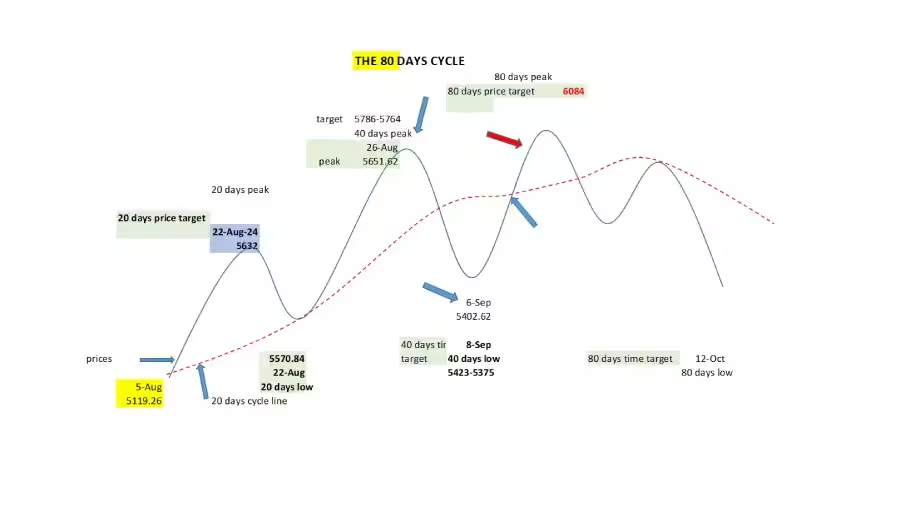
THE ROADMAP
The roadmap is for the 80 days cycle, so the cycle line used is the 20 days cycle line,
A roadmap can be done for every cycle possible, if trading the 40 days cycle, then on the roadmap we will use the 10 days cycle line and so on.
The last 40 days peak formed on august 26, and after forming the 40 days low on September 6, as expected the SP500 index cross back above his cycle line, and is on his way to the 80 days peak.
We are right at the red arrow, very close to the 80 days peak.
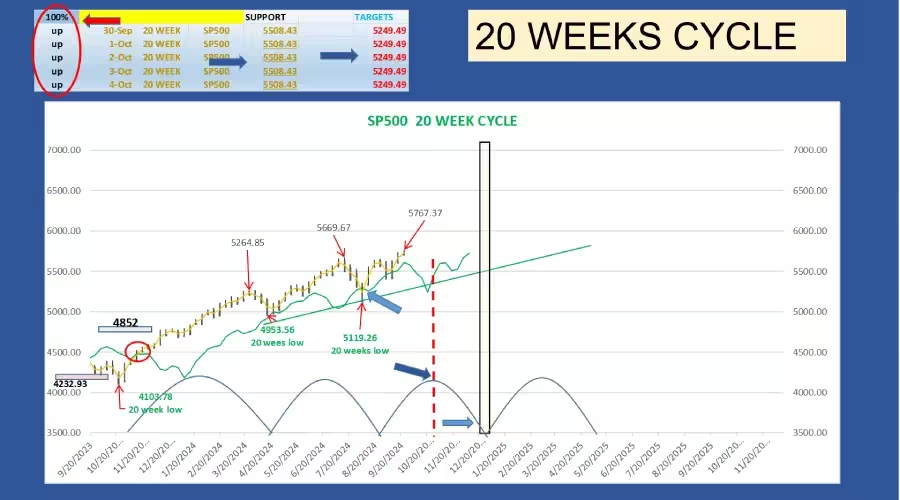
The SP500 INDEX – 20 weeks cycle.
The last 20 weeks cycle low was on August 5, the next low is expected mid-December, at the yellow zone.
The peak formation should be around mid-October, on the red dashed line.
The cycle lines and their potential downside target if the SP500 index cross below this week are above on the top left of the table.
The cycle trend is still up and the success rate is 100%.
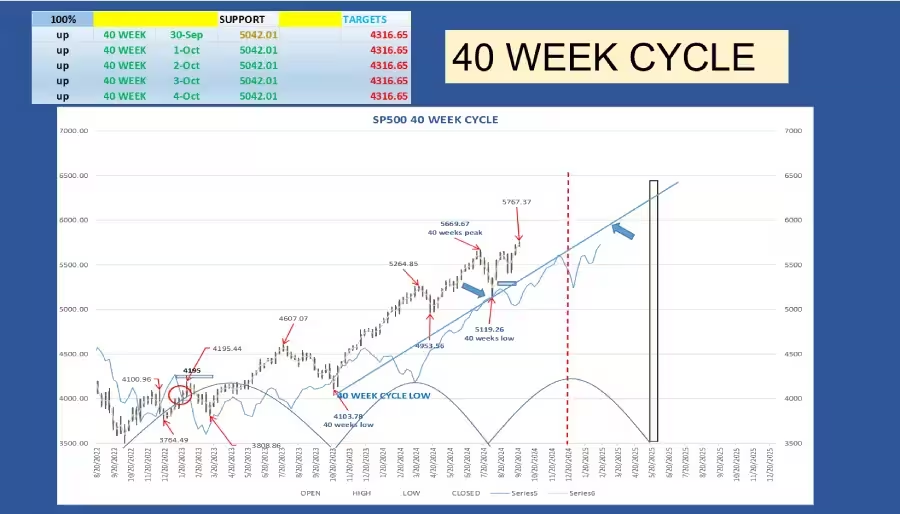
The SP500 INDEX- 40 weeks cycle.
This cycle is for the long term analysis, the last 40 weeks low was on the week of August 5, when this low was confirmed, I draw the 40 weeks cycle trend line, when the SP500 index will cross below his trend line, this will confirm the 18 months peak formed or is in formation.
When the 18 month will peak, this will be an important peak, this will be the second 18 months cycle since the major low in October 2022.
There is three 18 months cycle in the 54 months cycle (3.5 year), since the third one will be in his down phase, he should be less bullish even maybe bearish.
In Conclusion
Despite the September 26 new all-time high, we still have some weakness in the 80 days cycle, a crossing below his cycle line, will be the first major sign of bearishness,
Especially if the SP500 cross below his cycle line, before meeting his 6084 target, if this happen the 80 days cycle target will be invalid.