

The S&P 500 June 30, 2025 Update
Introduction
Welcome to our comprehensive analysis of the S&P 500 as of June 30, 2025. In this update, we explore the critical 18-month cycle and its implications for market movements. With insights drawn from recent trends, we’ll examine potential peaks and corrections, as well as technical indicators affecting the market’s future. Understanding these cycles can empower traders to make informed decisions. Whether you’re a seasoned investor or just starting, this analysis will equip you with the knowledge needed to navigate the current landscape effectively.
The SP500 18-Month Cycle Overview
We anticipate that the next peak for this cycle will form around January 2026. When this peak occurs, it will provide crucial insights into the extent of the upcoming correction. If the S&P 500 reaches its peak before December or January, we should prepare for a significant correction leading to the next 18-month cycle low.
Conversely, if the peak occurs after January 2026, the correction is likely to be moderate, with the next low expected between September and October 2026.
During this upcoming correction, the S&P 500 is expected to drop below its cycle line, indicating a downside target. In the last decline, the S&P 500 missed its target, which is typically a bullish indicator. As I noted in my recent Dow Jones Industrial Average update, the monthly midpoint of 5,265 barely dipped below its cycle line of 5,378. Without confirmation in the following bar, the target of 4,639 is technically invalid.
Let’s consider a contrarian approach: if we trade based on the downside target, recent signals indicated an exit point for taking profits. When the S&P 500 rebounded and crossed above its cycle line, it triggered an upside target of 6,183, which was met last Thursday, yielding a profit of 674 points, or 12.23%.
The yellow uptrend line represents the 18-month cycle trend line, known as the VTL in Hurst’s analysis. If the S&P 500 crosses below this line, it will confirm that the previous peak was at least the 54-month cycle peak, indicating a journey toward the next 54-month cycle low. Additionally, crossing below this trend line will help us identify the previous 54-month cycle lows from 2022 or 2023.
When the market misses its downside target, it signifies a return of bullish sentiment, while failing to meet an upside target indicates that bearish forces are regaining control.

The SP500: 40 week cycle
The blue line represents the 40-week cycle line, also known as the FLD. Despite a sharp rebound since the last low on April 7 and the S&P 500 reaching its previous all-time high, the market remains below its cycle line—this may signal initial weakness. To confirm that the S&P 500 remains in a bull market, it must sharply cross above its cycle line with a bullish candle.
If the S&P 500 trades above its cycle line this week with a bullish candle, we could see a crossing point at 6,078 and a potential upside target of 7,321. We must closely monitor this 40-week cycle line to determine where the peak will occur. The next peak is anticipated by the end of August, with a low expected by late December 2025. Should the peak occur before August, it will confirm market weakness, and the S&P 500 may not meet its upside target even if it crosses above its cycle line.
During the next formation of the 40-week cycle low, the S&P 500 should find its low on its cycle line, but it is still too early to determine where these lines will be. Once confirmed, I will draw the 40-week cycle trend line, the VTL, which will help us identify the next 18-month cycle peak and anticipate the next correction. The success rate for the 40-week cycle remains at 100%.

The SP500: 20 weeks cycle
The green line indicates the 20-week cycle line. The low on April 7 met and exceeded its target, confirming that it is part of a higher-degree cycle. In the week of May 11, the S&P 500 crossed above its cycle line at 5,847, providing an upside target of 6,859, representing a potential 1,000-point or 17% rally. If this target is reached, it will set a new historic high.
This 20-week cycle peak was expected around June 15, with a low anticipated by the end of August. Last week, the S&P 500 hit a high right at the peak of the cycle. If the market continues to rise over the next two to three weeks, we can expect a moderate correction.
We can forecast the formation of the 20-week cycle peak by analyzing the lower time frame, specifically the 80-day cycle. Technically, this 20-week cycle low should form on its cycle line, which will be at 6,010. If the S&P 500 crosses sharply below this line during the next low formation, it will confirm increasing bearish sentiment.
When the 20-week cycle is confirmed, I will draw the 20-week VTL, which will help us identify the next 40-week cycle peak. Until the S&P 500 crosses below its 20-week cycle line, the target of 6,859 remains valid. If it crosses below before reaching this target, it will invalidate the target and indicate bearish conditions. The chart illustrates the cycle line and potential targets if the S&P 500 crosses below during the next few weeks. Since the start of the year, the success rate for the 20-week cycle has been 100%.

The SP500: 80 day cycle
The last 80-day cycle peak for the S&P 500 was on June 11 at 6,059, with a low on June 23 at 5,943.23. This cycle lasted nine days longer than expected. As anticipated, the S&P 500 formed its low on its cycle line. A new 80-day cycle began on June 23, with the peak expected on July 27 and the low on August 30.
During the next formation of the 80-day cycle low, the S&P 500 should cross below its cycle line, indicating a downside target. The chart includes a table showing the cycle lines and their potential targets if the S&P 500 crosses below them. After confirming the 80-day cycle low, I will draw the trend line, which, when crossed below, will confirm the 80-day cycle peak and the potential 20-week cycle peak.
During the recent rebound, the S&P 500 crossed above its cycle line at 5,577, providing an upside target of 6,319, a new all-time high, representing a potential profit of 742 points, or 13%. If the S&P 500 reaches this target, it will validate the potential crossing of the 40-week cycle. The success rate for the 80-day cycle stands at 75%.

The SP500: 40 days cycle
With a low of 5,943.23, the S&P 500 formed its last 40-day cycle on June 23. On May 1, it crossed above its cycle line at 5,536 for a target of 6,237, which represents a potential profit of 701 points or 12.66%. At the time of this update, the S&P 500 reached a new all-time high of 6,178.80, just 59 points from its target, which is considered met given the 1% margin of error.
The blue trend line represents the 40-day cycle trend line. When the market crosses below it, it will confirm that the next 80-day cycle peak has formed or is in formation. We expect the next 40-day cycle low to form on July 27, at which point the S&P 500 should cross below its cycle line and provide a downside target. The chart includes a table showing the cycle lines and potential targets if the S&P 500 crosses below during the upcoming low formation. Since the beginning of the year, the success rate for the 40-day cycle has been 100%.

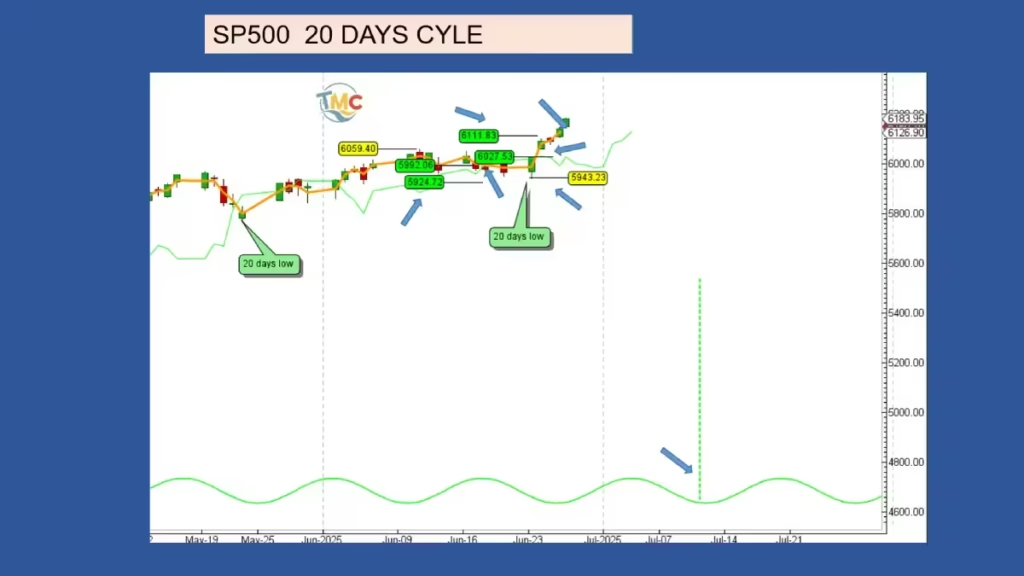
The SP500: 20 day cycle
The last 20-day cycle formed on June 23. During this cycle’s low formation, we expected the S&P 500 to cross below its cycle line, which it did at 5,992.06, providing a downside target of 5,924.72. The low reached 5,943.23, just 18 points from the target, which is considered met.
On June 24, the S&P 500 crossed above its cycle line at 6,027.53, offering a target of 6,111.83. By June 26, the S&P 500 met this target, yielding a profit of 84 points in two days, or 1.39%. The next two 20-day cycle lows are expected on July 11, during which the S&P 500 should form its low on its cycle line. Since the start of the year, the success rate for the 20-day cycle has been 100%, indicating each trading signal has been successful.
The Success Rate Table
The table below provides a record of the S&P 500, DJIA, Gold, and Bitcoin across various cycles, ranging from 10 days to 18 months, covering the period from the beginning of 2025 until June 27, 2025. I publish this table every six months. In previous articles, I shared success records for the years 2023 and 2024.
The percentages displayed indicate the success rates for different trading signals, which can either be bullish (upside) or bearish (downside). A target is considered achieved when the market is within 1% of the set target, although a margin of error of 1% is generally acceptable. For some markets, a tighter margin of 0.5% may apply.
How to Use This Table:
This table serves as a valuable tool for traders to determine which markets and cycles to engage in, enhancing their chances of success. I have highlighted in red the cycles that are less productive, indicating that trading during these periods will yield successful outcomes only about half the time.
It is important to use this table with caution, as past performance does not guarantee similar success rates in the future.

Conclusion,
In conclusion, we find ourselves at a critical juncture. It is essential to closely monitor the 40-week cycle line to determine whether the S&P 500 remains in a bull market or if the current rally is merely a bull trap. If the S&P 500 crosses above this line, we can expect it to rise further and reach various upside targets. Conversely, failure to do so could signal bearish conditions ahead.
One Response