

“The Bitcoin Market Cycles Analysis: Why Multiple Technical Indicators Point to $104K Price Target in October 2025”
Introduction:
The Bitcoin’s price movements follow predictable patterns called market cycles. These cycles help us understand when prices might go up or down. Think of them like waves in the ocean – they have peaks and valleys that repeat over time. By studying different cycle lengths (from 20 days to 18 months), we can make better predictions about Bitcoin’s future price direction. This analysis looks at what happened after Bitcoin hit its recent high and what might come next.
In my previous analysis, I predicted the Bitcoin market would reach its 18-month cycle peak in August. After Bitcoin hit its all-time high of $124,517 on August 14, both the 18-month and 40-week cycles started moving downward. Let me explain what this means for Bitcoin’s future price.
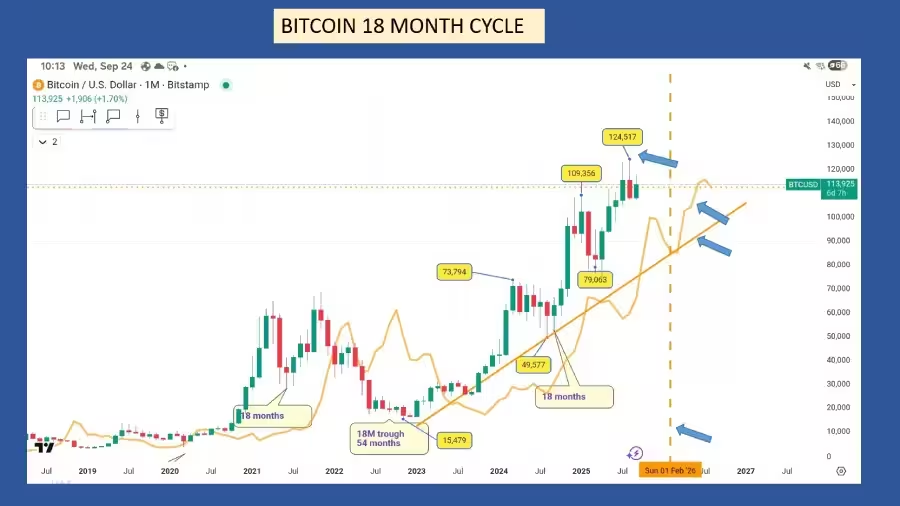
Looking at the 18-month cycle first,
Even though $124,517 might be the peak, the Bitcoin’s market long-term outlook remains positive. The market continues trading above its main cycle line and the 18-month trend line (called the VTL) the solid uptrend. We expect the 18-month cycle low to form in February 2026 near the cycle line, around $85,000, which will align with the 18-month trend line.
Finding support at this VTL level is critical for Bitcoin’s health. A sharp drop below this line would be very bearish for the Bitcoin market and would confirm that the peak before crossing was at least a 54-month cycle or 4.5-year cycle peak. If Bitcoin crosses below its cycle line before February 2026, this would be the first warning sign of potential weakness in the Bitcoin market.
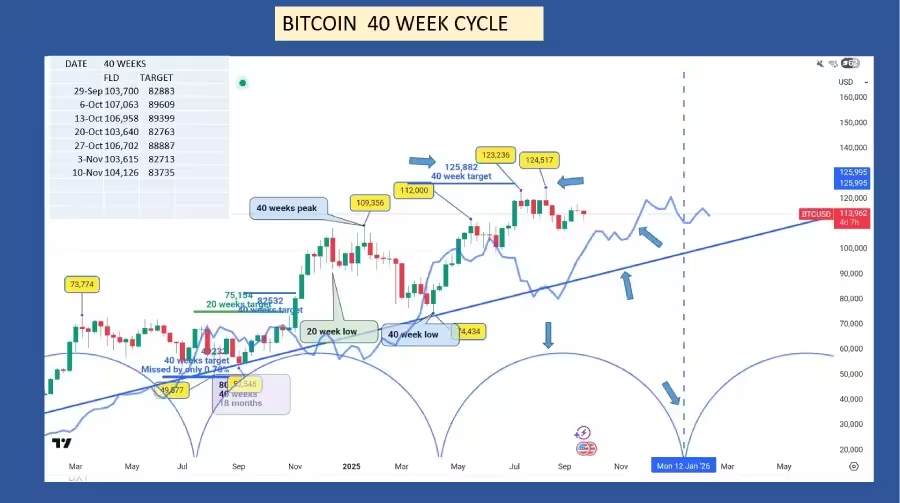
Now let’s examine the 40-week cycle.
As I mentioned in my previous update, the last 40-week upside target of $125,882 was reached on August 14 with the $124,517 all-time high.
This peak was scheduled for the second week of August 2025. By forming its peak on August 14, the timing was extremely accurate, which keeps my success rate for trading the 40-week cycle at 100%.
The low for this 40-week cycle is still expected in mid-January 2026, shown by the blue vertical dashed line on my charts. If the $124,517 peak is confirmed to be the 40-week peak, this peak occurred slightly on the left side of the cycle, which means we can expect a sharp correction.
From a technical standpoint, the Bitcoin market should cross below its cycle line, providing a clear downside target.
On the top left corner, you will find a table with the cycle line and potential targets if the Bitcoin market crosses below its cycle line during the next few weeks.
The blue trend line represents the 40-week VTL. We must watch carefully how Bitcoin reacts when it approaches this line.
A sharp cross below will confirm that the peak before the crossing is at least the 18-month cycle peak. Since there’s a very high probability that the $124,517 high represents the 18-month cycle peak, we can expect Bitcoin to cross below its 40-week cycle trend line, or VTL.
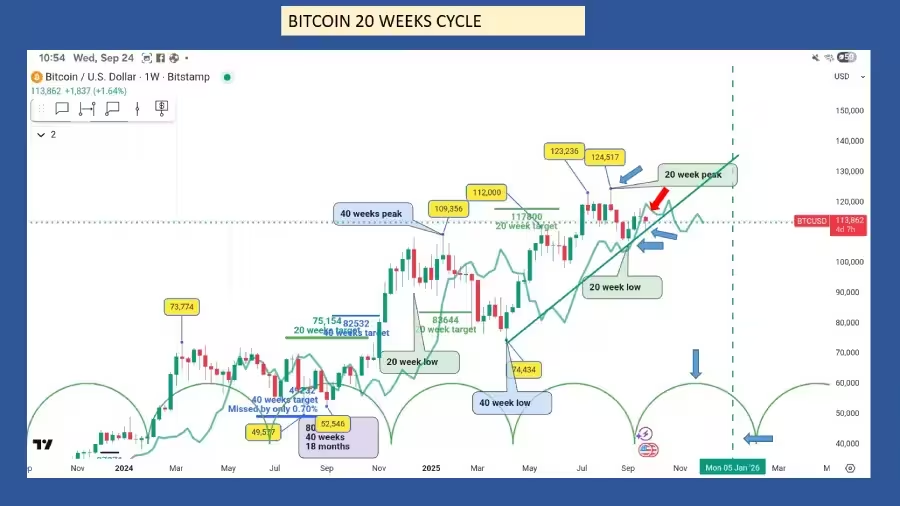
Let’s now examine the next lower cycle, the 20-week cycle.
The August 14 $124,517 high was the 20-week cycle peak, and with a length of 21 weeks, the low formed on September 1.
From the April 20-week cycle to the September low, I’ve drawn the 20-week cycle trendline, the VTL. When Bitcoin crosses below this line, it will confirm that the August high is the 40-week peak.
Last week, the Bitcoin market crossed slightly below its cycle line at $113,447. Before this signal becomes valid, we need confirmation. If this week Bitcoin trades well below its cycle line, this will provide confirmation and we can validate the $102,437 downside target.
Also last week, the Bitcoin market also found support on its VTL, the green trend line. If the market crosses below it, this will be the second confirmation of the new downtrend for the next few weeks.
Any sharp crossing back above its cycle line this week or next week, will invalidate the signal and Bitcoin will resume its uptrend.
The peak for the next 20-week cycle is expected around November 3, and the low on January 5, 2026.
With two positive trading signals, the 20-week cycle maintains a 100% success rate.
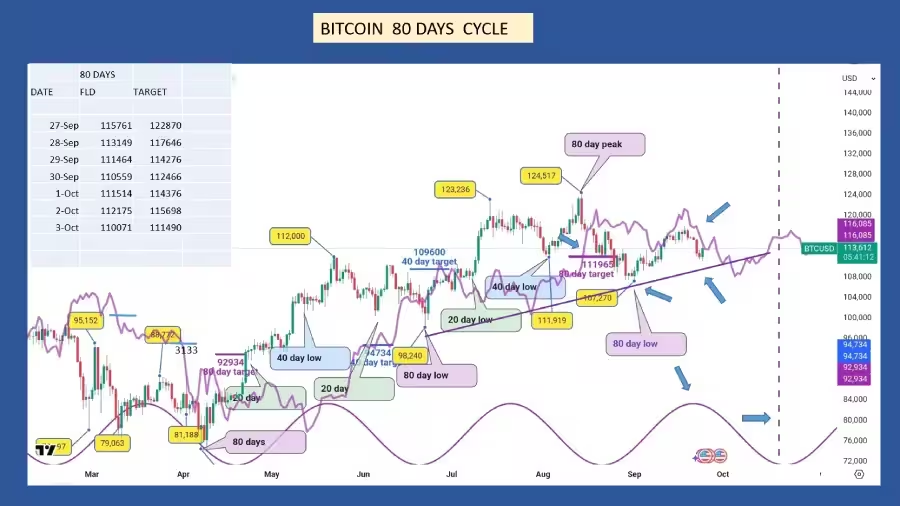
Now for the 80-day cycle.
The last August 18 downside trading signal met its $111,965 target just 2 days later. September 1st marks the last 80-day cycle low.
Having said that, what can we expect for the new 80-day cycle?
The September low is the second 80-day cycle since the April 6, 40-week low.
Technically, after forming its second 80-day cycle low on September 1, the Bitcoin market should cross back above its cycle line and provide a new upside target.
On the top left corner, you will find a table, on this table you can see the cycle line and potential upside targets if Bitcoin crosses above it during the next trading days.
The purple line from the June low to the September 1 low represents the 80-day trend line or VTL. A crossing below it will officially confirm the 20-week peak formation on August 14.
We can start to see some weakness in the market. As mentioned above, after the second 80-day cycle formation following a 40-week low, the market should cross above its 80-day cycle line. Lately, the market rebound found resistance on the cycle line and resumed its decline.
By analyzing the 20-day cycle, we can estimate how much weakness exists in the 80-day cycle Bitcoin market.
The peak for the current 80-day cycle is expected to form on October 4 and should form above its cycle line. If the peak occurs below its cycle line, more trouble is still to come for the Bitcoin market.
The low is scheduled for November 9, marked by the vertical purple dashed line.
What’s next? In a balanced market, as mentioned earlier, Bitcoin should cross above its cycle line after the second 80-day cycle low. Then for the third and fourth cycles, the market should cross below its cycle line and stay below until the 80-day cycle is completed on January 19, 2026.
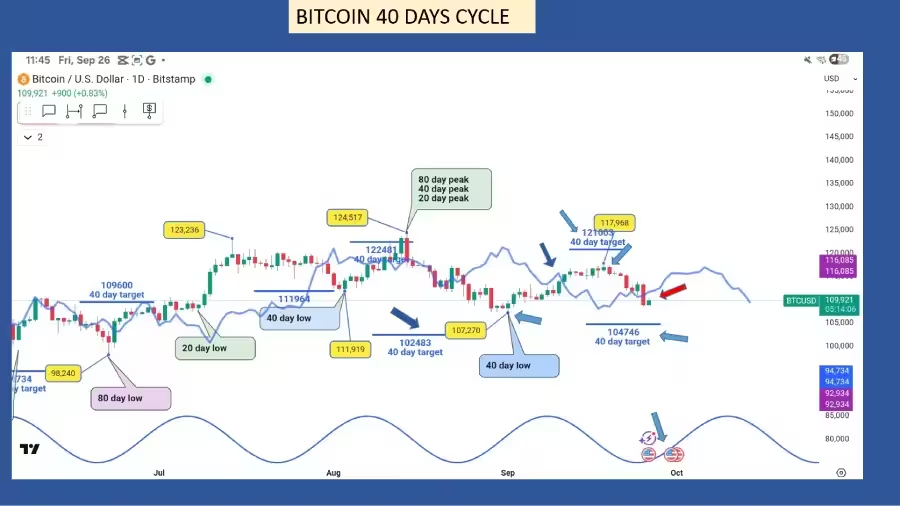
let look at the 40-day cycle.
According to Hurst’s rule of synchronicity, the September 1 low is also the 40-day and 20-day cycle low.
On August 19, the Bitcoin market provided a $102,483 downside target.
On September 1, eight days earlier than expected, Bitcoin formed a low, which should be the 40-day cycle low at $107,270, missing its target by $4,787.
Usually this is a bullish sign, especially after forming its low. Bitcoin crossed back above its cycle line at $114,273, providing a new $121,003 upside target.
With a $117,968 high on September 18, the market formed its 40-day cycle peak right at the peak of the cycle.
The low is expected for October 5. Technically, Bitcoin should form its low on its cycle line.
On Friday, September 26, Bitcoin crossed below the cycle line at $111,357, providing a $104,746 potential target. Since I recorded this video on Friday morning, we need crossing confirmation by the end of the day.
As a reminder, to get a valid signal, we need the median price of the day, week, or even month crossing below or above the cycle line.
In the case of the 40-day cycle, we need to wait for the end of the day to see where the median price will be at the closing bell. If the crossing is confirmed, then the $104,746 downside target becomes valid.
To invalidate the trading signal, the Bitcoin market would have to cross back above its cycle line during the weekend. Sometimes when a market crosses below its cycle line for one or two days, the crossing may be due to news events. We always have to take some crossings with a grain of salt and not jump into the market blindly.
It’s always better to wait for confirmation.
The success rate of the 40-day cycle is 66%.
Short term trader corner
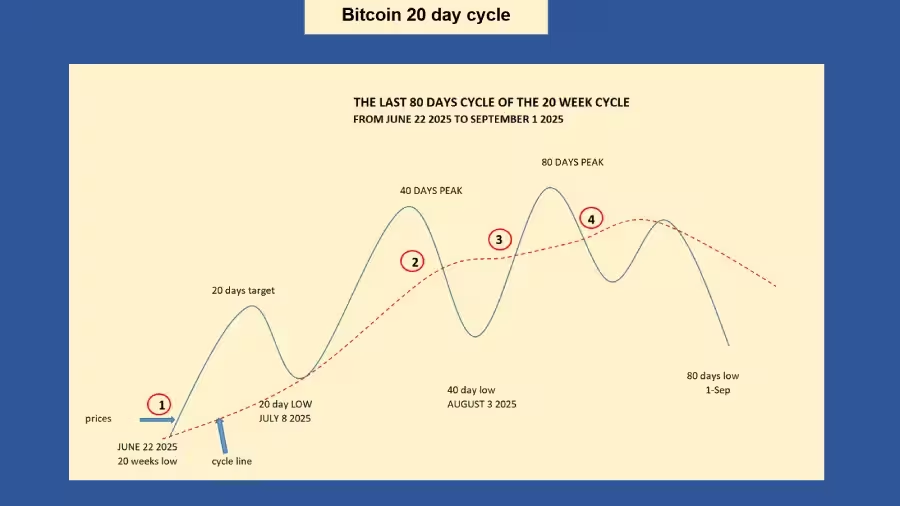
Using a 20-day trading pattern, this week we’ll examine how profitable the last 80-day period was, from June 22 to September 1. This article will show you a different approach to using trading cycles.
When you decide to trade using a specific cycle, you need to watch the trend line of a shorter cycle. For example, if trading a 40-day cycle, you should monitor the 10-day trend line. If trading 20 weeks, you need the 40-day cycle.
This approach differs from traditional 80-day cycle trading, which uses 80-day signals to show when the market will cross its 80-day trend line. The 80-day target gives us an initial goal for the 80-day cycle.
Using the standard method of watching when prices cross the 80-day trend line, you only get 2 trading opportunities – one when prices go up and one when they go down. Today, we’re looking deeper into the 80-day cycle to trade throughout the entire period.
Every cycle always provides 4 trading opportunities – 2 for upward moves and 2 for downward moves.
On the first chart, the blue line shows market prices when we combine 3 cycles together. For more details, check my article “Anatomy of Cycles,” which explains what Hurst calls the summation principle. The red line shows the cycle trend line – when prices cross this line, it signals potential profit targets.
Let’s begin.
First Trading Signal
The June 22 low hit $98,240. The first upward cross happened at $105,880, targeting $113,520 for a potential $7,640 profit. Since the 20-day cycle low was expected around July 9 and should touch its trend line, traders can choose their entry strategy. Aggressive traders might enter now, using the 20-day trend line as their safety exit point.
By July 2, prices moved too far from the trend line, so it’s time to switch the safety exit to the 10-day cycle. Still using the 20-day trend line would cause losses.
On July 8, with a $107,471 low, Bitcoin formed its 20-day low perfectly on schedule (just one day early) and found strong support right at its trend line. The next low will be the 40-day cycle low.
To protect and maximize profits, there are 3 exit strategies:
- a) Use the 5-day cycle line as your safety exit
- b) Know that during 40-day cycle formation, in balanced markets Bitcoin typically drops below its 20-day trend line, triggering a potential downward target (crossing #2 on the chart) – this might be time to bet against the market if the downward target looks promising
- c) Exit when the market reaches its target
Using the 5-day cycle line, we exit on July 20 when prices drop below $118,254, earning $12,374 profit.
Using the 20-day cycle on July 25 at $118,400 earns $12,250 profit.
The final option, exiting when the market hits the $113,520 target, earns $7,640 profit.
Second Trading Signal
On July 25, Bitcoin provided a $107,471 downward target. We must calculate the risk-reward ratio to see if this trade makes sense. Let’s assume we take it.
Since betting against the market during an upward trend isn’t recommended, we have 2 options. Exit using the 5-day cycle as a safety stop, or when the market reaches its target – whichever comes first.
On August 5, the market cross above his 5 day cycle line. We exit the next day at the opening price of $113,243 for $4,843 profit.
Third Signal
After forming its 40-day cycle low, the market should cross back above its trend line, providing an upward target. The market crossed at $118,103, targeting $123,087.
Since the next peak should be the 80-day cycle peak, we’ll exit at the target. On August 13, the market reached $123,000 for a $6,899 profit.
Fourth Signal
The final signal came on August 19 at $116,332, targeting $107,893. This downward signal aimed toward forming the 80-day cycle low.
Typically before reaching its low, the market makes an initial low, bounces back toward its trend line (using it as resistance), then continues declining to form its 80-day low.
On August 29, the market reached the target for an $8,439 profit.
Trading this 80-day cycle using the 20-day trend line (F.L.D.) generated $27,821 profit over 27 trading days.
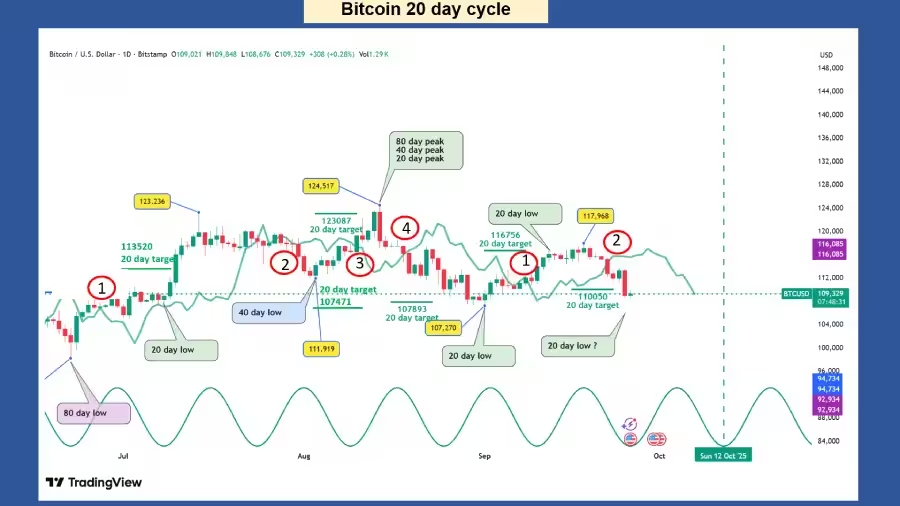
Now let’s examine the current 80-day cycle that started September 1.
The first signal came September 9 with a $116,756 target. On September 12, the market reached this target for a $4,756 profit.
The second signal was September 22, targeting $110,050. On September 25, the market hit this target for a $3,650 profit.
So far, we’ve earned $8,406 profit from just the first 2 signals.
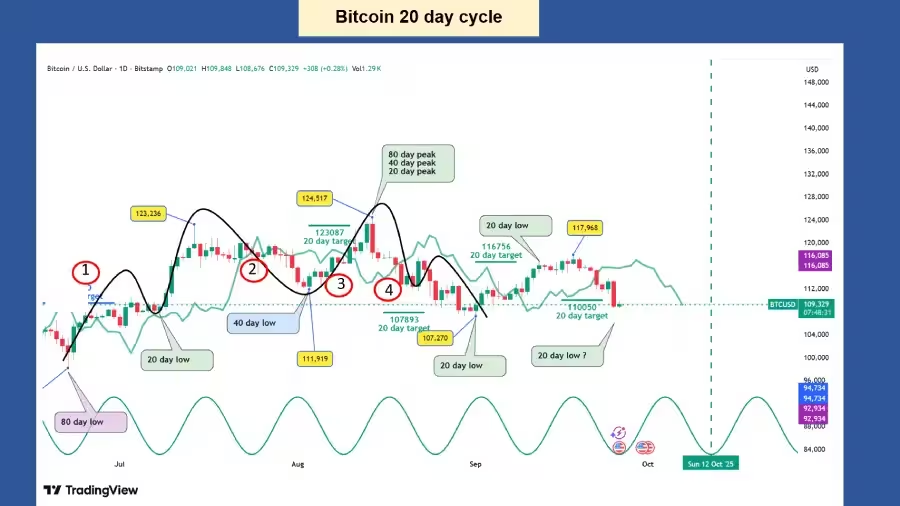
Important Disclaimer:
The following chart is the Bitcoin prices with the FLD ( the black line) on the top of the chart prices.
Conclusion:
Bitcoin’s multiple cycles are all pointing toward continued weakness in the short term.
While the long-term trend remains positive, several cycle peaks formed in August suggest lower prices ahead.
Key support levels around $85,000 (18-month cycle) and $104,746 (40-day cycle) represent important tests.
If Bitcoin holds these levels, the bullish long-term outlook stays intact.
However, breaking below major trend lines would signal deeper corrections. Traders should watch for confirmation signals and avoid making hasty decisions based on single-day price movements.