

“S&P 500 Market Cycle Analysis: Complete Guide to 2025-2026 Stock Market Predictions and Trading Signals”
Introduction:
The S&P500 market has been making headlines with record-breaking highs, but what does this mean for everyday investors? Understanding market patterns can help you make smarter decisions with your money. In this analysis, we’ll break down the recent S&P 500 performance using simple market cycles that even beginners can understand. Whether you’re planning for retirement or just starting to invest, these insights will help you navigate the current market conditions and prepare for what’s coming next.
Last month, the S&P 500 stock market kept climbing higher until it reached a brand new record of 6,532.65 points on September 5.
Let’s look at what happened since my last market update and what we might see in the coming months.
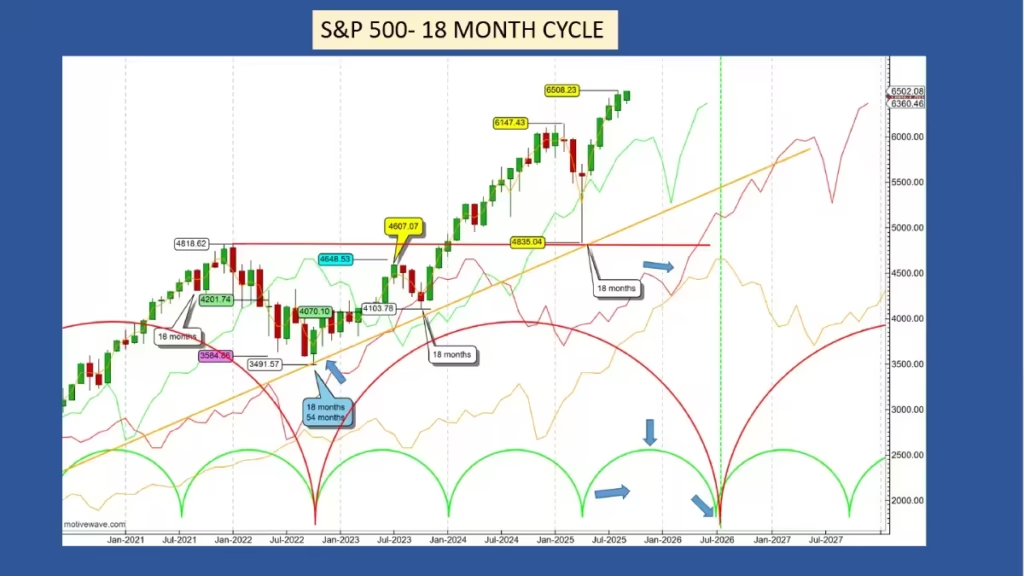
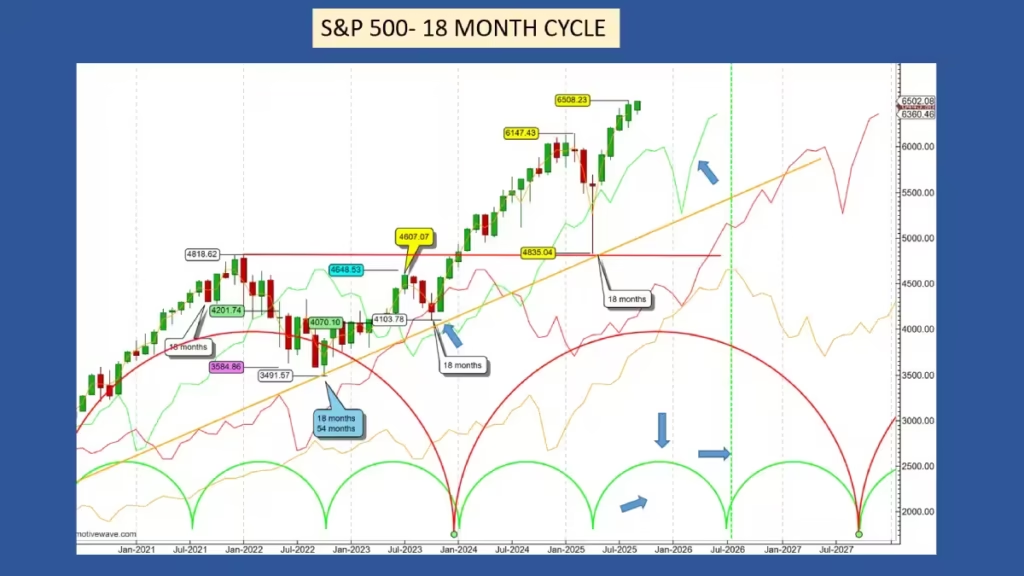
Let’s begin with the long-term 18-month pattern.
The S&P 500 started its new trading month last Tuesday, September 2nd, and it began with stocks going down that day.
Overall, the stock market is still moving upward, trading well above its long-term trend line shown in yellow on the chart.
The peak for this 18-month pattern is still expected to happen around January 2026, with the lowest point coming between September and October 2026.
Let’s look at two different ways this could play out.
Even though using market patterns and cycles is very accurate and reliable, it’s not perfect and there’s no magic formula to predict everything.
Unlike what many people claim, there is no perfect system, which is why it’s always smart to consider different possibilities and go with the most likely outcome.
The first possibility is my main prediction.
This happens when the last major 54-month cycle started in October 2022.
In this case, our current 18-month cycle is the third one within the 54-month cycle, and usually the third 18-month period tends to be negative for stocks.
If this is correct, we can expect the peak to happen before January 2026, and the S&P 500 to drop below its trend line and find support at the red line, which represents the 54-month cycle.
The second possibility,
Involves moving the last 54-month cycle from October 2022 to October 2023.
In this case, we would be in the second 18-month cycle of the 54-month pattern.
The S&P 500 should still drop below its trend line and provide a potential downward target.
Then it would bounce back above the line to trigger one final upward move for the peak of the 54-month cycle.
The current 18-month cycle peak is also expected in January 2026, with the low point between September and October 2026.
In both scenarios, the peak is expected to form in January.
We need to watch carefully where the peak actually occurs, before or after January, as this will be the first clue about which scenario is more likely.
If it happens before January, we’ll stick with the first scenario; otherwise, we’ll start considering switching to the second one.
By continuing to analyze weekly patterns, this will give us important information about future market conditions.
The 18-month cycle is excellent for long-term investing, especially when used together with the 54-month cycle.
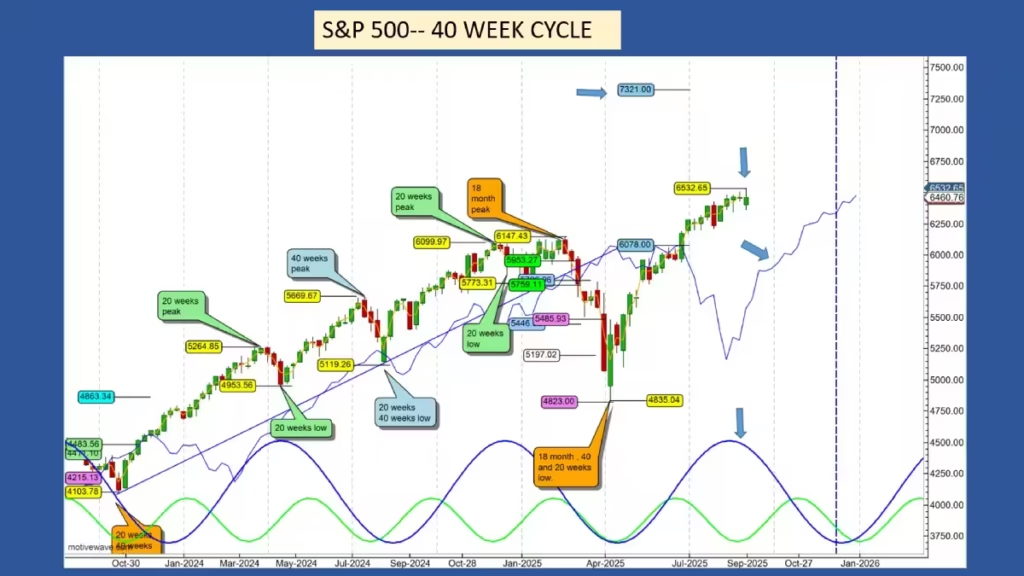
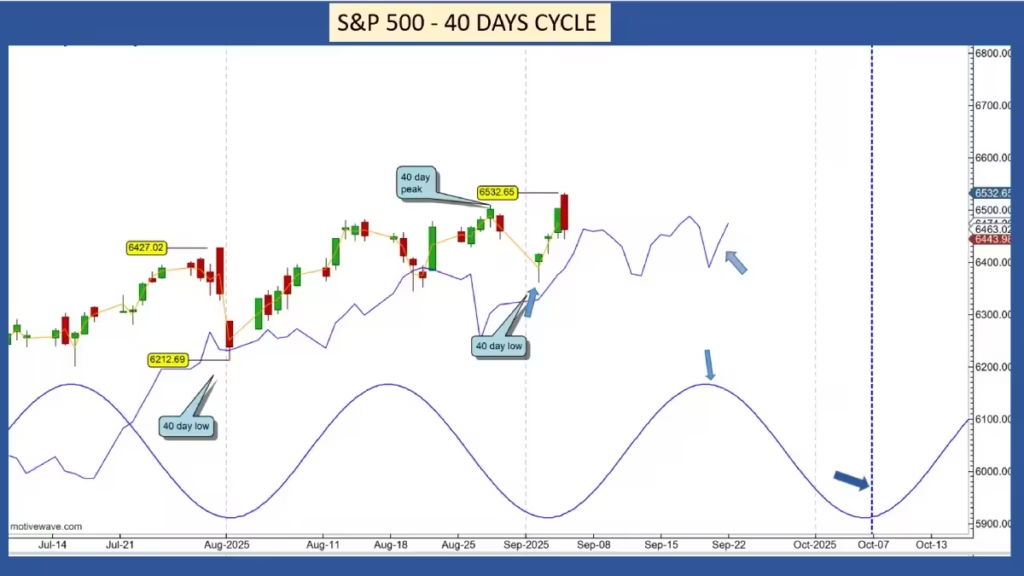
Now let’s examine the next shorter cycle, the 40-week pattern.
The 7,321 upward target is still possible for now. The only way for the S&P 500 to cancel this target is by dropping below its 40-week cycle line before reaching that goal.
Canceling this target would not only invalidate the prediction but also signal a potential downward trend.
According to market rules, during the formation of the first 40-week cycle low after a major bottom in a bull market, the S&P 500 should technically find support at its cycle line. This rule applies to any cycle timeframe.
Dropping below its cycle line would also indicate that the peak before the drop was the 40-week cycle peak.
The peak for the current 40-week cycle is expected to form around now.
If the 6,532.65 new all-time high is the 40-week cycle peak, it formed exactly at the right time for the cycle.
If this 40-week cycle peak is confirmed, then we can expect a downward trend for the next few months until December 2025.
For now, I don’t expect the S&P 500 to drop below its cycle line, but instead to find support there, then continue moving up toward forming its second 40-week cycle peak.
As mentioned in my previous update, it should reach the 7,321 target during the second 40-week peak formation.
With only one trading signal this year, the success rate is 100%, and the second signal is still active.
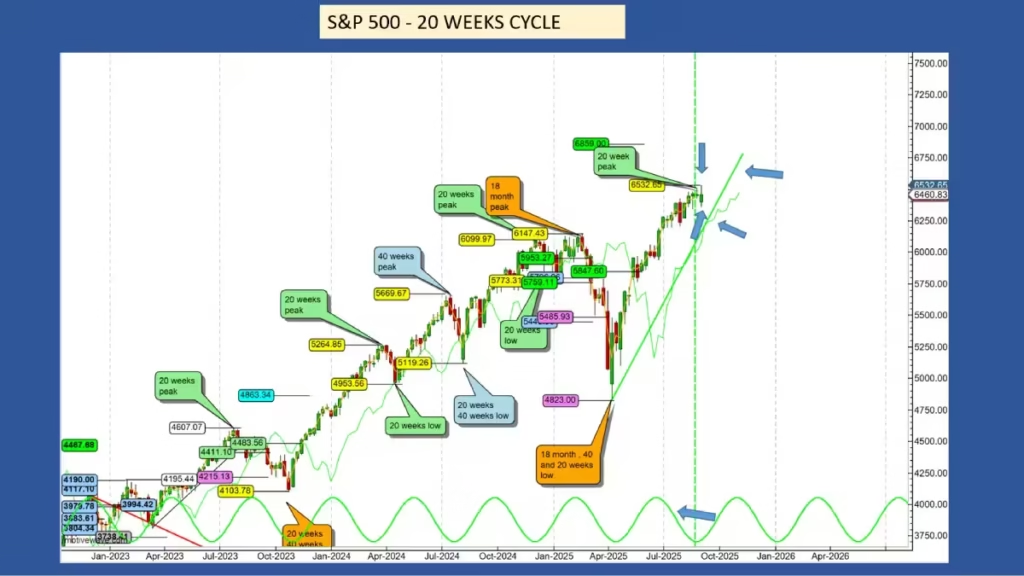
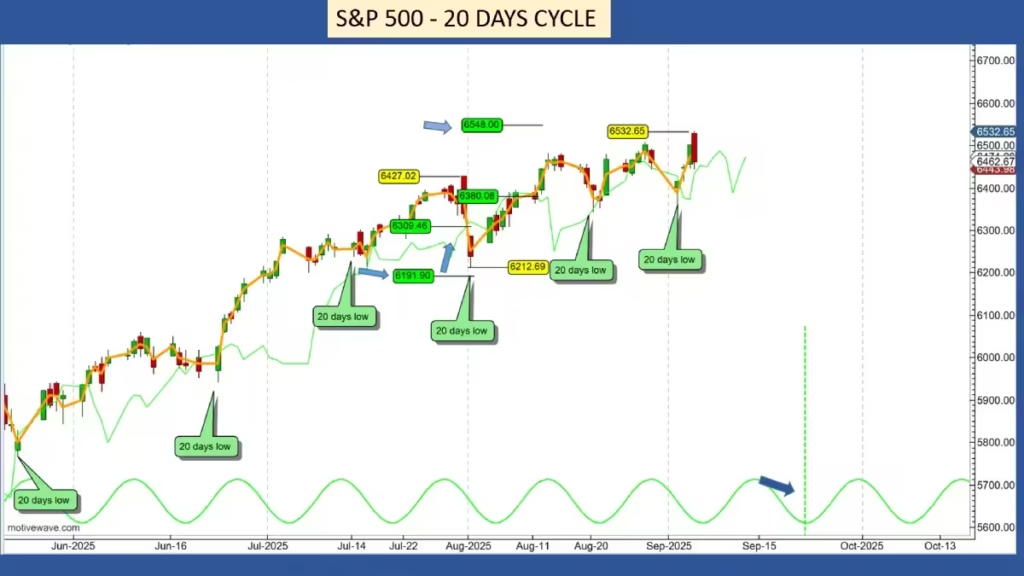
The 20-week cycle.
The 6,532.65 September 5 new all-time high is 327 points or 4.76% below the 6,859 target.
This high was the 20-week cycle peak, and since it formed on the right side of the cycle, we can expect a mild correction.
The target for this 20-week low formation is its own cycle line, around 6,242, with the low expected to form this week.
There’s a possibility the 20-week low occurred on July 28th, with the peak during the same week.
But since the cycle ran a bit longer than the Hurst nominal model, I believe the best place to mark the 20-week cycle low is on September 2.
From a trading perspective, knowing whether the 20-week peak formed at the end of July or end of August isn’t very important. What matters most is correctly identifying when the 20-week low forms, and for that we need to look at shorter timeframes while ensuring the market stays above its cycle line.
Anticipating the 20-week low formed last week or this week, I’ve drawn the 20-week cycle trend. If the low forms later, we’ll adjust the trend line position accordingly.
The success rate for the 20-week cycle is 100%.
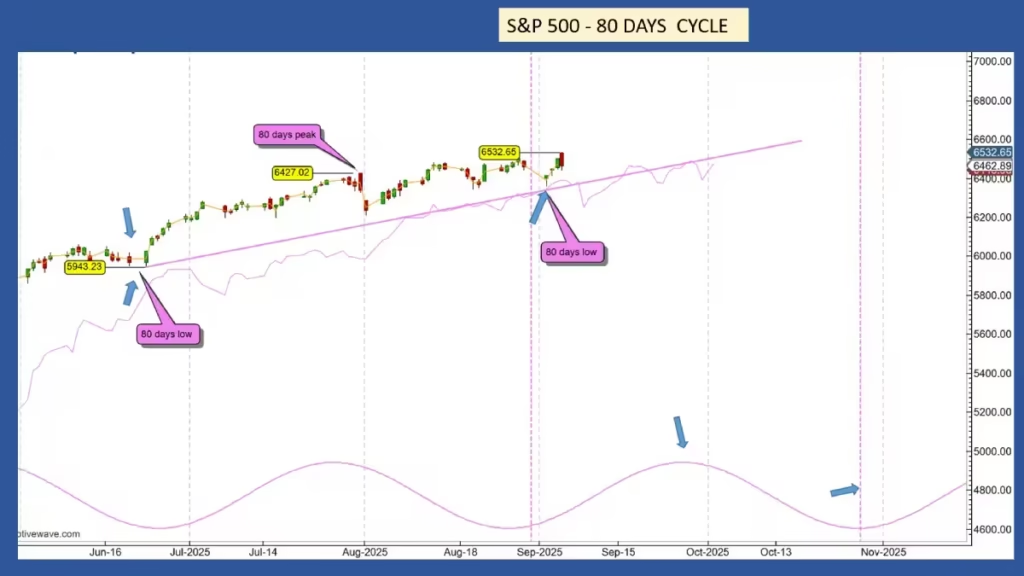
The 80-day cycle.
The last 80-day cycle low formed on June 23rd, and the next one is expected around now.
If the 80-day low occurred on September 2nd, then the next one is expected to form on November 9th, with the peak around October 6th.
Of course, if the 80-day cycle isn’t over yet and forms this week, we’ll need to recalculate the potential dates.
I personally believe the September 2nd low is the 80-day low.
The 80-day cycle provides lots of information about how bullish the 40-week cycle is.
Let’s return for a few minutes to the 40-week cycle.
In a 40-week cycle, there are eight 80-day cycles.
The last 40-week cycle formed on April 6th.
According to market rules, in a bullish market, the first 80-day cycle should find support at its cycle line.
With a 5,943 low on June 23rd, the S&P 500 formed its low right on its cycle line, as expected.
During the second 80-day cycle low formation, technically the S&P 500 is supposed to drop below its cycle line, providing a potential downward target, which is usually the 40-day cycle line.
If the second 80-day cycle low is on September 2nd, the S&P 500 formed its low on the cycle line, which means there’s still good bullishness in the stock market.
Assuming the 80-day cycle has formed, the S&P 500 should now bounce back and move toward forming a new all-time high.
The 40-day cycle.
There’s a very high probability that the September 2nd low was the last 40-day cycle low.
In this case, the next one is scheduled for October 6th, shown by the blue dashed vertical line.
The peak can be expected around September 20th.
As explained in the 80-day cycle analysis, we can also use the 40-day cycle to calculate how bullish or bearish the 20-week cycle is.
In the present 20-week cycle which started on April 6th, 2025, each 40-day low formation happened on its cycle line.
Throughout the entire cycle, the S&P 500 never dropped below its cycle line, confirming the market is in a very bullish phase.
The next 40-day cycle should find support on its cycle line. If it drops sharply below its cycle line, this will be the first sign that some weakness is starting to come into the S&P 500.
Because the S&P 500 has been so bullish, we don’t have new upward or downward trading signals.
The success rate for the 40-day cycle is 100%.
During a bull trend like we’re witnessing, it’s not very easy to trade due to the lack of trading signals. For this reason, it’s better to trade shorter timeframes like the 20-day cycle or even the 10-day cycle.
Short-Term Trader Corner
Today, we’ll analyze the 20-day cycle and review the overall results of trading these cycles since January. The last trading signal from my previous update was successful, as the S&P 500 market reached a low of 6,212.69, just 31 points above its target of 6,191.
During that update, I anticipated that after forming its 20-day low, the market would break above its cycle line, providing an upside potential target in the estimated range of 6,550 to 6,528.
On August 12, the S&P 500 market crossed above its cycle line, indicating a potential upside target of 6,548.
With a new all-time high of 6,532.65 on September 5, the market was only 16 points away from its target, successfully reaching it.
The August 20-day low was anticipated to form on August 19, and the following day, August 20, the cycle was perfectly timed.
Consequently, the next one was expected to occur on September 5, forming three days early on September 2; once again, the market was very close to the target date.
Considering the September 2 low as the 20-day low, the next low is expected to form on September 18. We can anticipate the market to rise until September 10, which is the date of the 20-day cycle peak.
With 9 successful trading signals, the 20-day cycle has a 100% success rate.
Now, let’s see if a trader executed every signal since the beginning of the year. Given the success rate, we know each trade was successful, but let’s assign a monetary value to each transaction.
The 9 trades yielded a total profit of 1,371 points. Here’s the breakdown:
- Trade 1: 130 points
- Trade 2: 111 points
- Trade 3: 90 points
- Trade 4: 84 points
- Trade 5: 138 points
- Trade 6: 141 points
- Trade 7: 450 points
- Trade 8: 97 points
- Trade 9: 130 points
If trading the standard S&P 500 futures contract where 1 point equals $250, the profit is 1,371 x $250 = $342,750.00.
For the E-mini contract where 1 point equals $50, the profit is 1,371 x $50 = $68,550.00.
For the micro E-mini contract where 1 point equals $5, the profit is 1,371 x $5 = $6,855.00.
These results are based on trading only one contract and depend on each trader’s strategy. Please keep in mind that past performance does not guarantee future results.
Conclusion:
The S&P 500 market continues showing strong upward momentum, with multiple cycles supporting further gains toward the 7,321 target. While we expect some short-term corrections, the overall trend remains positive through early 2026. Smart investors should watch key support levels and prepare for potential opportunities during minor pullbacks. Remember, successful investing requires patience and understanding market patterns rather than trying to time every move perfectly.