

SP500: High Potential profits, discover the new Bullish Targets, SP500 July 7 2025 Update
Introduction
In my last update on the SP500, I mentioned the possibility of a new upside target if the SP 500 crosses above its 40-week cycle line. Let’s see what has happened since then.
The 18 Month Cycle
Let’s start with the 18-month cycle. Since last week, there hasn’t been much new information. We still expect the peak for this 18-month cycle to form around January 2026, with the low occurring between September and October 2026. The location of the 18-month cycle peak is crucial for anticipating the magnitude of the next correction.
According to Hurst’s time translation rules, when the market peaks before the cycle peak—on the left side of the cycle—we can expect a sharp correction, as the bulls may not be strong enough to sustain higher prices for an extended period. The size of the correction is proportional to the cycle length, an 18-month cycle correction will be sharper than an 80-day cycle correction. For more information on time translation rules, I recommend to read the article, at the beginning of this blog, you’ll find also numerous articles about Hurst’s various principles.
Conversely, when the market reaches its peak after the cycle peak—on the right side—we can anticipate a moderate correction, as the bulls are in control, driving the market higher for a longer time. Following the formation of the next 18-month cycle peak, the SP500 should technically cross below its cycle line, providing a downside target. The yellow uptrend line represents the 18-month cycle trend line, or what Hurst refers to as the VTL. When the SP500 crosses below it, this will confirm that the preceding higher peak was at least the 54-month cycle peak.

The 40-Week Cycle
Last week, I anticipated confirmation of the 40-week cycle crossing. I noted that if the SP500 trades above its cycle line with a bullish candle on Monday, we will confirm an upward target of 7,321. The crossing occurred at 6,078, yielding a potential profit of 1,223 points or 20%.
For this target to remain valid, the SP500 must not drop below its cycle line before reaching it. If it does, not only will the target become invalid, but it will also signal a bearish trend for the market.
Technically, we don’t expect the SP500 to fall below its cycle line before forming the second 40-week cycle low, following the last 18-month cycle low in April. If the previous analysis holds, we can expect the 7,123 target to represent the peak of the 18-month cycle. Given that there are two 40-week cycles within an 18-month cycle, we might reach the 7,321 target during the formation of the second 40-week cycle peak.
The next 40-week cycle peak is anticipated by the end of August, with the low expected by late December 2025 (as indicated by the blue dashed line). During this next low formation, the SP500 should ideally form its low on the cycle line; it’s still too early to determine the exact position of the cycle lines.
Once the next 40-week cycle low is confirmed, I will draw the trend line (VTL). When the market crosses below it, we can identify the next 18-month cycle peak and anticipate the upcoming correction. Close monitoring of this 40-week cycle line is crucial, as well as the point of the 40-week cycle peak. If the peak occurs before August and the market dips below its cycle line during the low formation, the 7,321 target may be at risk.
So far, with only one trading signal this year, the 40-week cycle has a success rate of 100%. The second signal was issued last week, but since the cycle is not complete and the target remains valid, it remains open.

The 20-Week Cycle
During the week of May 11, the SP500 crossed above its cycle line at 5,847, establishing an upside target of 6,859—a potential rally of 1,000 points or 17%. Last Thursday, July 3, the SP500 reached a new all-time high at 6,284.65. The current 20-week cycle peak, expected to form around June 15 (three weeks ago), is positive for the market. Everything is aligned for the peak formation to occur at the correct point in the cycle, with a low anticipated by the end of August. We can expect a moderate correction to form on its cycle line or even above, depending on the level of bullishness.
We can anticipate the next 20-week peak formation by analyzing the lower time frame, the 80-day cycle.
When the 20-week cycle is confirmed, I will draw the 20-week VTL, which will help us identify the next 40-week cycle peak. Until the SP500 crosses below its 20-week cycle line, the 6,859 target remains valid. If it drops below this line before reaching the target, it will invalidate the target and signal a bearish trend.
Since the beginning of the year, the 20-week cycle has a success rate of 100%.

The 80-Day Cycle
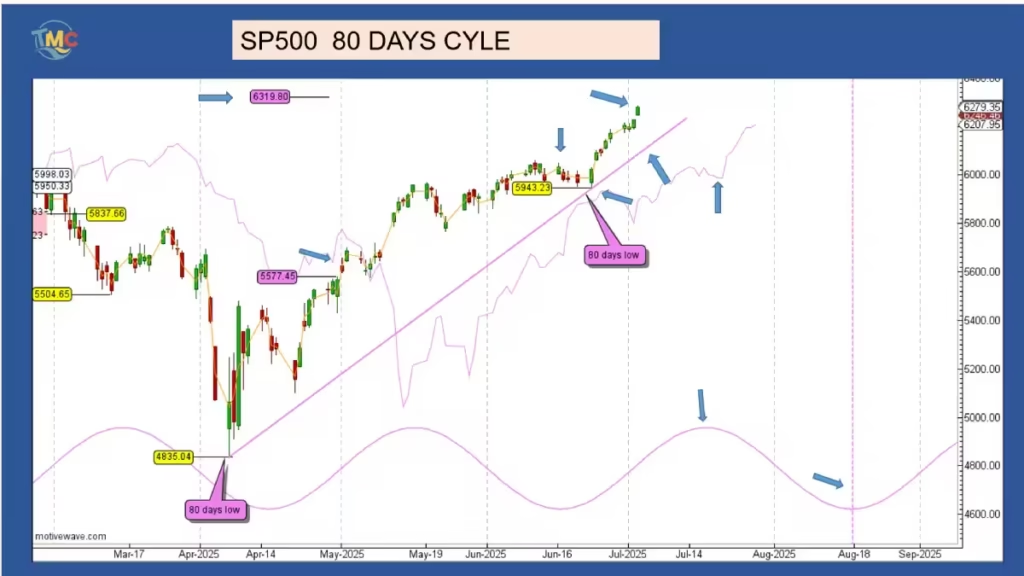
As mentioned in last week’s update, the last SP500 80-day cycle peak formed on June 11 at 6,059, with a low on June 23 at 5,943.23. As expected, the SP500 formed its low on its cycle line. The peak for this new 80-day cycle is expected on July 27, with the low on August 30 (indicated by the purple vertical dashed line). During the next 80-day cycle low formation, the S&P 500 should cross below its cycle line.
Following the confirmation of the June 23 80-day cycle low, I drew the 80-day cycle trend line (the purple line). When the SP500 crosses below this line, it will confirm the 80-day cycle peak and, more importantly, the potential 20-week cycle peak.
On May 1, the SP500 crossed above its cycle line at 5,577, establishing an upside target of 6,319, a new all-time high—742 points or 13% potential profit. Last Thursday, the SP500 hit a new all-time high at 6,284.65, just 35 points (0.56%) below its target; the target is considered met.
With five signals since the start of the year and four successful trades, the success rate for the 80-day cycle is 80%.
The 40-Day Cycle
The last trading signal for the 40-day cycle occurred on May 1, when the SP500 crossed above its cycle line at 5,536, targeting 6,237—a potential profit of 701 points or 12.66%. With last Thursday’s new all-time high at 6,284.65, the market met and exceeded the target by 47 points. For traders who took this trade, the profit was 701 points, or just over 12%.
The blue trend line represents the 40-day cycle trend line. When the market crosses below it, this will confirm that the next 80-day cycle peak has formed or is in formation. We expect the next 40-day cycle low to form on July 27, at which point the SP500 should cross below its cycle line, providing a downside target. For potential targets when the SP500 crosses below its cycle line during the next 40-day low formation, I recommend reviewing my last week’s update.
Since the beginning of the year, the 40-day cycle has provided three successful signals out of three, resulting in a 100% success rate.

For Short-Term Traders: Analysis of the 20-Day and 10-Day Cycles
The 20-Day Cycle
In the context of the 20-day cycle, the market exhibits considerable bullish sentiment, making it challenging for the S&P 500 to generate new trading signals.
For active traders, it may be more advantageous to focus on the shorter 10-day cycle.
Since the last trading signal on April 21, when the S&P 500 crossed above its cycle line at 5286.92, targeting an upside of 5738.80, traders have seen a profit of 451.88 points or 8.55%.
The S&P 500 continues to ascend, with the next 20-day cycle expected to reach its low on July 10, as indicated by the vertical green dashed line.
A peak for this cycle should materialize soon.
Since the beginning of the year, the 20-day cycle has provided seven trading signals, all of which have been positive, resulting in a 100% success rate.

The 10-Day Cycle
After reaching a high of 6059.40 on June 11, the S&P 500 dipped below its cycle line at 6005.62, targeting a downside of 5951.84 or a potential profit of 0.90%.
On June 23, the market hit a low of 5943.23, achieving its target.
The following day, the market crossed back above its cycle line at 6019.34, triggering an upside target of 6095.45.
The S&P 500 met this target two days later, on June 26. Since then, the market has established its latest 10-day cycle on July 1 and continues to rise, setting new records with each trading day.
The next low for the 10-day cycle is anticipated between July 8 and 10. Typically, when forming a low, the market is expected to cross below its cycle line, indicating a downside target.
However, due to the significant bullish momentum, there is a possibility that the market may only find support at this line.
Since January, the 10-day cycle has provided eleven trading signals, all positive, maintaining a 100% success rate.

Conclusion
By analyzing the SP500’s 40-week, 20-week, and 80-day cycles and lower time frame, traders can identify key targets and potential reversals.
The next key targets are 6,859 for the 20 week cycle, and 7,321 for the 40 week cycle.
Monitoring crucial cycle lines helps validate bullish scenarios, while timely signals indicate market corrections. Understanding these cycles enhances trading strategies and maximizes profit potential in an ever-evolving market landscape.