

S&P 500 Weekly Market Analysis: Cycle Trends and Forecasts - March 31, 2025
10-Day Cycle Evaluation
The latest 10-day cycle low formed on March 13. Following this low, the S&P 500 crossed above its cycle line at 5631.57, establishing an upside target of 5758.49. On March 25, the index reached 5786.95, not only meeting this target but also marking the 20-day cycle peak.
As anticipated, during the second 10-day cycle low formation, the S&P 500 crossed below its cycle lineFuture Line Of Demarcation on March 28 at 5669.37, projecting a downside target of 5552.
This target requires close monitoring on Monday, as reaching it would indicate the 20-day low formed below its cycle line—typically a bearish signal.
After establishing the next 10-day cycle low, the index should theoretically cross above its cycle line and generate a new upside target.

20-Day Cycle Analysis
I will skip the 20 day cycles analysis, since you can follow the same analysis on the 80 day cycle roadmap. It’s important to note whether Friday, March 28 was the 20 day low. We should carefully observe Monday’s market reaction.

40-Day Cycle Perspective
The most recent 40-day low occurred on March 13.
The subsequent rally encountered resistance at the cycle line before resuming its decline. We anticipate the next 40-day low around April 16 (indicated by the blue vertical dashed line).

80-Day Cycle Analysis
On March 13, the S&P 500 formed its third 80-day cycle within the current 18-month cycle. This 80-day cycle lasted 77 days—9 days longer than the Hurst nominal model’s 68-day average, confirming a downtrend.
In bearish markets, cycles typically extend longer than during bullish phases.
This 80-day cycle peaked in its right portion (purple arrow).
As this represents the fourth and final 80-day cycle of the 18-month cycle, the next peak should theoretically form in the left portion, near its cycle line without crossing above it.
We expect resistance followed by a decline into the 18-month cycle low around May 29 or early June.
If the S&P 500 sharply crosses above its 80-day cycle line, we may need to reconsider the March 13 low classification. While certainly an 80-day cycle low, it could potentially mark the 18-month cycle low under such circumstances.

S&P 500 Weekly Market Analysis:Current Roadmap
After establishing the new 80-day cycle on March 13, the S&P 500 crossed above its cycle line on March 24 at 5,642.92, generating a target of 5,781.27 (representing 138.31 points or 2.45% potential gain). The 20-day cycle peaked on March 25 at 5,786.95.
The index has begun correcting toward its next 20-day low, expected Monday, March 31. During this formation, the S&P 500 should find support at its cycle line before rebounding toward the 40-day cycle peak. Following that peak, the index will likely cross below its cycle line, providing a downside target for the 40-day cycle low around April 16 (±2 days).
Technically, the S&P 500 should then cross above its cycle line toward the 80-day cycle peak, with the crossing providing an upside target. However, being in the final 80-day cycle of this 18-month cycle, the market may not reach this target or even cross above its cycle line.
After the 80-day cycle peak forms in the left portion, the S&P 500 will likely resume its decline. Before reaching the next 80-day cycle low, the index should establish an initial low in early May, rebound using the cycle line as resistance, then decline to form a low around 5,446.96 or lower by May 29.
Currently, we have one successful and one unsuccessful trading signal, making the success rate 50%

S&P 500 Weekly Market Analysis:Long-Term Outlook
By late May, we should determine whether the S&P 500 is entering bear market territory or remains in a bull market,
Depending on where the 18-month cycle forms, this will confirm whether the bull market remains intact or if we’re in a longer 54-month cycle.
If our long-term analysis is correct, the S&P 500 should limit its correction at the 18-month cycle line, approximately 5,385 by late May or early June.
A sharp cross below this line would indicate with high confidence that the bull market has ended, potentially targeting 4625 (a 14% decline) and necessitating a shift to a bearish scenario.
As previously noted, we should maintain dual scenarios:
– If the S&P 500 rebounds sharply after forming a low near its cycle line, the bull market remains viable
– Any summer crossings below the 18-month cycle line would warn of further potential decline.
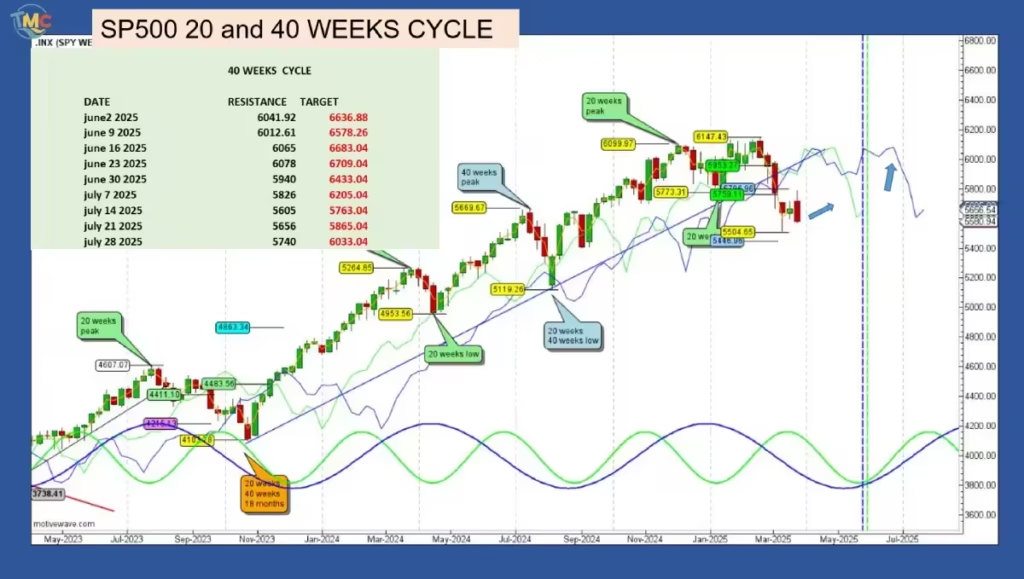
Here the 18 months cycle line table, with the potential downside target, if the SP500 cross below them during the summer time.
If the 18-month cycle forms as expected at the end of May and aligns with its cycle line, does this mean the S&P 500 will reach a new all-time high during the rebound following the cycle low formation?
Not necessarily—it all depends on when and where the S&P 500 crosses above its 20-week and then its 40-week cycle lines.
For the 20-week cycle line, it is still too early to determine its exact position after the week of May 27. On that date, the 20-week cycle line is projected to be at 5,740. Assuming the 18-month cycle low forms at 5,446.96, the potential upside target would be 6,034.
Below is the 40-week cycle line table with potential targets for the next two months.
As a reminder, if the S&P 500 forms a lower or higher low than 5,446.96, the target will be recalculated based on Hurst cycle analysis.
As mentioned in my previous update, it is very unlikely that the S&P 500 will make a new all-time high before summer. To anticipate such a move, the index would need to cross above both its 20-week and 40-week cycle lines.
Additionally, for a signal to be valid, it is triggered when the median price crosses the cycle line, not just any part of the chart.

S&P 500 Weekly Market Analysis: the 18-Month Cycle Roadmap
For the 18-month cycle roadmap, we use the 20-week cycle line as a reference. The starting point is where the last 18-month cycle formed a low, which occurred in October 2023.
From that point, as expected, the first 20-week cycle found support at its cycle line at 4,953 in April 2024. The S&P 500 then rebounded, forming a 40-week cycle peak at 5,669.67 in July 2024.
During the second 20-week cycle and the first 40-week cycle, as expected, the S&P 500 crossed below its cycle line, setting a downside target of 4,939 in August 2024. However, the 40-week low at 5,119.26 missed this target, which was a bullish signal. The S&P 500 then crossed back above its cycle line, reaching and exceeding a new upside target.
After forming its third 20-week peak in December 2024, the S&P 500 continued trading along its cycle line, eventually forming its third 20-week low on January 13, 2025. The index then crossed below its cycle line again, fulfilling a previously set downside target.
At the time of this update, this is where we currently stand.

Conclusion
We are in the final phase of this 18-month cycle with a target zone between 5,446.96 (40-week target) and 5,385 (18-month cycle line). We must remain cognizant of the possibility of a higher-degree timeframe cycle formation, such as the 54-month cycle, which would portend further decline.