

“S&P 500 Cycle Analysis November /3/ 2025 – 6920 All-Time High, 7321 Target, Market Correction Forecast”
Introduction
Welcome to this week’s S&P 500 analysis covering the period ending October 30, 2025. In this article, we’ll explore where the market stands using cycle analysis, a proven method that helps predict future price movements. The S&P 500 recently hit new all-time highs, but what comes next? We’ll examine multiple time cycles from 18 months down to 20 days to understand the market’s direction. Whether you’re a beginner or experienced trader, this analysis will help you understand potential support and resistance levels, timing for corrections, and future price targets using systematic cycle methodology.
I write this article on Thursday, October 30, after the closing bell. With a high of 6,877.28 on October 27, the S&P 500 index reached its 6,859 twenty-week cycle target. Is the S&P 500 now heading toward the next upside target of 7,321? Let’s explore what we can expect in the near future.
The 18-Month Cycle Analysis
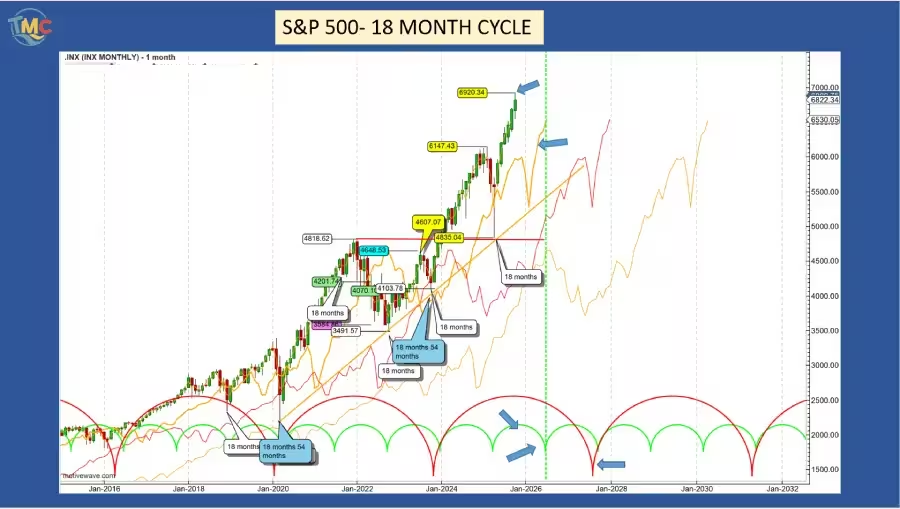
With a high of 6,920.34 on October 29, the S&P 500 index reached a new all-time high. For this week’s update, we’re using the first scenario from my previous analysis.
Theoretically, the peak for this 18-month cycle is still expected between January and February 2026, with the low occurring in October 2026. We’re currently in the second 18-month cycle within the larger 54-month cycle. We can expect the low for this 18-month cycle to form at least at its cycle line (the yellow line on the chart).
The 40-Week Cycle Analysis
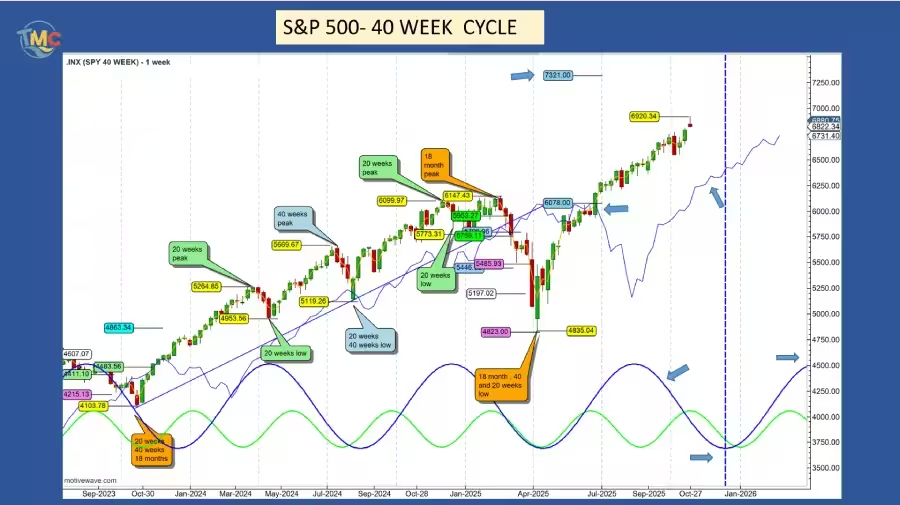
The S&P 500 is 401 points or 5.47% away from its 7,321 target, which was triggered in June when the index crossed above its cycle line at 6,078. The peak for this 40-week cycle was expected in September, but due to the strong bullish trend, this peak will form on the right side of the cycle, suggesting the next correction should be mild.
The 40-week cycle low is expected in January. Since this is the first 40-week cycle since the major April low, we expect the S&P 500 to find support at its cycle line. The cycle line at the end of January 2026 will be around 6,500.
After forming its low, we expect the S&P 500 to rebound and rally toward the second 40-week cycle peak, which should also be the 18-month cycle peak. If the bullish trend continues with the same strength, the next 40-week peak may form in May 2026. The second 40-week cycle low is expected between September and October 2026. According to Hurst’s rule of synchronicity, this low will also be the 18-month cycle low. More precise timing will be available later using shorter time frame cycles.
The 20-Week Cycle Analysis
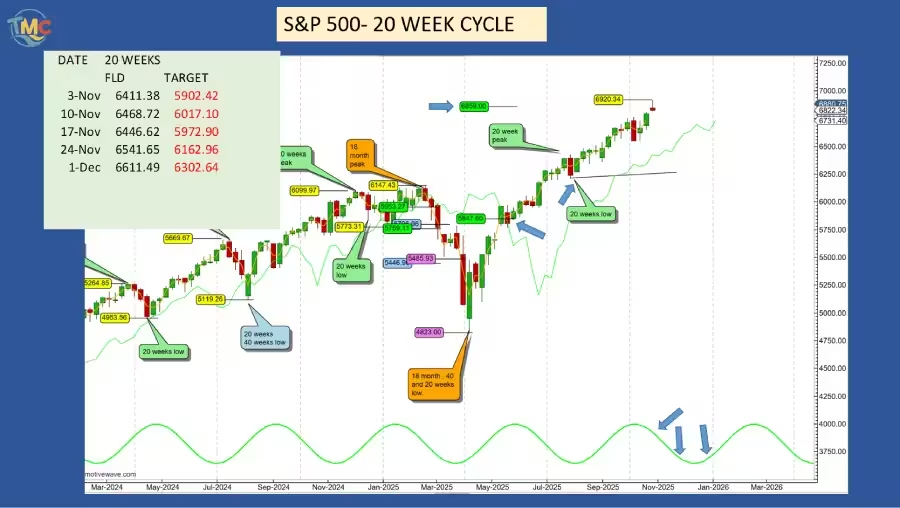
The last 20-week cycle formed its low on July 28. Last week, the S&P 500 index reached its 6,859 target triggered during the May 11 week. The last 20-week cycle had a length of 16 weeks, 3.5 weeks shorter than Hurst’s nominal model average of 19.5 weeks. In bull markets, cycles commonly run shorter than normal.
We can expect the next 20-week cycle to have similar length to the first one. In this case, the next 20-week low would form during the November 17 week. However, to respect Hurst’s nominal average, it’s common for one cycle to be shorter and another longer within the same period, averaging 19 weeks.
To maintain the 19-week average, the next 20-week cycle could have a length of 23 weeks. In this scenario, the second 20-week low would form during the week of January 5, 2026. Since the second 20-week cycle low will coincide with the 40-week cycle low, the length of the second 20-week cycle will affect the 40-week cycle length.
We’ll watch carefully where this second 20-week cycle peaks. If it has the same length as the first cycle, and since the last low formed 13 weeks ago, we should expect the S&P 500 to start correcting now, lasting about three weeks and forming its low at the 40-week cycle line. If the current 20-week cycle extends to 23 weeks, last week’s S&P 500 peak formed at the cycle’s peak. If the index continues moving up for the next few weeks, the 20-week cycle will peak on the right side of the cycle.
In both cases, technically, the S&P 500 should cross below its cycle line and form its low at the 40-week cycle line.
Here are the cycle lines and their potential targets for the next five weeks. If the S&P 500 makes new all-time highs before crossing below its cycle line, targets will be recalculated according to Hurst rules.
The 80-Day Cycle Analysis
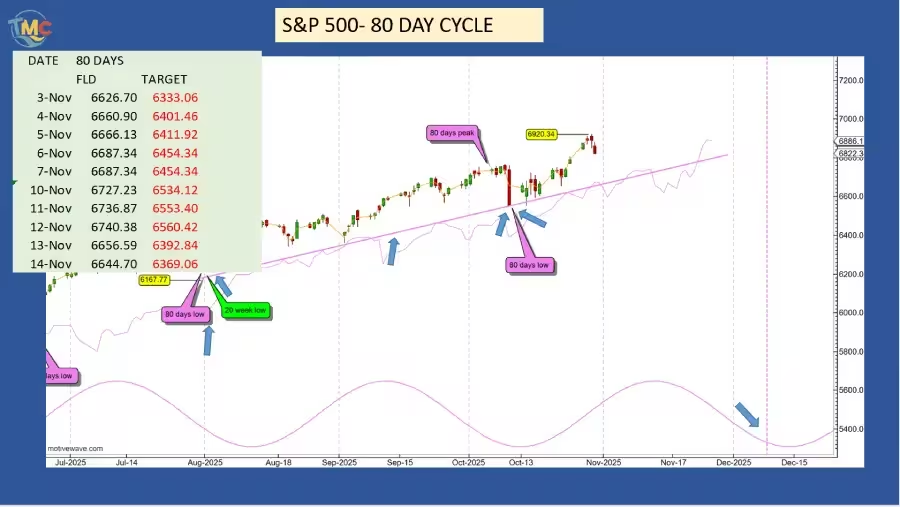
Since the major July 28 low marking the 20-week cycle, we’ve had one 80-day cycle. As expected after a major low, the first cycle formed its low on its cycle line on October 10. The first 80-day cycle had a length of 70 days, two days longer than Hurst’s nominal model discovered 50 years ago.
If the second 80-day cycle follows Hurst’s nominal model, the next low is scheduled for December 17. Since the second 20-week cycle starts its down phase during the next low formation, technically the S&P 500 should cross below its cycle line, providing a downside target.
Here are the cycle lines for the next 10 trading days and their potential downside targets if the S&P 500 crosses below them. The purple uptrend line drawn from the last 20-week low to the October 10 low represents the 80-day cycle trend line (VTL). When the S&P 500 crosses below it, this will confirm not only that the 80-day cycle has peaked, but also that the 20-week cycle peak has formed or is forming.
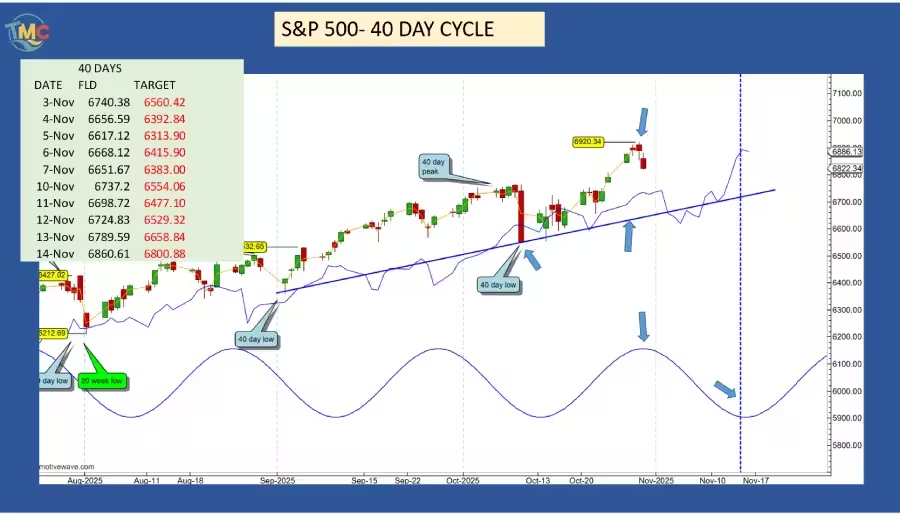
The 40-Day Cycle Analysis
The last 40-day cycle formed its low on October 10. The S&P 500 formed its low on its cycle line. Technically, during the second cycle after a major low on July 28, the S&P 500 should cross below its cycle line and provide a downside target. Due to the amount of bullishness, the S&P 500 formed its low right on its cycle line.
The next 40-day low should form on November 17 (the blue vertical dashed line) and should cross below its cycle line. Here are the cycle lines for the next 14 trading days and their potential targets if the S&P 500 crosses below them.
Adding 19 days from October 10 low gives October 29 as a potential date for the 40-day peak.
On October 29, the S&P 500 made a historic new all-time high at 6,920.34. If that’s the peak, then the S&P 500 peaked right at the cycle peak.
Is October 29 the 40-day peak? We’ll determine this by analyzing the next shorter cycle, the 20-day cycle.
The blue uptrend line is the 40-day VTL, which will be used to identify the next 80-day cycle peak. When the S&P 500 crosses below it, this will confirm the 80-day cycle peak has formed or is forming.
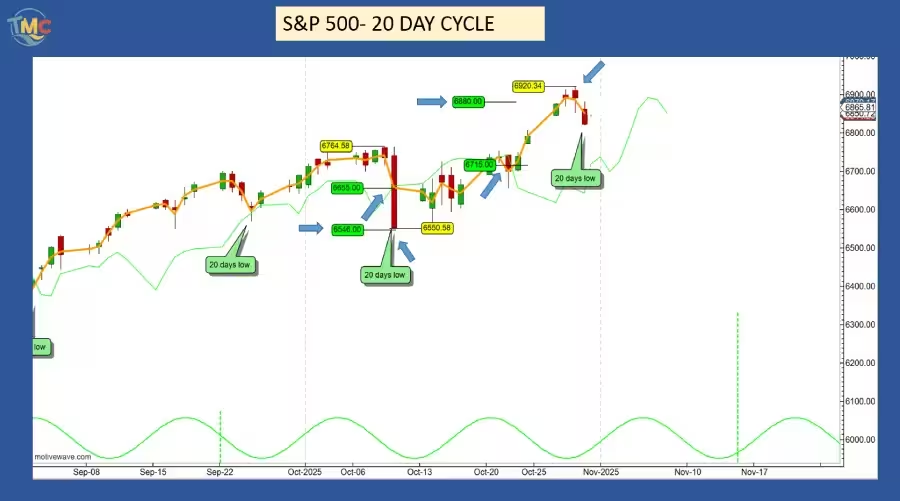
The 20-Day Cycle Analysis
Due to a very strong upward trend, the 20-day cycle hasn’t given any trading signals for a very long time – specifically since mid-April.
The first trading signal since that date was a sell signal when the S&P 500 index dropped below its cycle line at 6,655 on October 10th. This signal suggested a potential downward target of 6,546, and on the same day the market reached a low of 6,550, missing the target by only 4 points.
This target was perfectly achieved.
To take advantage of this trade, it was necessary to use the 10-day cycle or even the 5-day cycle.
The next trading signal was a buy signal, when the S&P 500 crossed above its cycle line at 6,715 on October 23rd, suggesting a potential upward target of 6,880 with 165 points or 2.45% potential profit.
On October 27th, 4 days later, the S&P 500 reached a high of 6,877, again perfectly meeting its 6,880 target.
On October 29th, the S&P 500 made a new historic high of 6,920.34, before declining on its way to form the 20-day cycle low.
The next 20-day low is expected on November 18th, shown by the vertical dashed line as the time target.
During the formation of the next 20-day cycle low, the market should cross below its cycle line and provide a potential downward target.
Conclusion
The S&P 500’s cycle analysis reveals we’re at a critical juncture. With new all-time highs achieved, multiple cycles suggest a correction is approaching in the coming weeks. The key levels to watch are the cycle support lines, particularly around 6,500 for January 2026. While the overall trend remains bullish with targets pointing to 7,321, near-term weakness is expected. Remember, cycle analysis provides probabilities, not certainties. Always use proper risk management and consider multiple factors before making trading decisions.