
S&P 500 Cycle Analysis 2026:
40-Week Cycle Forecast, 7,321 Target & Trading Signals | Hurst Cycles
Introduction
During my last 2025 update, I presented two possible scenarios for the weekly cycles.
The first scenario suggests the 40-week cycle already formed its low on November 21, 2025.
The second scenario indicates the 40-week low is still ahead of us.
Let’s examine if the market provides more clues about which scenario is most likely and explore the different trading implications for each.
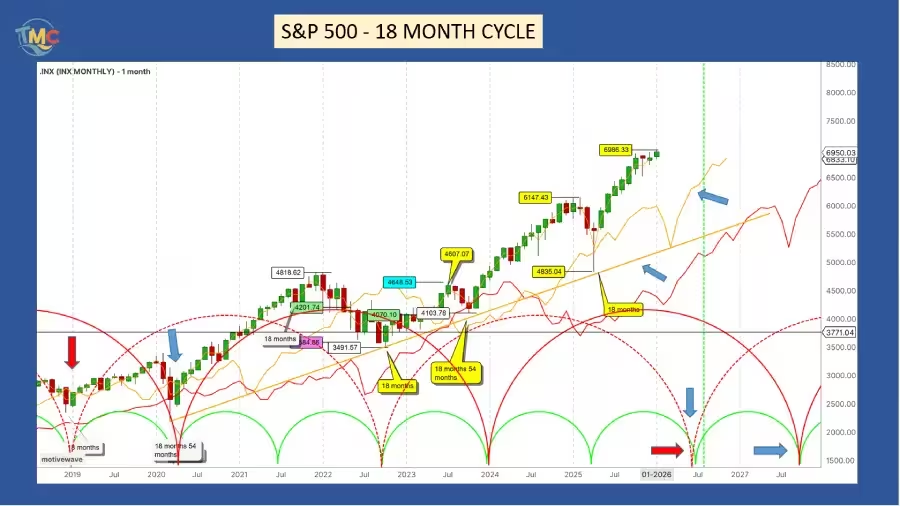
The 18-Month Cycle
On the long-term picture, there isn’t much to add from my last update.
The S&P 500 remains in a bullish trend and continues trading well above its cycle line (the FLD) and its cycle trend line (the VTL).
The low for this cycle is expected between September and October 2026.
Where the S&P 500 forms relative to its cycle line will provide important information—a crossing below will offer a potential downside target.
A crossing below its cycle trend line (the VTL) will likely signal a new bear market may be developing, certainly on its way to forming its 54-month cycle.
This will give a clearer picture about where to place the last 54-month cycle low.
A crossing below the VTL will confirm the previous 54-month cycle formed its low in 2018 (shown as the semi-circle dotted line on the bottom of the chart) and will form its next low between September and October 2026.
Otherwise, if the market meets its VTL and rebounds strongly, the best option will be that the previous 54-month cycle occurred in 2020, and the next one will form between September and October 2027.
We can estimate the peak for this 18-month cycle to form between February and March.
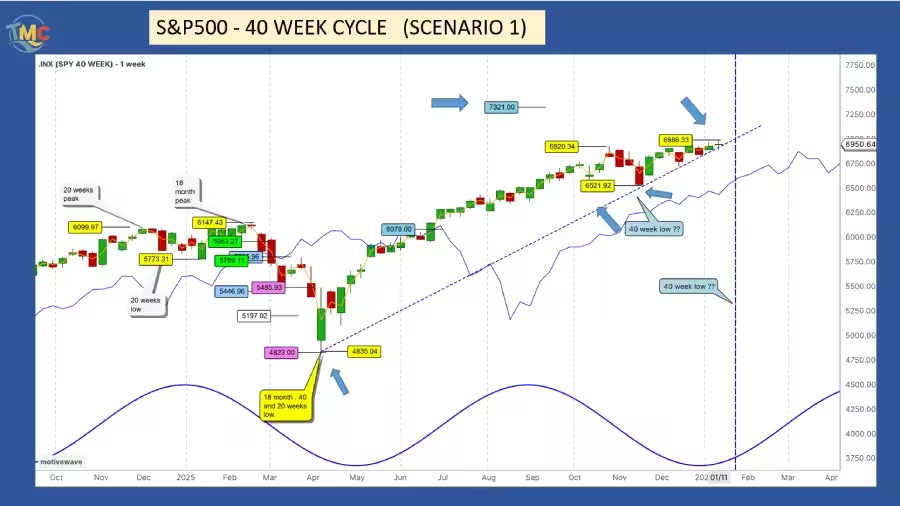
The 40-Week Cycle
With the January 12 high of 6,986.33, the S&P 500 is only 335 points or 4.57% below its 7,321 target.
This target remains valid until the S&P 500 crosses below its cycle line.
The only way to invalidate this target is for the market to cross below its cycle line before reaching it.
Let’s explore both scenarios for this 40-week cycle.
With the first scenario, if the 40-week low occurred on November 21, the cycle would be 32 weeks long from the April 2025 major low to the November 21 low.
This is almost 7 weeks shorter than the Hurst nominal model of 38.97 weeks—32 weeks is short but not impossible.
If this is the case, we would expect a strong rally after a 40-week cycle low, which hasn’t really materialized.
Also, after the 40-week low formed, I drew the 40-week cycle trendline. When the S&P 500 crosses below it, this will confirm the 18-month cycle peak has formed or is forming.
As we can see on the chart, the S&P 500 is trading along this VTL, which is not a very bullish sign.
If it crosses below, this will confirm a possible early 18-month cycle peak, which would be bearish for the market.
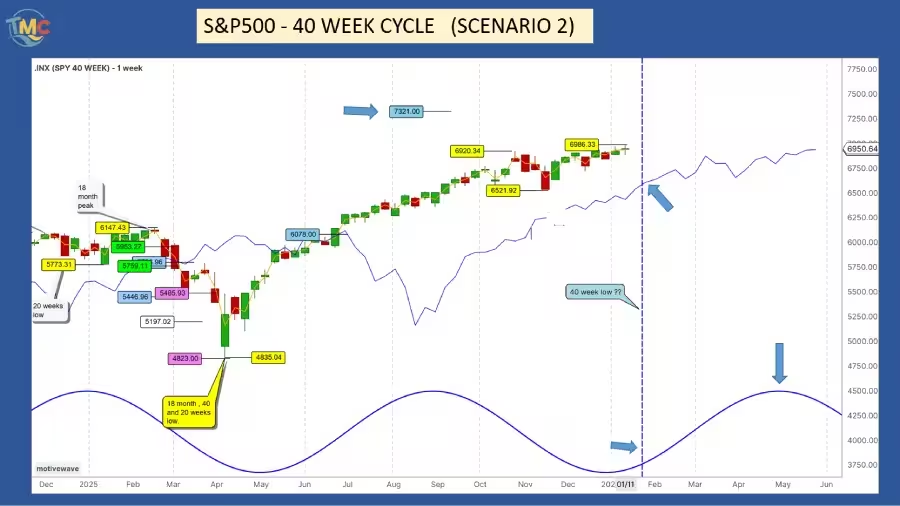
The Second Scenario
The second option is that the 40-week cycle low is ahead of us and will form during the last week of January.
The S&P 500 should decline to at least its cycle line.
After forming its low, the S&P 500 should rebound sharply on its way to forming the second 40-week cycle peak and, at the same time, the 18-month peak.
A peak is not necessarily a new all-time high, but due to the success rate of the trading signals, I expect the S&P 500 will meet its 7,321 target.
If the S&P 500 doesn’t meet its target and crosses below its cycle line, this will signal significant bearishness entering the market.
With the first scenario, we must watch the S&P 500 and its VTL closely. With the second scenario, we can expect a short-term peak for now, and the next trend will be down.
For now, my preferred scenario is the second one, but I don’t completely discard the first one. We must keep in mind the possibility this scenario could be correct.
The 40-week and even the 20-week cycles are not crucial from a trading perspective but are very useful for identifying intermediate trends.
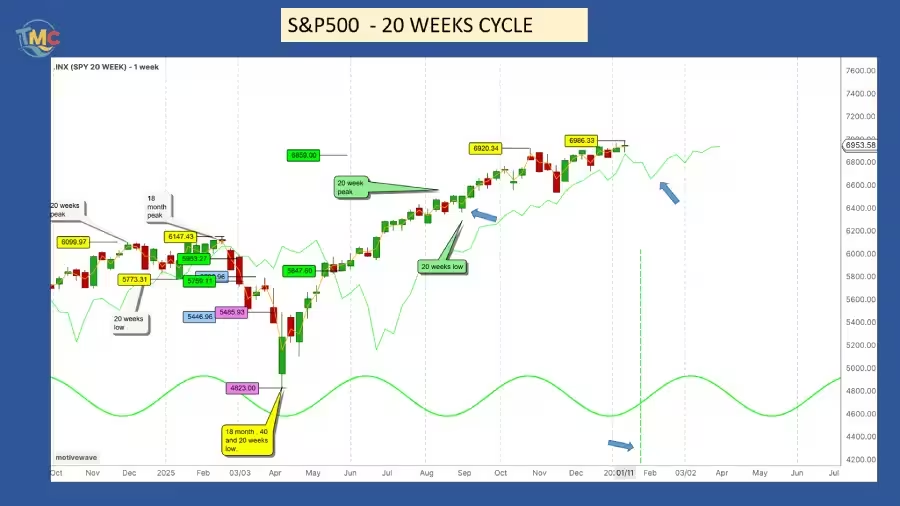
The 20-Week Cycle
For the 20-week cycle, I will use the second option to analyze the S&P 500.
Of course, as mentioned above, we must keep in mind the possibility the 20-week low formed in August 2025.
Assuming the 20-week cycle formed its low on September 2 with a 6,360.58 low, this first 20-week cycle lasted 21 weeks, compared to a 19.48-week average in the Hurst nominal model.
If the second cycle has the same length as the first one, the estimated time for this 20-week cycle to form its low will be the last week of January.
Technically, at this stage of the cycle, the S&P 500 should cross below its cycle line, providing a potential downside target.
The most likely scenario is the S&P 500 will find support at its 40-week cycle line or FLD.
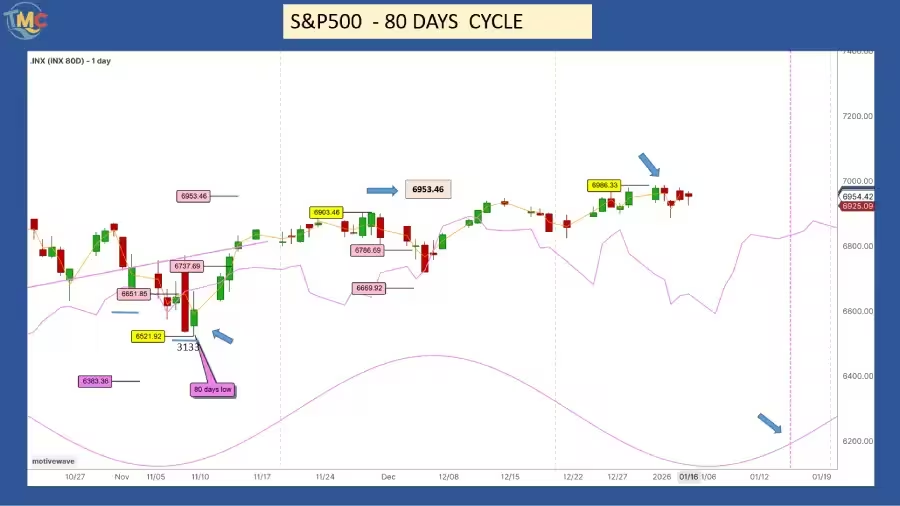
The 80-Day Cycle
Even though we have two different scenarios for the weekly cycles, the 80-day cycle is more obviously placed on November 21.
If that is correct, the next one is expected to form between the last week of January and the first week of February.
With the rule of synchronicity, it will also align with the 20-week and 40-week lows.
The S&P 500 should cross below its cycle line and provide a potential downside target.
If the S&P 500, during the formation of the current 80-day cycle, does not cross below its cycle line and rebounds strongly, this could validate the first option mentioned at the beginning of this analysis—that November 21 is the 40-week cycle low.
But for now, everything favors the next 40-week low forming by the end of January.
To validate this option, the S&P 500 must cross below its cycle line sharply.
The January 12 high of 6,986.33 is 33 points higher than the 6,953.46 target.
The S&P 500 met its target perfectly, proving once more the reliability of the trading signals that cycle analysis provides.
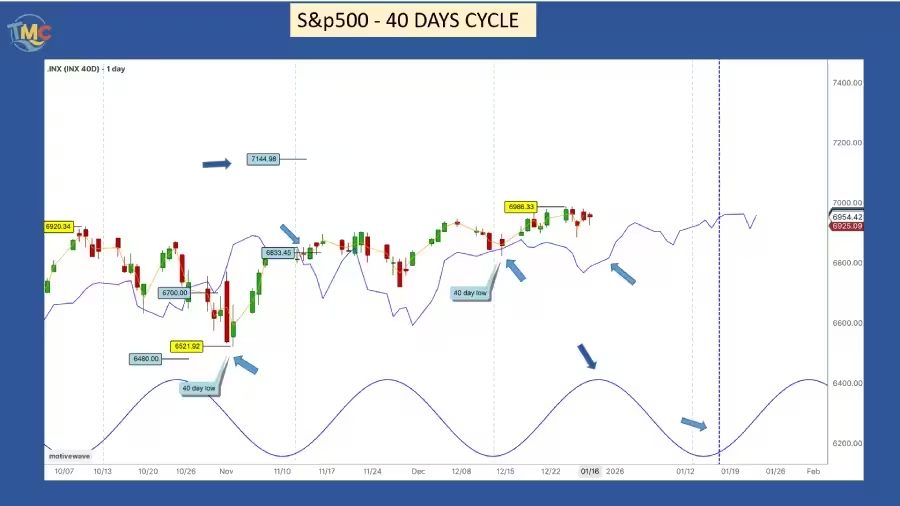
The 40-Day Cycle
The last two 40-day cycles were very easy to identify: the first one on November 21 and the second one on January 2 with a 6,824.31 low.
This last 40-day cycle has a length of 41 days, 7 days longer than the 34.1-day average from the Hurst nominal model and 8 days later than the expected December 25, 2025 date.
The next one is expected to form on February 5, and technically, since it’s the last one of the 20-week and 40-week cycles, it should cross below its cycle line.
On December 3, the S&P 500 crossed back above its cycle line at 6,833.45 and provided a 7,144.98 target, representing 311 dollars or 4.55% of potential profit.
Since the peak for this 40-day cycle can be expected around January 19, the S&P 500 still has time to reach its target before starting its correction.
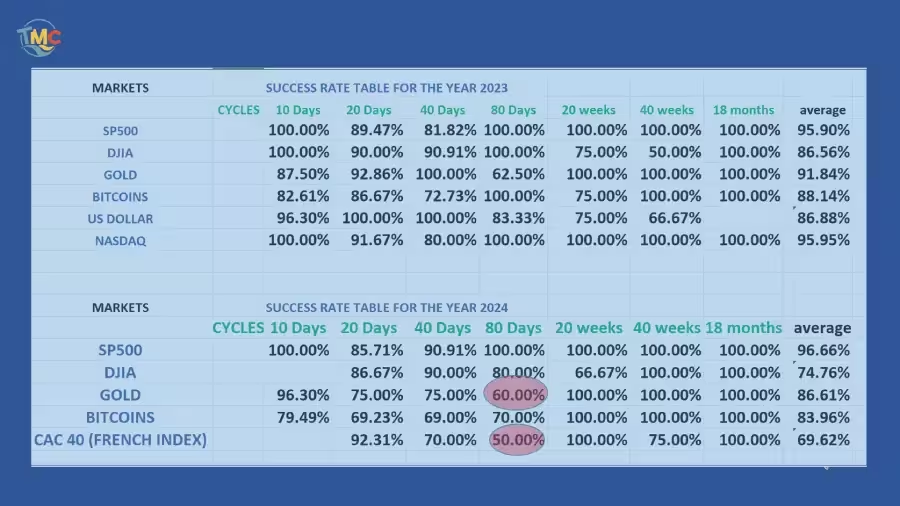
The Success Tables
I published the success table during my last weekly gold update, and I will continue publishing it until the end of January.
I’ve published it for the last 3 years.
I’ve shared tables showing how well different markets performed using my tracking method.
The tables demonstrate very high accuracy when trading various markets by following their cycles.
The success rate indicates how often the market reaches or exceeds its expected goal, which appears when the market moves above or below its cycle line or the FLD.
When using the various trading indicators to achieve great results, we need to consider whether the signal matches the overall trend direction.
In fact, it’s not recommended, except in special situations, to trade against the main trend.
This year, I chose to display the 2023, 2024, and 2025 tables together to demonstrate how reliable these successful signals have been over time.
On the table for each cycle, there are different cycles I track for each market.
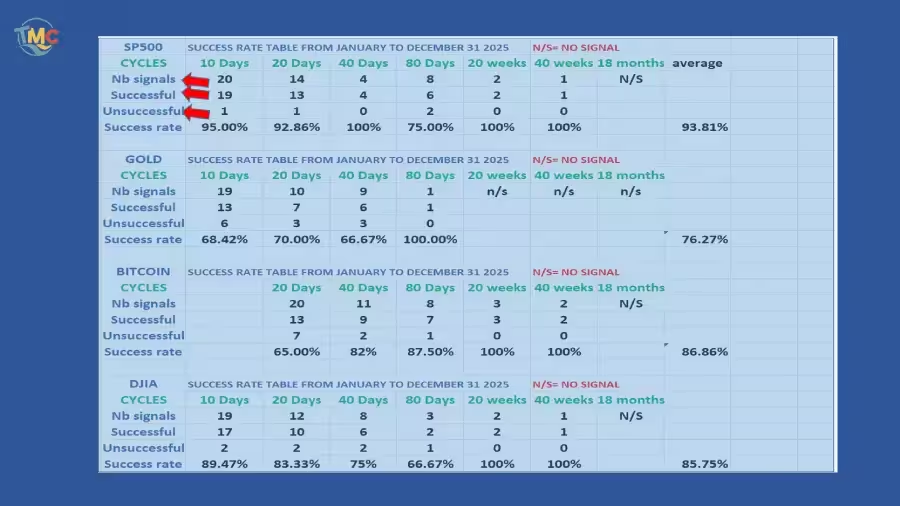
The 2025 Success Table
On this year’s 2025 table, I included more information.
You’ll see the total count of signals, the count of successful signals (meaning signals that reached or surpassed their goals), and the unsuccessful column shows how many times the market fell short of its goals.
For a goal to count as reached, the market needs to come within 1% of the target—I accept a 1% margin for error.
How should we use the table?
Traders can select which market to trade and which cycle to follow based on that cycle’s success rate.
Keep in mind that future results may not necessarily match past results, depending on each trader’s approach.
Conclusion
The S&P 500 currently presents two possible scenarios for its market cycles. My preferred scenario suggests the 40-week cycle low will form in late January, followed by a rebound toward the 7,321 target and an 18-month peak between February and March. However, we must remain vigilant about the alternative scenario where the 40-week low already occurred in November. The coming weeks will be critical as the market approaches key support levels. Traders should watch for the S&P 500 crossing below its cycle line, which will confirm the direction and provide valuable trading opportunities with clear downside targets.