

THE WAVE PERIOD IN CYCLES
THE WAVE PERIOD
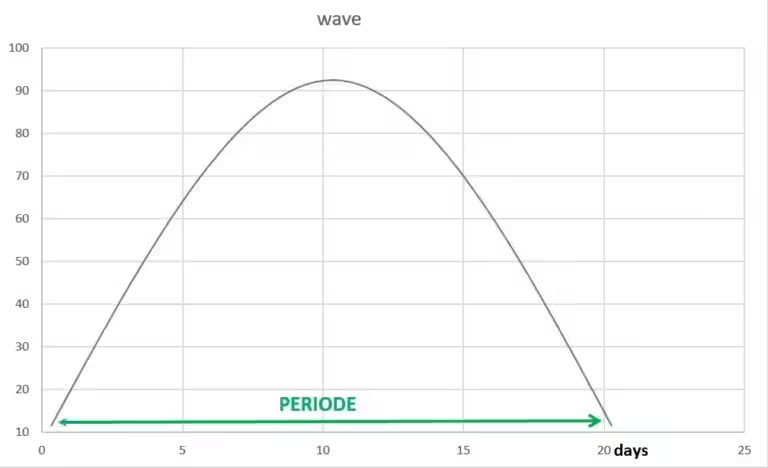
The period of a wave is the time span required to complete one full cycle of that wave.
Period is expressed in units of time, such as minutes, hours, days, weeks, month’s even years.
In the Hurst principle, there is 3 important concept related to the cycle period.
The Nominal cyclic model.
The synchronicity.
The principle of variation
The wave period is a fundamental concept in stock market cycles, representing the time taken for a complete cycle to unfold.
In trading market cycles, understanding wave periods is essential for timing market entries and exits effectively.
Characteristics of Wave Periods in Stock Market Cycles
Variability:
Wave periods in stock market cycles can range from extremely short (intraday cycles) to very long (multi-year or even multi-decade cycles). This variability allows traders to analyze trading market cycles across different time frames.
Measurement Methods:
In trading market cycles, periods are typically measured in trading days, weeks, or months. For longer-term stock market cycles, years may be used as the unit of measurement.
Importance in Trading:
Understanding wave periods is crucial for timing entries and exits in trading market cycles. Traders who can accurately identify cycle lengths can position themselves to take advantage of cyclical market movements.
Fractal Nature:
Stock market cycles exhibit a fractal nature, meaning similar patterns can be observed across different time scales. This self-similarity in trading market cycles allows traders to apply similar analytical techniques across various timeframes.
Interaction of Multiple Periods:
In real-world stock market cycles, multiple wave periods of different lengths are constantly interacting. Understanding these interactions is key to comprehensive trading market cycles analysis.
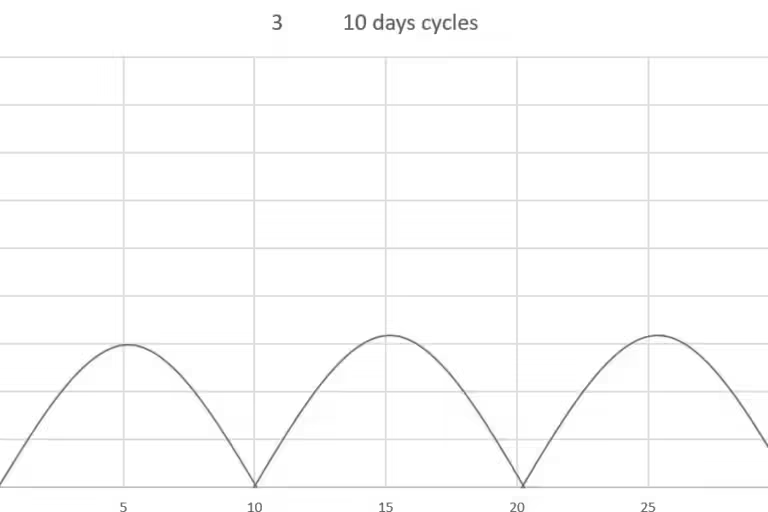
Below some charts representing some different periods.
THE NOMINAL CYCIC MODEL IN STOCK MARKET.
J.M. Hurst’s Nominal Cyclic Model provides a structured framework for understanding the hierarchical nature of stock market cycles. This model is fundamental to advanced analysis of trading market cycles.
The nominal model contains all of the waves that are normally required in order to make trading decision.
Very important precision to remember, the daily cycle’s length are in calendar days and not in trading days.
Key Aspects of the Nominal Cyclic Model:
Cycle Hierarchy:
The model identifies a series of cycles in stock market cycles, typically ranging from 5 days to 18 years.
This hierarchy allows traders to understand how different timeframes interact in trading market cycles.
2:1 Ratio:
A critical feature of this model is that most adjacent cycles have a 2:1 period ratio. For example, in stock market cycles, a 40-day cycle is typically followed by a 20-day cycle, then a 10-day cycle, and so on.
The 3:1 Exception:
Uniquely in this model of stock market cycles, the ratio between the 18-month and 54-month cycles is 3:1. This exception adds complexity to long-term trading market cycles analysis.
Composite Wave Theory:
In the Nominal Cyclic Model, price movements in stock market cycles are viewed as a sum of various cyclic components. This composite nature of market movements is crucial for understanding complex trading market cycles.
Practical Application:
Traders use this model to identify potential turning points in trading market cycles. By understanding where different cycles might align, traders can anticipate significant market moves.
Adaptability:
While the model provides a structured view of stock market cycles, it’s important to note that real-world markets don’t always conform perfectly to this idealized structure. Successful traders adapt the model to current market conditions.

THE SYNCHRONICITY
Synchronicity Principle in the stoc market
It is a very important concept to understand, this will help to identify the important turning points.
The synchronicity means to occur simultaneously in time.
In cyclic theory the term refers to the tendency of the troughs of one component wave to occur at the same time as the troughs of other component waves in the same composite wave.
Cycles tend to synchronize at certain points in time, leading to significant market turning points.
Synchronicity is a key concept in stock market cycles, referring to the tendency of different cycles to align at certain points, creating significant market moves. Understanding synchronicity is crucial for anticipating major shifts in trading market cycles.
Deeper Insights into Synchronicity:
Trough Alignment:
In stock market cycles, synchronicity often occurs at cycle lows rather than highs. This tendency can create powerful bullish moves when multiple cycles bottom simultaneously.
Magnified Effects:
When multiple cycles synchronize in trading market cycles, it can lead to major trend changes. The combined energy of multiple cycles turning at once can create significant market momentum.
Predictive Power:
Understanding synchronicity helps forecast potentially significant moves in stock market cycles. Traders who can identify points of synchronicity gain a valuable edge in predicting market direction.
Market-Specific Patterns:
Different markets may have different synchronicity patterns in their trading market cycles.
For example, stock markets might tend to synchronize at lows, while other markets like gold might alternate between synchronizing at highs and lows.
Complex Interactions:
The interplay of synchronized cycles can create complex patterns in stock market cycles. These interactions can lead to nested cycles, where shorter cycles are embedded within longer ones, creating intricate trading market cycles structures.
Since the cycles are related to each other’s by a 2:1 ratio, the 20 days cycle is synchronize with the second 10 days cycle, the 40 days cycle with the second 20 days cycle and so on until the 18 months.
When the 20 weeks cycle end, all the lower time frame cycles
From the 5, 10, 20, 40 and 80 days cycles end.
The next move up will be very strong since 6 new cycles will start at the same time.
Psychological Impact:
Synchronicity in stock market cycles often coincides with extreme sentiment shifts in the market, making it a valuable tool for understanding market psychology.
Below an 80 days cycle chart

THE PRINCIPLE OF VARIATION
The Principle of Variation acknowledges that cycles in stock market cycles are not fixed but can vary in length and amplitude. This principle adds a layer of complexity to trading market cycles analysis but also provides opportunities for astute traders.
Detailed Examination of Variation:
Dynamic Nature:
Cycle lengths in stock market cycles can expand or contract based on market conditions. This dynamism requires traders to be flexible in their analysis of trading market cycles.
On the nominal model the cycle’s length are only an average.
As example the nominal model of 80 days, have an average length of 68 days, but sometime can last 64 days or even 70 days,
The 20 days have an average of 17 days, but sometimes can be 14 days or 20 days.
In bullish trend the cycles have tendency to be shorter, and in bearish trend to be longer.
This is a very important point if we want to be able to use correctly the Hurst trading tools.
Trend Influence:
In bullish trends, cycles in trading market cycles tend to be shorter, reflecting the market’s enthusiasm. In bearish trends, cycles often lengthen, mirroring the slower pace of declining markets.
Adaptive Analysis:
Traders must continuously recalculate cycle averages in stock market cycles for accurate predictions. This ongoing adjustment is crucial for maintaining the relevance of cycle analysis in trading market cycles.
6-Cycle Rule:
A common practice in trading market cycles analysis is to use the average of the last 6 cycles to estimate the next. This rolling average helps account for recent variations in cycle length.
Market Psychology:
Variations in cycle length can reflect changes in market sentiment, a crucial aspect of stock market cycles. Understanding these variations can provide insights into the underlying psychology driving the market.
Complexity Factor:
Variation adds a layer of complexity to trading market cycles, requiring sophisticated analysis techniques. Tools like Fourier analysis and wavelet transforms are often employed to handle this complexity.
Seasonal Influences:
Some variations in stock market cycles can be attributed to seasonal factors. For example, certain cycles may consistently expand or contract during particular times of the year.
External Factors:
Economic events, geopolitical situations, and other external factors can cause variations in trading market cycles. Understanding these influences is crucial for accurate cycle analysis.
Conclusion
Mastering the concepts of wave periods, the Nominal Cyclic Model, synchronicity, and variation is essential for anyone serious about analyzing and trading stock market cycles.
These principles form the foundation of cycle-based trading strategies and provide a framework for understanding the complex dynamics of financial markets.
By understanding the interplay between different cycle lengths, recognizing points of synchronicity, and adapting to cycle variations, traders can gain a significant edge in navigating the markets.
Remember, while these principles provide valuable insights into stock market cycles, they should be used in conjunction with other forms of analysis and risk management strategies.
The markets are complex systems influenced by numerous factors, and successful trading requires a holistic approach that combines cycle analysis with fundamental and technical analysis.
By continually studying and applying these principles of stock market cycles, traders can develop a deeper understanding of market dynamics and improve their ability to anticipate and capitalize on market movements.
This knowledge, when applied judiciously, can lead to more informed trading decisions and potentially better outcomes in the challenging world of financial markets.
18 Responses