

Navigating Market Volatility: Understanding the 18-Month Cycle's Potential Bottom
Introduction
Navigating Market Volatility:
Explore the recent high volatility in the stock market and uncover insights on the potential bottom of the 18-month cycle. This article analyzes key indicators and predictions for the S&P 500, providing a comprehensive look at market trends.
Over the past two weeks, we have observed significant volatility in stock markets worldwide. Is the decline nearing its end? Let’s explore together the potential bottom of this cycle.
The Overall Picture
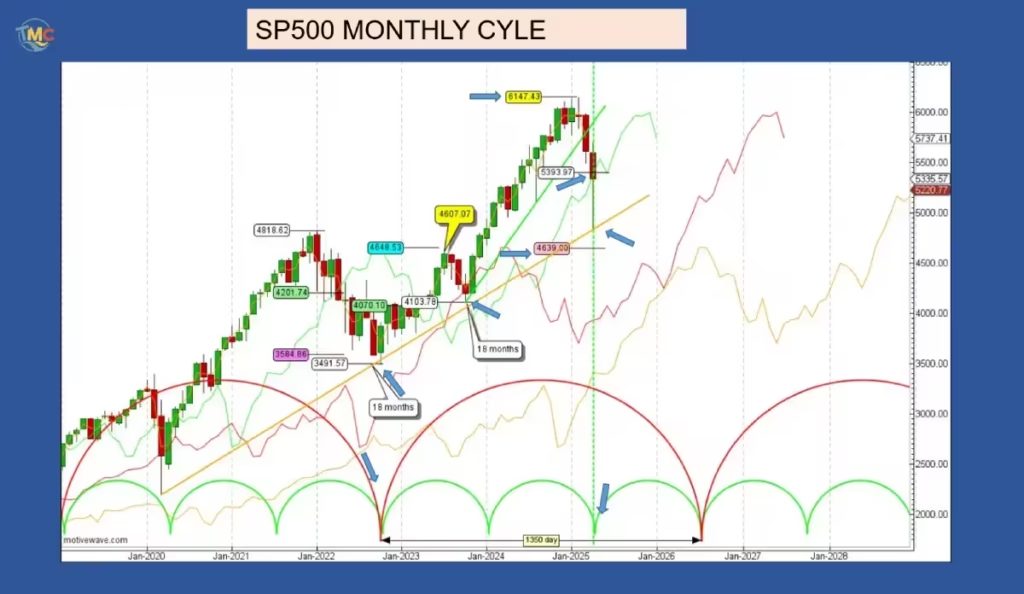
We’ll begin with the monthly cycle, focusing particularly on the 18-month cycle.
In my previous update, I anticipated that the bottom of this 18-month cycle would occur around the third week of May. As it approaches this low, the S&P 500 has crossed below its 18-month cycle line (the green line) at 5,393.97, setting a downside target of 4,639. I noted in my prior update the possibility of the S&P 500 dipping below its cycle line, which would necessitate a reevaluation of the 54-month cycle position.
First, let’s discuss the significance of crossing below the cycle line. This breach confirms that the peak of the 18-month cycle occurred on February 6 at 6,147.43. Up to now, the monthly low of 4,835 rests precisely on the 18-month cycle trend line (the orange line).
Now, returning to the long-term 54-month cycle position, we initially used a scenario placing the last 54-month cycle in October 2023. However, since the S&P 500 crossed below its 18-month cycle line, we must consider a shift to a second scenario, moving the 54-month cycle from October 2023 to October 2022.
Why Consider a Change in Scenario?
If October 2023 represented the 54-month cycle, then the current 18-month cycle would be the first in a series of three cycles needed to complete the 54-month cycle. Technically, the first 18-month cycle should form its low and find support along its cycle line. The breach of this line signals a warning that something is changing in the market.
Does this mean we should entirely discard the first scenario? Not necessarily. Depending on market reactions over the next few weeks, if the market sharply rebounds above its 18-month cycle line, the first scenario remains valid.
Why did the S&P 500 dip below its cycle line? Such movements often happen due to significant news events. While news may introduce volatility, it does not alter the cycles; it merely shifts the timing of low formations slightly. In our case, we were already anticipating an 18-month cycle low, so the market’s decline was not unexpected, though the amplitude was surprising.
Given that the second scenario appears more bearish than the first, we should treat it as the main scenario until proven otherwise. However, we do not completely invalidate the first scenario. As mentioned, if the market rebounds sharply and crosses back above its cycle line in the coming weeks, we will maintain the first scenario as a possibility. Prudence, however, advises us to prepare for the second scenario.
Weekly Chart Insights
To gain insights into the near future, let’s examine the weekly chart.
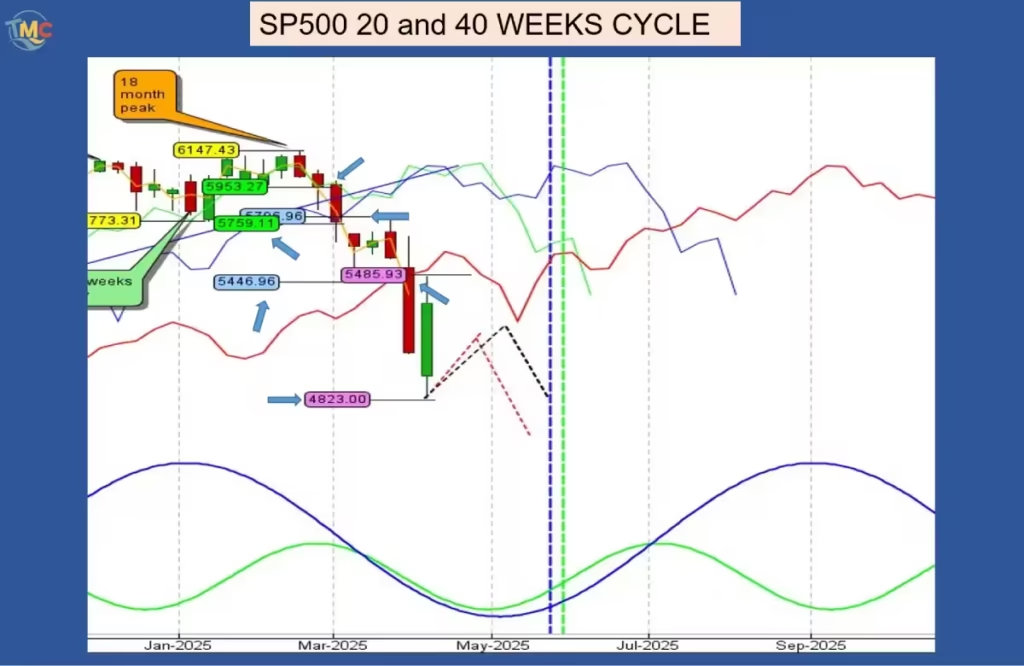
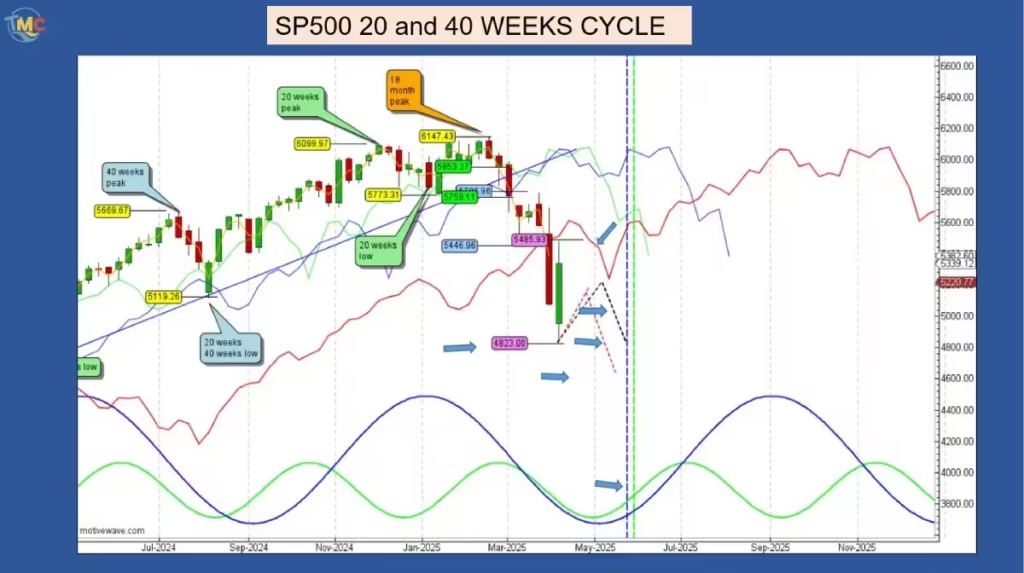
The 20- and 40-week cycles provide more information than the monthly chart, helping us identify the potential bottom for this 18-month cycle.
On the weekly chart, we have three trading signals. The first occurred on the 20-week cycle when the S&P 500 crossed below its line at 5,953.27, targeting 5,759.11. The second signal emerged at the 40-week cycle line (the blue line), where the crossing took place at 5,796.96, targeting 5,446.96. The third signal was when the S&P 500 crossed below its 18-month cycle line (the red line) at 5,485.93, with a potential downside target of 4,823, which was reached last week.
All targets on the weekly chart have been fulfilled. The red line represents the weekly equivalent of the 18-month cycle, allowing for more precise timing. When the S&P 500 crosses above this cycle line, it will serve as confirmation that the 18-month cycle bottom has either formed or is in the process of forming.
Expectations for the Coming Weeks
Assuming the 18-month cycle is forming on schedule, we could expect the S&P 500 to rebound toward its 18-month cycle line (the red line) over the next two weeks, without crossing above it, before resuming its decline to reach the 4,639 target, or possibly forming a double bottom.
A double bottom occurs when the second low matches the level of the first, in this case at 4,823. On the chart, I’ve illustrated the most likely scenario with a red dashed line, while the black dashed line represents the alternative scenario of a double bottom.
The next lows for the 20-, 40-week, and 18-month cycles are still projected to form during the third week of May, indicated by the blue dashed vertical line.
The 80-Day Cycle
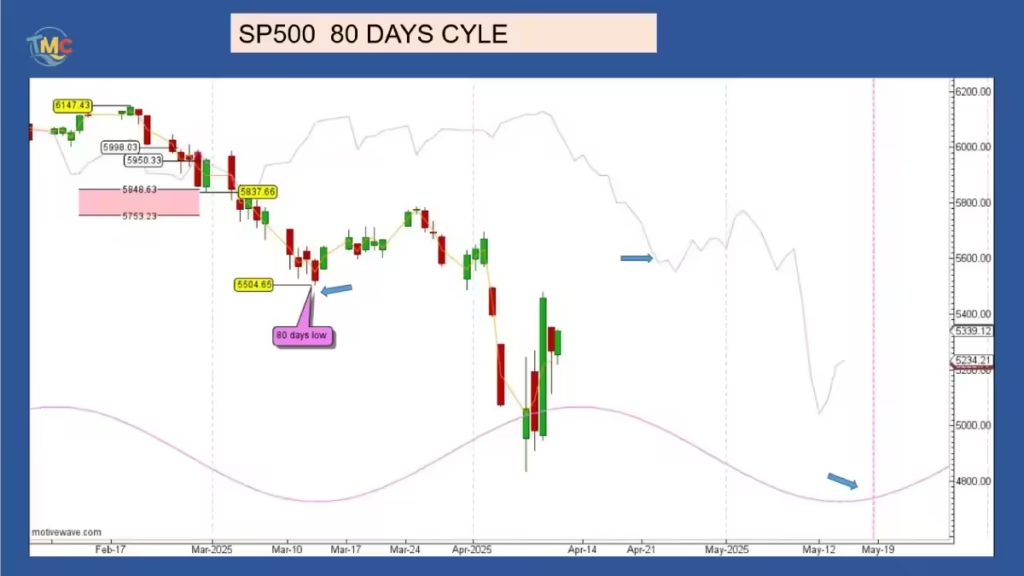
The 80-day cycle is currently the most critical cycle to track. The last 80-day cycle low was on March 13, and the next is scheduled for May 20.
Why is this cycle so vital? It will provide the first signal of the possible formation of the 18-month cycle low. On this chart, the most important line to monitor is the purple cycle line. A sharp crossing above it will not only set an upside target but crucially confirm that the 80-day cycle low has formed.
According to Hurst’s theory, when the market crosses above its cycle line, it confirms that the low of this cycle formed at its lowest point before the crossing. Following the Hurst rule of synchronicity, since this 80-day cycle will be the eighth and final cycle in this 18-month cycle, its low will trigger the bottoms of all succeeding longer cycles, up to the 18-month cycle. At that point, we can confidently declare the bottom of this 18-month cycle.
Conclusion
We still anticipate that the 18-month cycle low will occur by the third week of May, and we require one more decline to complete the overall pattern.