

Is the Gold Bull Run Over? February 2026 Cycle Analysis & Price Targets
Introduction
The gold market recently experienced a massive wave of volatility,
leaving investors wondering if the 18-month bull run has finally reached its peak. In this
week’s update for February 9, 2026, we dive deep into Hurst cycle principles to determine if
the $5,626.80 all-time high marks a long-term reversal or simply a mid-cycle correction.
The 18 Month Cycle
What a ride in the gold market last week! Does this volatility mark the end of the current 18-month cycle bull run?
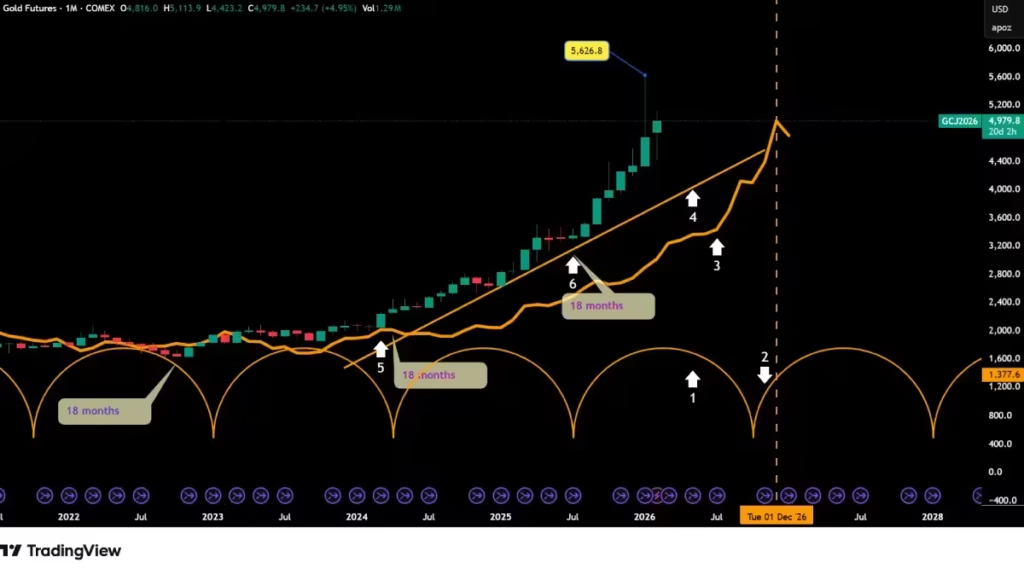
As I mentioned during my last gold market update, the peak for this cycle was expected between April and May (arrow 1).
If this current high is indeed the 18-month cycle peak, it will be bearish for the remainder of the gold market cycle. Since the low for this 18-month cycle is expected around December 2026 or January 2027 (arrow 2), this would mean the rest of the year will remain bearish for the gold market.
But for now, we have no sign that this is the actual peak of this 18-month cycle. Since the gold market is still trading well above its 18-month FLD (arrow 3), there is no reason to call the $5,626.80 high as the definitive 18-month cycle peak.
The market is still trading above its VTL (Valid Trend Line)( arrow 4). This very helpful tool provides one more piece of critical information beyond the FLD.
In fact, when the market crosses below the FLD, it confirms that the peak of the current cycle has formed. However, when it crosses below the VTL, it confirms that the peak established before the crossing is actually the 18-month cycle peak. The next valuable information it confirms is the peak of the next longer cycle—in this case, the 54-month cycle, or 4.5 years.
To draw this VTL, we draw an uptrend line from March/April 2024(arrow 5) to the next 18-month low in June 2025 (arrow 6). According to the Hurst rules, during this process, no part of the chart should fall below the VTL.
For that reason, I moved the VTL to March 2025. To be even more precise, we can make it pass from November 2024 to August 2025.
Now, let’s move to the next lower cycle: The 40-week cycle.
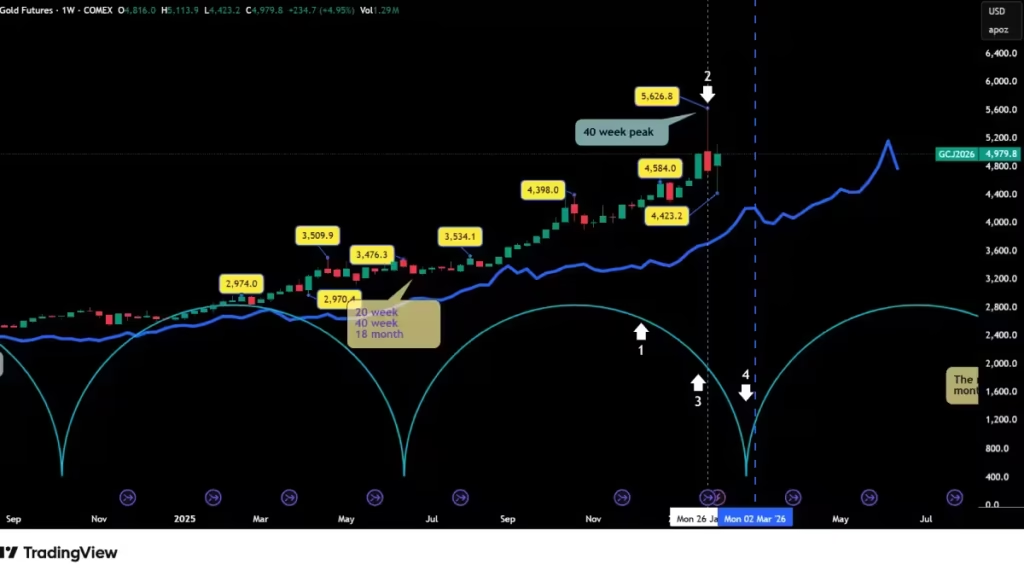
The top of this cycle was expected by the end of December 2025 (arrow 1), but the gold market was so bullish that it kept moving to the upside, reaching the $5,626.80 all-time high on January 29th, 2026 (arrow 2).
Due to the volatility following this peak, we can say with a very high degree of confidence that the January 29 high is a 40-week peak.
If this is the 40-week peak, we notice that the peak for this 40-week cycle formed on the right side of the cycle, which is very common in bullish trends (arrow 3).
Hurst calls this “time translation.” If you want to know more about time translation,
When we see a time translation to the right side, we can usually expect only a moderate correction.
The low for this 40-week cycle is expected during the first two weeks of March ( arrow 4) and should find support on its cycle line around 4,600.
However, there is a possibility the gold market won’t even reach that cycle line.
The 20-week cycle.
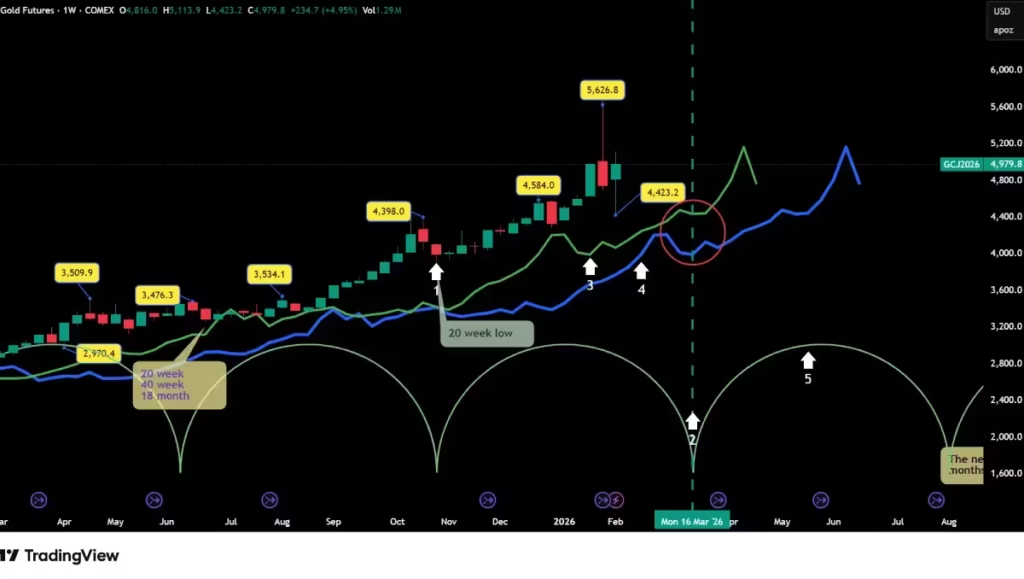
The last 20-week cycle low occurred at $3,901 on October 28th, 2025 (arrow 1).
By the Hurst principle of synchronicity, the next low should form at the same time as the next 40-week cycle, expected during the first two weeks of March (arrow 2).
Technically, at that time in the cycle, the gold market is supposed to cross below its cycle line ( arrow 3). Indeed, during the second 20-week cycle after a major low, the market is technically supposed to cross below its cycle line, providing a downside target.
Usually, that target is around the 40-week cycle line (arrow 4). But as you can see on the chart, during the first two weeks of March, the cycle lines are very close to each other.
Therefore, there is a very high probability the gold market will stop at its cycle line, rebound, and rally on its way to form the next 20-week cycle peak, which is expected during the second week of May (arrow 5).
We will also have to monitor where that peak forms to anticipate the magnitude of the next correction.
The 80-day cycle.
Thanks to Hurst principles, we were able to call the past few 80-day cycle troughs with a very high degree of precision.
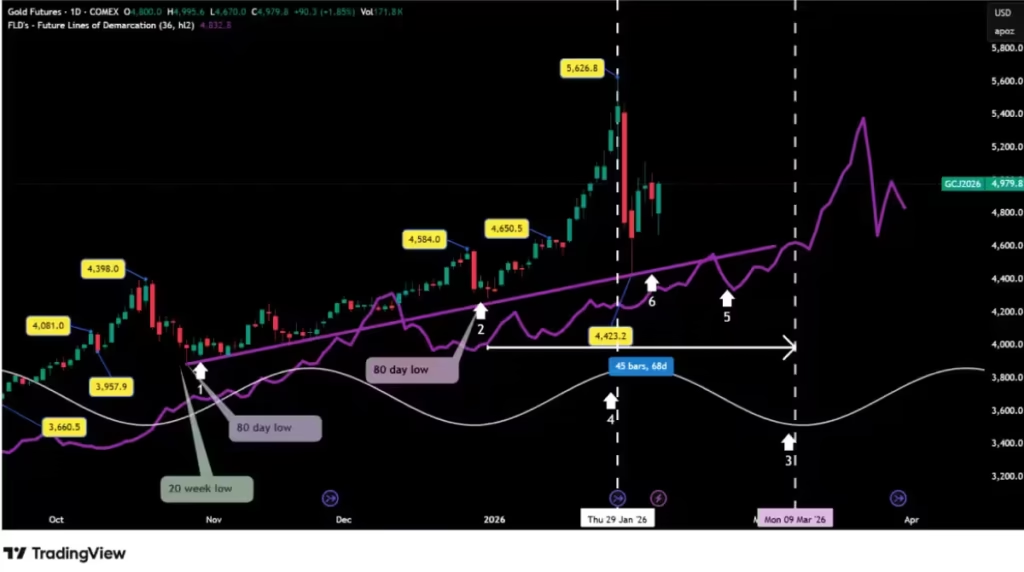
In fact, we called the October 27 low (which formed on October 28) (arrow 1) and the next one for January 3rd, 2026 (which formed three days early on December 31st, 2025) (arrow 2). Adding 68 days to the December 31st low gives us March 9th for the next potential 80-day cycle low (arrow 3).
The January $5,626.80 all-time high actually formed on the left part of the cycle (shown by the white dashed line) (arrow4), which may explain the two following days of very high volatility.
Indeed, when a peak occurs on the left part of the cycle, it is usually bearish for the market and we can expect a sharp correction. Since this is the second 80-day cycle since the last 20-week cycle low, technically the gold market should cross below its cycle line, providing a downside target.
Following the cycle line provides vital information.
Crossing below this line (arrow 5) will confirm that January 29 was the 80-day cycle peak.
But the most important tool is the VTL (arrow 6), or the cycle trend line. Indeed, if the market crosses below it, this will also confirm the peak of the next longer cycle: the 20-week cycle peak.
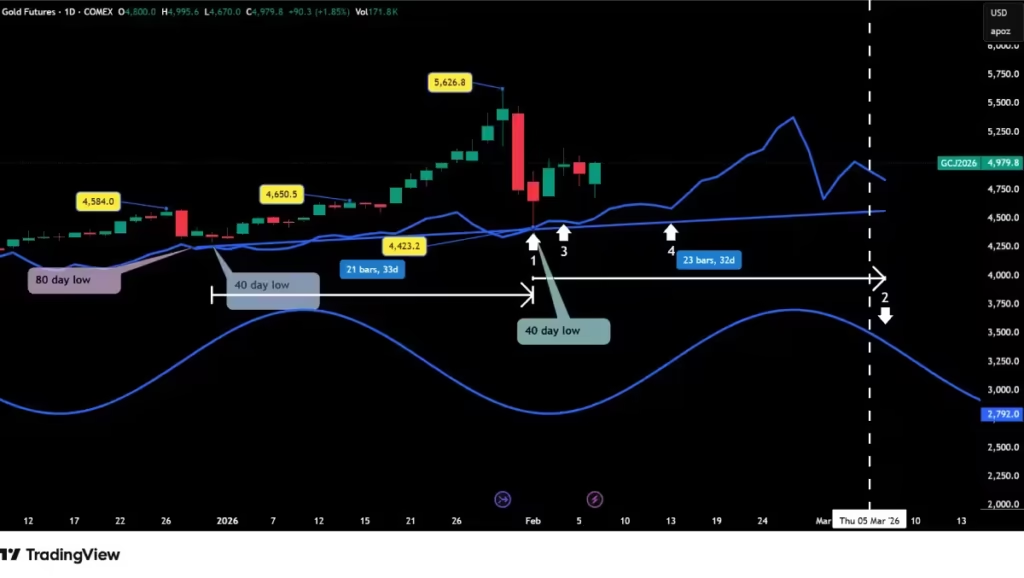
The 40-day cycle.
The February 2nd low of $4,423.20 was at least a 40-day low (arrow 1); indeed, 33 days had elapsed since the last December 31st 40-day low. The average 40-day cycle length in the Hurst nominal model is 34.1 days. If the gold market keeps following this nominal model, we can expect the next 40-day low to form around March 5th (arrow 2).
What to expect until the next 40-day cycle low formation:
First of all, since this is the third 40-day cycle in the current 20-week cycle, technically the gold market should have already crossed below its cycle line and be trading below it.
Despite the huge $1,203 (or 21%) decline, the gold market is still trading above its cycle line; the market even found support on it on February 2nd (arrow 3).
From here, there are two possible scenarios.
Scenario One: The gold market moves sideways-to-down for the next few weeks, attempts another cross below its 40-day cycle line, forms its low (the crossing may be brief), rebounds sharply back above the cycle line, and resumes its move upward.
Scenario Two (Bearish): The gold market continues moving down and crosses below its cycle line. This crossing may occur around $4,500.
If that is the case, the potential target will be around $3,374. If the market reaches this target,
it first, raises the possibility that the January $5,626.80 high was a multi-year peak,
And Second, the target will be near the 18-month cycle line.
But the most bearish sign would be the gold market falling below its VTL (arrow 4 ), confirming the January peak as at least a 54-month (4.5 year) cycle peak.
But these are only possibilities. For now, let’s stay focused on the shorter term. It is important to monitor the 40-day cycle line as the first sign of bearishness. To judge the total degree of bearishness, we will monitor the longer cycle FLDs, cycle lines, and VTLs.
Conclusion
The Path Forward
In summary, while the massive $1,203 drop from the all-time high of $5,626.80 has sparked a lot of “Gold Chaos” in the headlines, our cycle analysis tells a more structured story. We are currently navigating a critical junction where the 40-week and 20-week cycles are converging toward a projected trough in early March.
Whether we see a sideways “Scenario One” or a more bearish “Scenario Two” breakdown to the $3,374 level, the key for us as cycle traders is to remain objective.
By monitoring the 40-day cycle line and the 18-month VTL, we can separate market noise from the actual trend. Remember, if we hold the VTL, the structural Bull Run is still very much alive.