

Gold Market Analysis: Navigating the 18-Month and Short Term Cycles
Introduction
Since my last update on February 9, the gold market has been moving sideways. As mentioned in the previous update, when the market moves sideways, it is very difficult to identify certain very short-term cycles. Let’s see what we can expect for the next few months in this March 23 weekly update.
The 18 Month Cycle
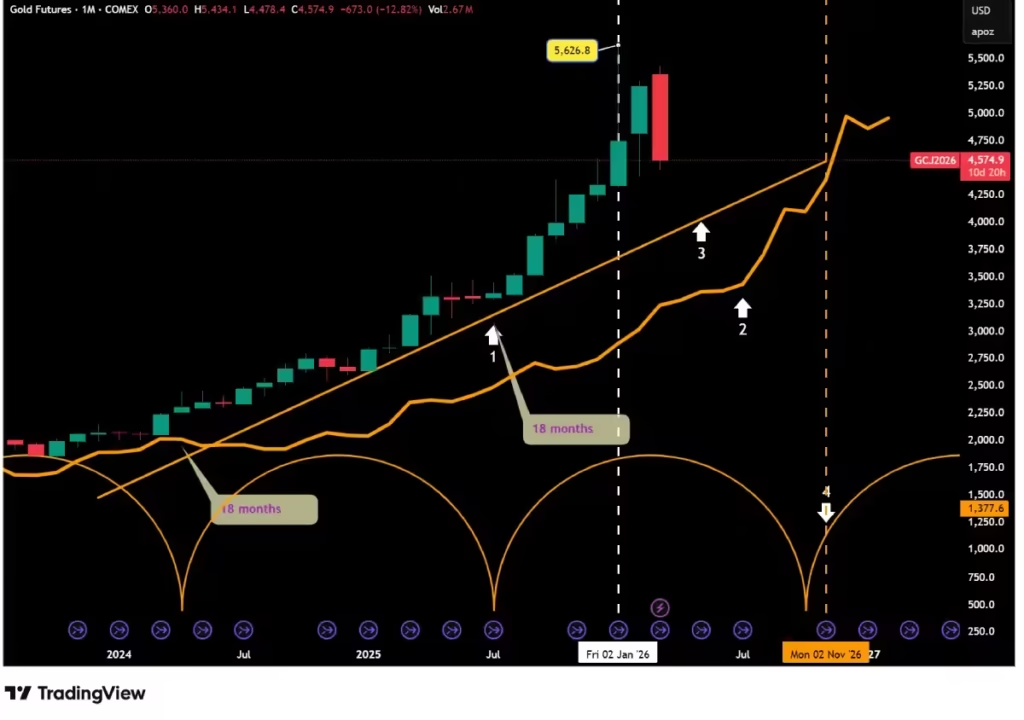
Despite the sharp downside move last week, the gold market is still trading well above its cycle line (the green line, arrow 2) and its cycle trend line, or VTL (the yellow uptrend line, arrow 3). The gold market is still in a bullish mood. It has been 9 weeks since the last 18-month cycle low in June 2025 (arrow 1).
If the January 2026 all-time high of $5,626.80 was the actual 18-month cycle peak, then this peak formed o n the left part of the cycle(represented by the white dashed vertical line). This is usually a bearish sign. If that is indeed correct, we can expect a sharp correction for the 18-month cycle low expected by the end of this year (arrow 4), represented by the yellow vertical dashed line.
What should we expect for the next few months in the gold market? There is a very high possibility that the January high is the 18-month cycle peak. If so, we can expect the gold market to decline to at least its cycle trend line, or VTL. This is a very important support for the gold market; indeed, if the market crosses sharply below it and trades below it for a few months, then this will confirm the January peak is the 18-month peak and also the peak of a much longer cycle—at least the 54-month cycle, and maybe even longer. To get a more precise analysis of the longer cycles, I suggest you consult the dual analysis post on gold published in April 2025. It is a very interesting post suggesting that in the gold market, there is a possibility to study the market using both trough analysis and peak analysis. To confirm the 18-month cycle peak, the gold market has to cross below its cycle line or its cycle trend line (VTL).
The 40 week Cycle.
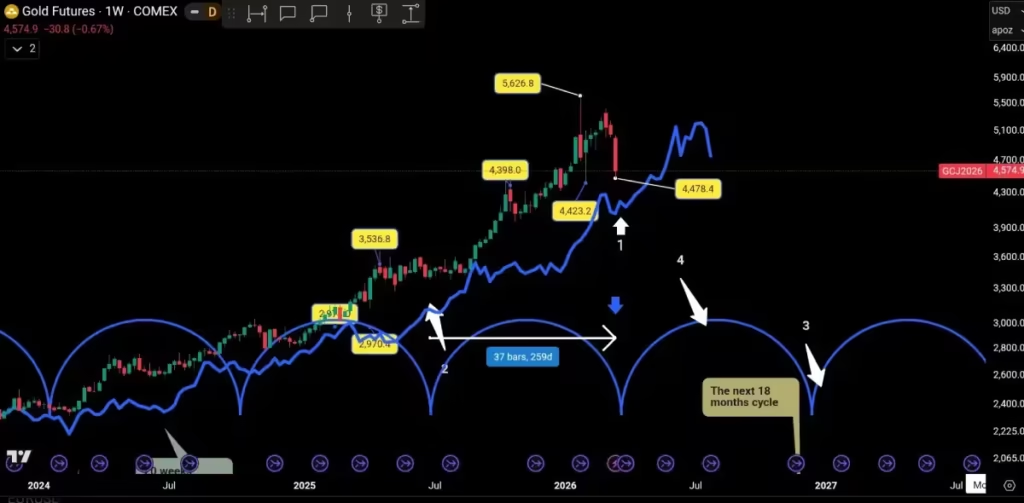
The sharp decline last week is part of the 40-week cycle low formation. As mentioned during my last update, at this stage of the cycle—during the first 40-week cycle after an 18-month cycle low—the market should find support on its cycle line (arrow 1). For now, despite last week’s decline, the gold market is still well above it. This week, the 40-week cycle line will be at $4,127, and for the next 2 weeks, it will be at $4,065 for the March 30 week and $4,149 for the April 6 week.
I was also expecting the 40-week cycle to form during the first two weeks of March (blue arrow). If last week was the 40-week cycle low, then the gold market was right on time.
It has been 37 weeks since the last 18-month cycle low (arrow 2), which is 1.97 weeks shorter than the 38.97-week Hurst nominal model. If the gold market follows the Hurst nominal model, there is the possibility that the gold market still has 1 or 2 more weeks of decline, representing approximately another potential 8% decline.
Analyzing the shorter cycles will give us more precise information about a possible new decline. For the purpose of this analysis, let’s assume the gold market formed its low last week. If it forms its low later, then we will need to recalculate the potential date for the next 40-week cycle accordingly using the Hurst technique. The next 40-week low is expected to form during the last week of November (arrow), with the peak occurring around the end of July(arrow 4).
The 20 week Cycle.
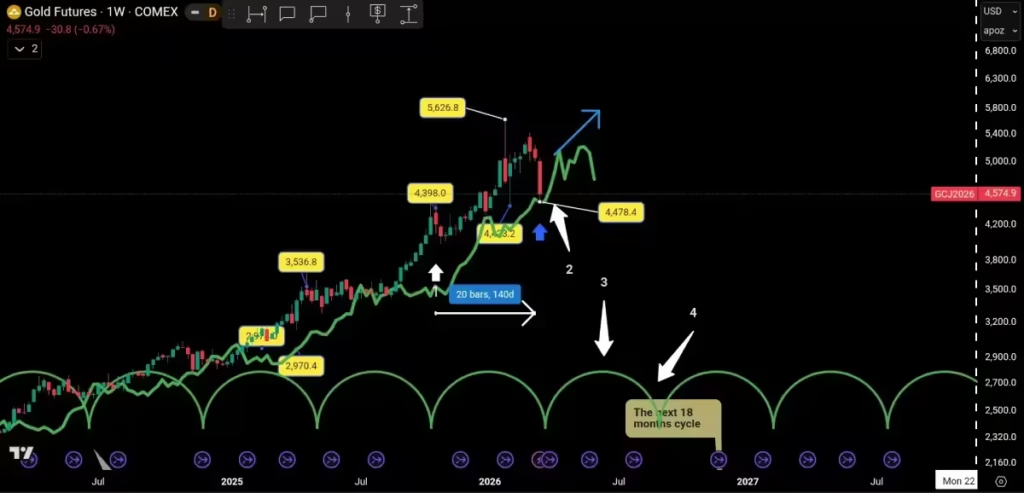
It has been exactly 20 weeks since the previous 20-week cycle (arrow 1). 20 weeks is right on time compared to the average of 19.48 weeks in the Hurst nominal model. In my last update, I expected the gold market to cross below its cycle line during its 20-week low formation, providing a potential downside target (blue arrow).
Last week’s $4,478.40 low was only $9 above its cycle line or FLD (arrow 2). The most likely scenario is that the gold market will form its low on its cycle line and rebound on its way to the next 20-week peak, which is expected to form around May 18, (arrow 3)with the low expected to form around July 20 (arrow 4). When are we going to have the 20-week low confirmation? To answer this question, we need to look at the shorter cycles.
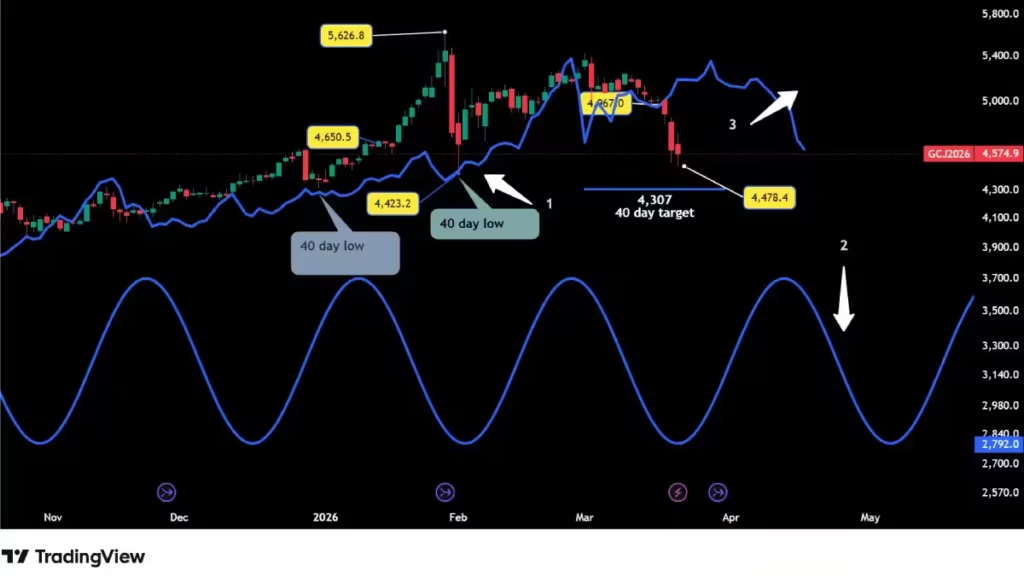
The 80 Day Cycle.
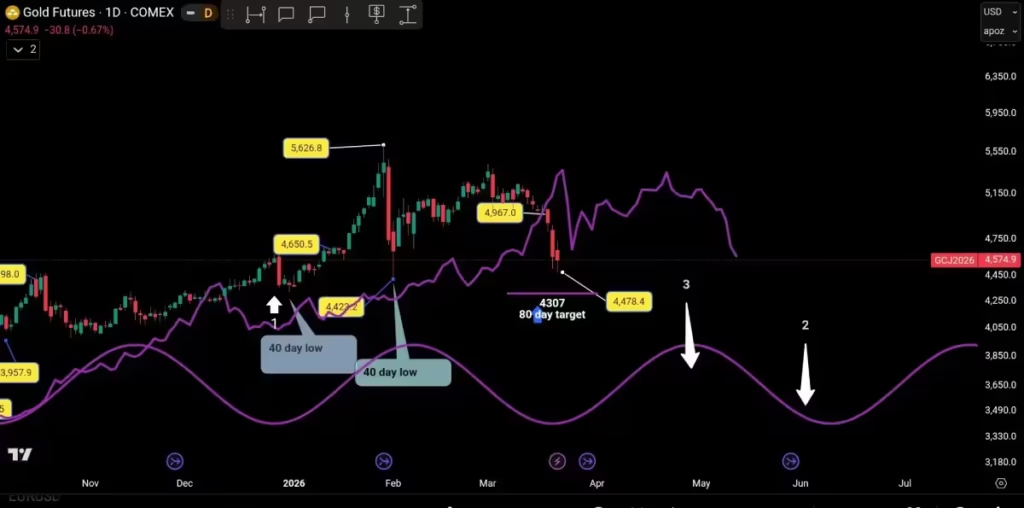
Last week, on Wednesday, March 18, the gold market crossed below its cycle line at $4,967, providing a potential $4,307 downside target. On Friday, the gold market made a $4,478.40 low. The last 80-day cycle formed a low in December 2025 (arrow 1), and the next one is expected right about now. During the next rally, the gold market should cross above its cycle line (the purple line). Assuming the gold market formed its low last Friday, the next 80-day cycle low is expected for May 27 (arrow 2), with the peak around April 23 (arrow 3). During the May 27 low formation, technically, the gold market should find support on its cycle line. Knowing whether the low will form on its cycle line or below it will give the first indication of how much bullishness or bearishness is left in the gold market.
The 40 Day Cycle.
The last 40-day cycle formed its low on February 2 (arrow 1), and we expect the current one to form its low about now. Actually, there is a high probability it already formed last week. If that is the case, the next one should be around April 22 (arrow 2). At the time of this low formation, the gold market should find support on its cycle line, but before forming its next low, the gold market should cross above its cycle line, the blue line (arrow 3).
On March 18, the gold market crossed below its cycle line at $4,967, exactly at the same point as the 80-day cycle, which of course provides the same $4,307 target. The March 18 crossing provided the first trading signal of the year. As I mentioned above, when the 40-day low is confirmed, the gold market should cross above its cycle line, providing a potential upside target. We will get the 40-day low confirmation by analyzing the next shorter cycle: the 20-day cycle.
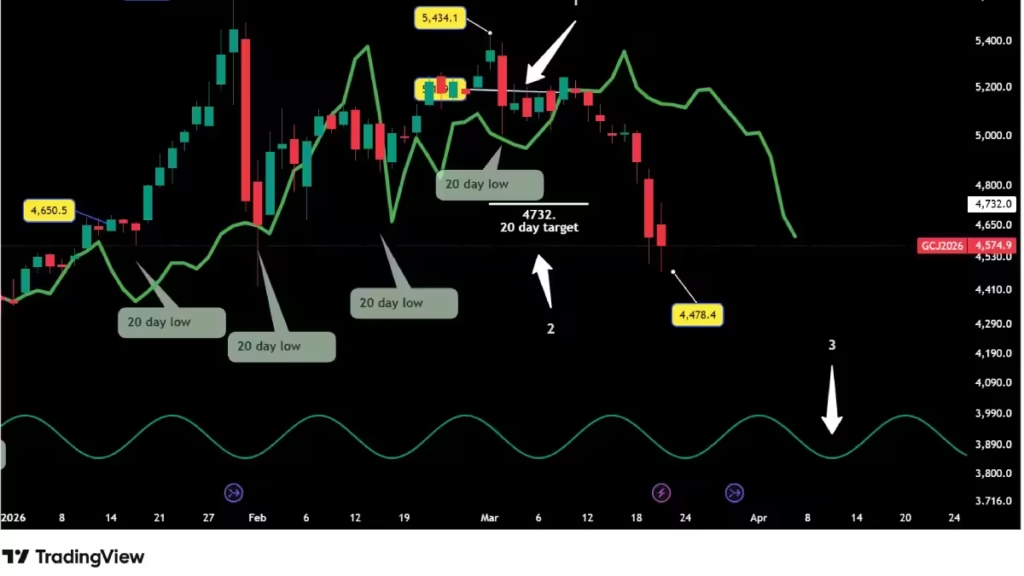
The 20 Day Cycle.
On March 12, the gold market crossed below its cycle line, providing the second trading signal of the year. The crossing occurred at $5,179 (arrow 1), providing a target of $4,732 (arrow 2). On March 20, with the $4,478.40 low, the gold market reached its target. With one successful signal and one negative signal, the success rate for the 20-day cycle is 50%.
What is next for the 20-day cycle?
To confirm that the short-term decline is over, the gold market has to cross above its cycle line and provide an upside target. We have to monitor whether the gold market fails to reach its future target before sharply crossing below its cycle line; if this happens, then we can expect a further decline. The next 20-day cycle should form its low on April 7 (arrow 3), and very importantly, this low must be on its cycle line or above it, but not sharply below.
Conclusion.
In summary, while the long-term bullish trend remains intact, the potential for a left-translated peak in the 18-month cycle suggests a significant correction toward the end of 2026. Traders should watch the cycle lines closely for confirmations of these lows. Maintaining support at the VTL will be the ultimate test for the gold market’s strength in the coming months.