

THE GOLD ETF
The Gold -Etf 20 day’s cycle.
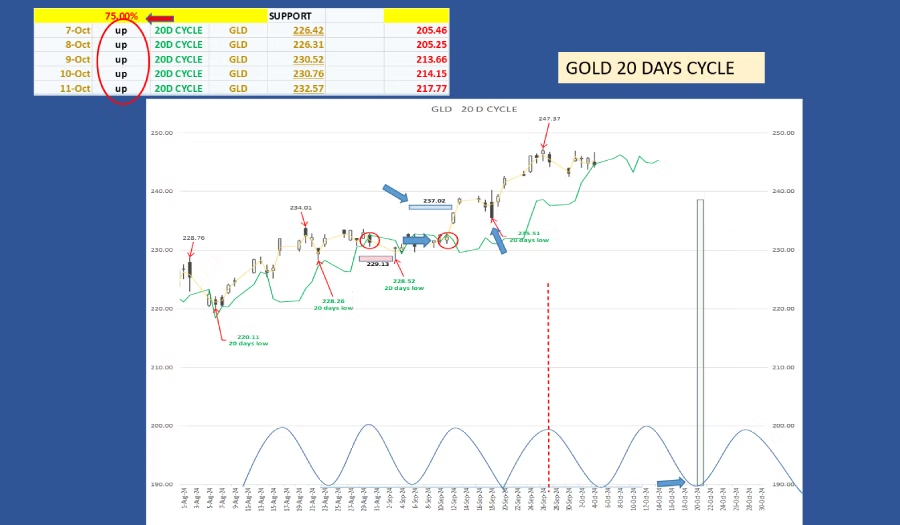
After meeting his 237 target, from the September 12 upside crossing at 232.78, (the blue arrows)
The gold etf market formed a low on September 18.
The next low is expected during the week end of the October 6,
Technically, the market should cross below his cycle line, before forming the actual 20 day’s low.
But the time is due and there is a possibility of the gold Etf, will only find support on his lines, unless a sharp decline occur at the beginning of this week.
On the top left corner, there is a table with the cycle lines and their potential targets, if the market cross below this week.
Usually at the time of the second 20 days cycle low, the gold Etf supposed to find support on his 40 days cycle lines.
IF the low occur as expected during the week end on October 6, then the next 20 days cycle low is expected on October 23, the yellow zone on the chart.
The peak of the actual 20 days cycle gold Etf, occurred right on the peak of the cycle, on Tuesday September 26 at 247.37, the red dashed line.
There is a possibility, the next peak will occur on the right part of the cycle,
If the gold market make a peak on the left side of the cycle, before the October 14, this will be the first sign of a shot term peak is forming.
To know more about what to expect for the 20 days cycle, see the roadmap.
The cycle trend for the 20 days cycle is up and for 2024, the success rate is 75%.
The Gold Etf – 40 day’s cycle.
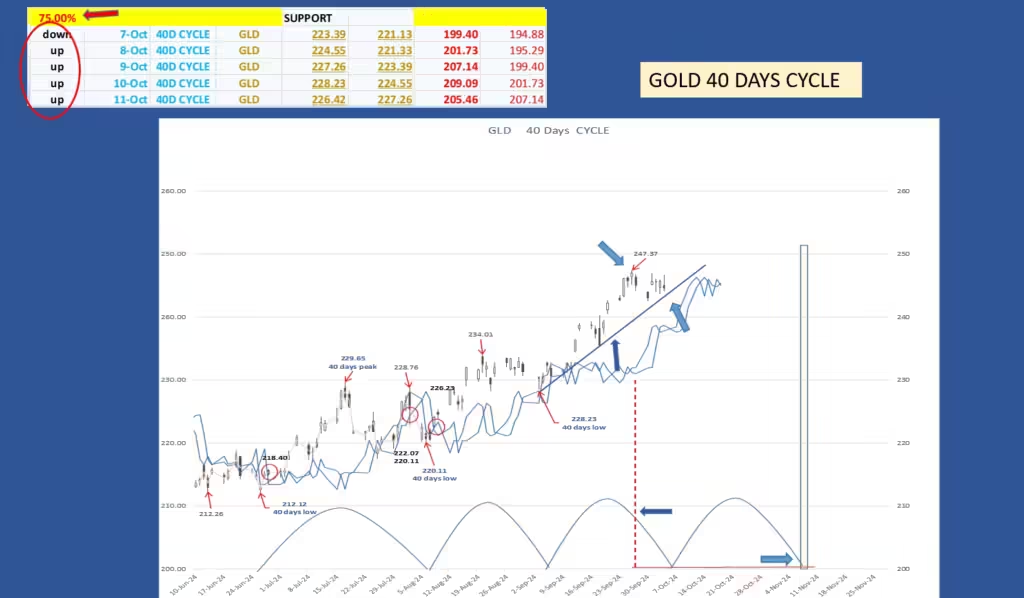
There is a very high probability, the September 27 high at 247, is the 40 days cycle peak.
We expect the low for the present 40 days cycle to form during the past week end, or Monday October 7.
Technically at that stage of the cycle, the gold Etf supposed to find support on his cycle line.
But due to the bullishness of the market, is possible the market won’t meet his cycle lines.
In this case we can expect the market to continue his bull run, to at least the 80 days cycle peak.
The 40 days peak occurred on the right part of the cycle, the red dashed line,
This explain why the market may not reach his cycle lines, during the formation of the actual 40 days low.
Forming a peak on the right side of a cycle, is a bullish sign, when this happen we can expected a moderate correction.
When the market form a peak on the left side this is usually bearish and we can expect a sharp correction,
The size of the correction, depend of the degree of the cycle we dealing with.
On the 10 days cycle the correction will be less important, then the 80 days cycle.
J.M.Hurst call that, time translation, to have more details on the time translation, I already published a post.
The blue trend line, is the 40 days cycle trend line, or what J.M.Hurst call VTL,
The VTL, is an important and useful tools to identify the peak of different cycles, even if he is little bit less reliable then the FLD, is still very important tool to use.
Usually the VTL give first, the signal of a potential peak is forming.
You can find a complete article on VTL, in my posts.
When the gold Etf will cross below his VTL, this will confirm the 40 and 80 days cycle peak as formed or is in formation.
In case of the 40 days cycle low is not formed yet and if, this week the gold market made a lower low than the September 30 low, I will adjust the trend line.
The next 40 days cycle gold etf low is schedule for November 10, the yellow zone on the chart.
The actual length for the 40 days cycle, is for now 34 days.
Since we will start a new 40 days cycle, the trend for this week is up and the success rate for trading the 40 days cycle is 75%,
Meaning, trading all the signals given by this cycle, will result 3 signals out of 4 was successful.
The Gold Etf – 80 day’s cycle.
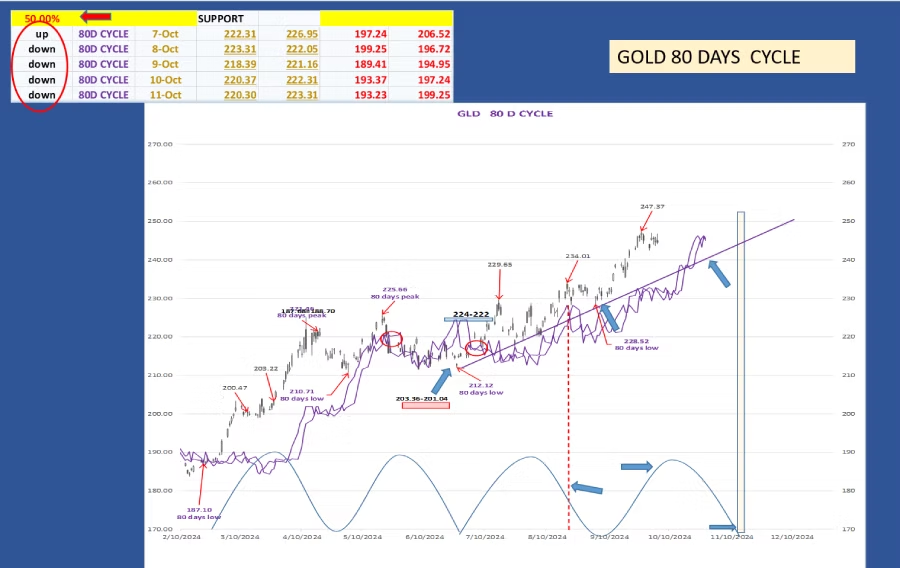
The last gold etf 80 days cycle low can be place on June 26.
Few weeks ago, we have some uncertainty to where to place the 80 days cycle low, since then Everything is in favor of the June 26 is a major low.
Placing the last 80 days cycle on the June 26, give a time target for the next low on September 3.
On September 3, the gold etf market made a low at 228 right on time.
The next 80 days cycle low is expected on November 10, the yellow zone on the chart.
Due to the Hurst principle of synchronicity, the 20 weeks low will also form, at the time of this second 80 days low, since the major low on June 26.
After the last 80 days low have been confirmed, from the June 26 low to the September 3 low, I draw the 80 days cycle trend line, the purple line.
When the gold market will cross below it, this will confirm the 20 weeks peak is formed or in formation, and we can expect a sharp correction
The peak of the previous 80 days cycle, peaked on August 20 on the right part of the cycle, the red dashed line,
J.M.Hurst call that right translation,
If you want to know more on time translation and the consequences,
I recommend to watch my series of YouTube videos, you will find the link in the videos page, or go to my time translation post.
Coming back to the 80 days cycle peak, since he occurred on the right part of the cycle, we had a mild correction only 2.34%.
What’s next for the new 80 days cycle?
We can expect the next peak forming on the cycle peak or slightly on the left, the blue arrow on the chart and the correction should be sharper than the previous correction.
Since we just started a new cycles on September 3, the cycle trend is up, and the success rate, with only 4 signals since the beginning of the year, is 50%.
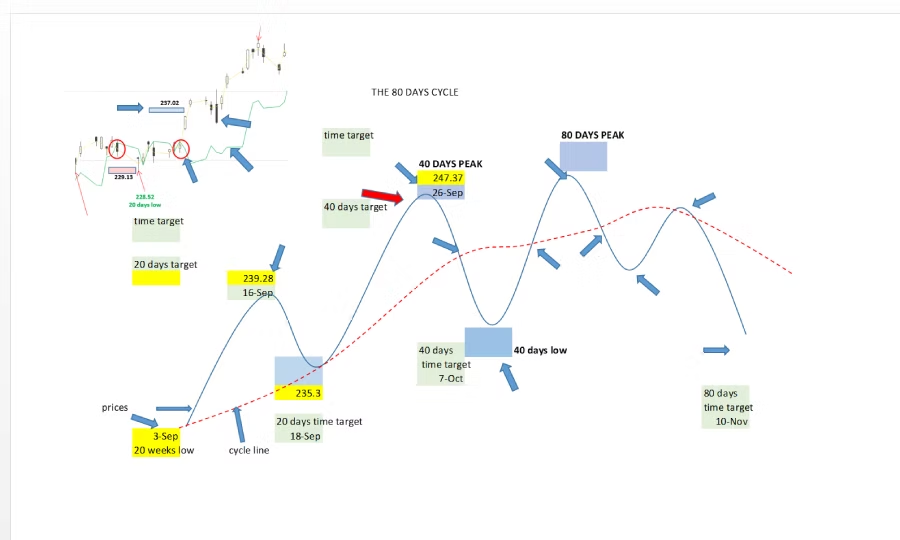
The Roadmap
Let’s see what we can expect for the actual gold etf 80 days cycle on the roadmap.
This 80 days cycle start on September 3, on September 11, the gold market crossed above his cycle line at 232.77, providing a potential upside target at 237.02 dollars and 25 cents, or 1.82% of potential profits.
The gold market meet his target, and with a new all-time high at 239 dollars and 28 cents, the 20 days cycle peak on September 16,
Two days later the gold market formed his first 20 days low, at 235 dollars and 30.
Technically, after a major low, the first 20 days low should find support on his cycle line, but since there is a good amount of bullishness, the low was well above his cycle line.
Since then, the gold Etf is on his way to form his 40 days cycle peak, we are right there, the red arrow.
On September 26, the market made a new all-time high at 247 dollars and 37. this high is certainly the 40 days cycle peak.
Now, the market should cross below his cycle line, providing a potential downside target for the 40 days cycle low.
After the 40 days low, the gold Etf should cross back above his cycle line to provide a target for the 80 days cycle peak.
After the 80 days cycle peak formation, the gold Etf should cross below his cycle line, providing a downside target for the next 80 days cycle low forming a first low, around third week of October,
Then rally toward his cycle line, using it as resistance, before heading down to November 10 to form the 80 days cycle low.
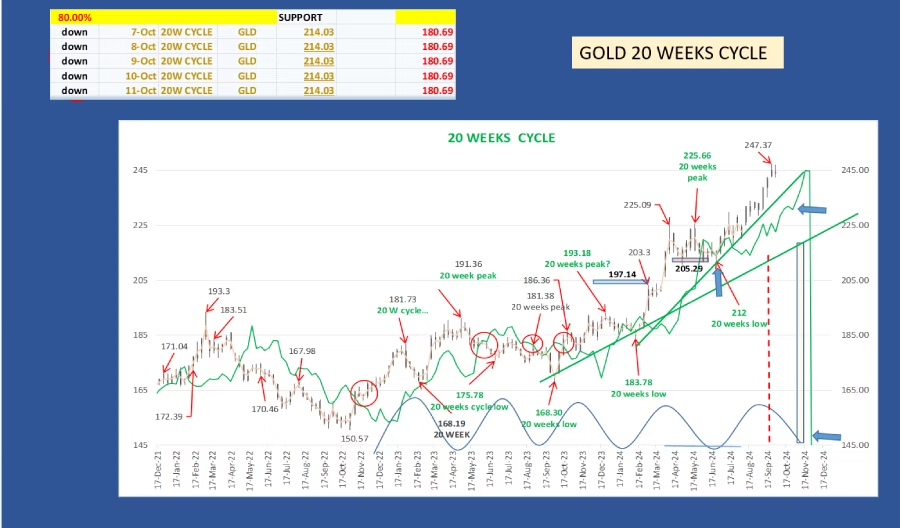
The Gold Etf – 20 week’s cycle.
The 20 weeks cycle is an important cycle to follow, by knowing where he will form his low compare to his cycle line, will give us a clue of which cycle degree is the June 26 low.
Let’s see the two different scenarios.
The first One Is:
If the gold market, the Gold Etf, during his low formation around the November 10, find support on his cycle line, around 238 dollars.
Then there is a very high probability, the June 26 low at 212 dollars was an 18 months cycle low.
IF this scenario is correct, we can expect the Bull Run to continue.
The second scenario:
Is the gold Etf cross below his cycle line during the next 20 weeks low formation,
After knowing where the 20 weeks peak will taking place, we will have a first indication where the 20 weeks can form a low.
IF the gold market cross sharply below his cycle line during the low formation, this will raise the possibility of the November low is not only the 20 weeks low but it will also can be the 40 weeks cycle low, and with confidence we can place the last 18 months cycle low on February 2024 low .
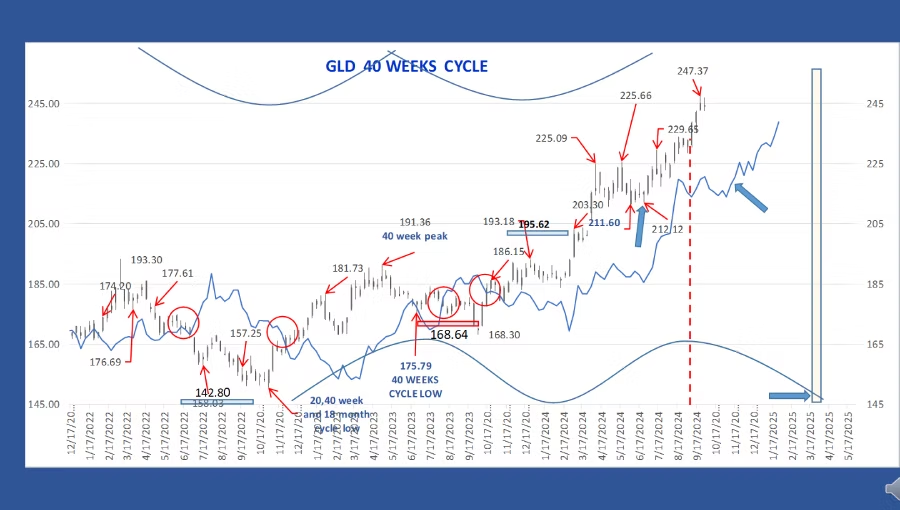
The Gold Etf – 40 week’s cycle.
In the case of the first scenario from the 20 weeks analysis, the last 40 weeks cycle formed a low on June 26, at the same time then the last 18 months low,
which is the most likely scenario,
we can expect the next 40 weeks low occur between February and March 2025.
In the second scenario, the market should find a support on his cycle line,
which will be between 217 and 220 on November 10, approximately a 10 % decline.
In conclusion
We still have a good amount of bullishness in the gold market, we can expect the bull market to continue, but we have to keep in mind the possibility of the 40 weeks cycle could form a low in November, even if the probability are low.