

“Gold Bullion Market Analysis: Trading Cycles & Price Movement Forecast”
Introduction
This week we will analyze the gold bullion market for the week of July 14, 2025. We explore trading cycles, technical analysis, and potential price movements. Discover what to expect in the coming months and how to navigate market trends effectively. Don’t miss out on crucial insights!
Since reaching an all-time high of 3,509.90 on April 22, the market has been moving sideways. Currently, on the short-term time frame, the gold bullion market appears to be forming a triangle pattern. Let’s explore what we can anticipate for the upcoming months.
First, let’s examine the 18-month cycle.
From a long-term perspective, as long as the gold market does not dip below this cycle line, the bullish sentiment remains intact. We expect this 18-month cycle to hit its low point in September.
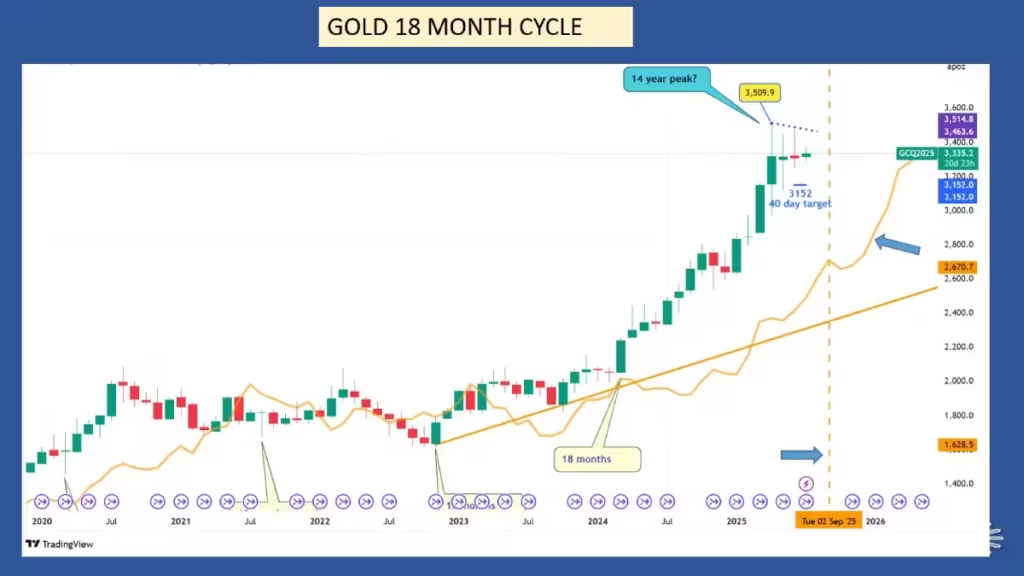
Next, we will analyze the 40-week cycle.
As I mentioned in last month’s update, the previous 40-week cycle formed in November 2024, with the next one projected for September. The blue vertical dashed line indicates the time frame for this cycle’s low formation.
Technically, at this time, the market is supposed to dip below its cycle line, but it remains bullish for now. We can expect the gold bullion to continue moving sideways until it forms its next 40-week cycle low. If this is correct, a significant rally could follow once the 40-week cycle low is established.
Should the gold market cross below its cycle line, it will indicate potential downside targets. Here are the cycle lines and their corresponding targets, should the market cross below them. We also need to monitor the blue cycle trend line, known as the (VTL) according to Hurst.
A crossing below this line, confirmed within the next two weeks, would validate that the previous peak before this crossing marks at least a 54-month cycle peak of 4.5 years. The 40-week peak aligns with the cycle peak, signaling neutrality.

Now, let’s look at the 20-week cycle.
Last week, the gold market dipped slightly below its cycle line, which is currently at 3,290.80. This crossing occurred with a green candle, however, the midpoint remains at the cycle line. For a valid signal, the weekly midpoint serves as a reference for confirming the crossing.
When the crossing is unclear, like last week, we require confirmation from the next trending candle. This week, the gold bullion must produce a bearish candle well below its cycle line to confirm that it has indeed crossed below it. If confirmation occurs, the potential downside target will be 3,070.70.
The last 20-week cycle low was established in April 2025, with the next one scheduled for the end of August, indicated by the green vertical dashed line. The green trend line represents the 20-week cycle trend line, or the 20-week VTL. If the gold bullion market crosses this line, it will confirm that the 3,509.90 all-time high is at least a 40-week cycle peak, and it will also validate the crossing of the cycle line.
Even if the gold market dips below its cycle line and the VTL, it remains in a bullish state until the monthly time frame crosses below its cycle line.

Regarding the 80-day cycle.
The triangle formation is clearer on the daily chart. Trading opportunities within a triangle can be tricky, but through cycle analysis, we can pinpoint successful trading opportunities, especially on very short-term time frames, like the 40 days and lower.
However, let’s focus on the 80-day cycle for now. In the last update, I anticipated the 80-day cycle to hit a low on June 16, but it appears to have extended longer than expected. The last low is now placed on June 30, making this 80-day cycle 13 days longer than Hurst’s nominal model, which averages 68 days long.
An 81-day cycle is slightly extended but not impossible, especially within a triangle formation. When the market forms a triangle, it indicates that traders and investors are waiting for news. The next 80-day cycle low is expected to occur in the first week of September, marked by the purple vertical dashed line.
Due to the rule of synchronicity, the gold bullion will also form the 20-week, 40-week, and 18-month cycles simultaneously, making the September low particularly significant. So far, the market has remained bullish, with only one trading signal triggered since the start of the year.
This positive signal has a success rate of 100%, is rare for an 80-day cycle to yield only one trading signal over more than six months. During the next 80-day low, the gold bullion is expected to cross below its cycle line, indicating a downside target. However, the prevailing bullish sentiment in the gold market suggests a possibility for the market to reach a new high before the next low in September.

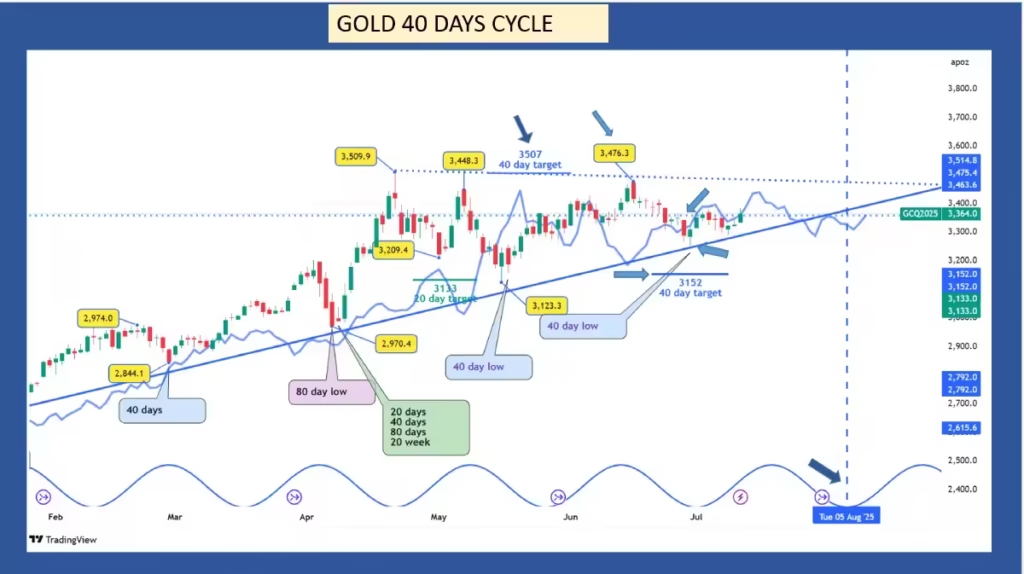
Let’s discuss the 40-day cycle.
The previous 40-day cycle low occurred on June 30, coinciding with the last 80-day cycle.
This cycle was also longer than the nominal average of 34 days, which may explain the stretching of the longer cycles. The next cycle is anticipated to form on August 11.
Reviewing what has happened since my last update,
I had expected a bullish candle to cross above the cycle line on the Monday, on that day, the gold bullion confirmed the bullish crossing and validating the target of 3,507.
On June 16, with a peak at 3,476.80, the gold bullion fell short of the target by just $30, or 0.87%.
Since the high was within a 1% margin of error, the target is considered met.
With one positive trading signal out of two, the 40-day cycle has a 50% success rate. ,
After reaching its peak on June 16, the gold bullion crossed back below its cycle line at 3,314 on June 30, providing a downside target of 3,152. This target remains valid until the gold bullion crosses back above with a very bullish candle
Short-Term Trader Corner
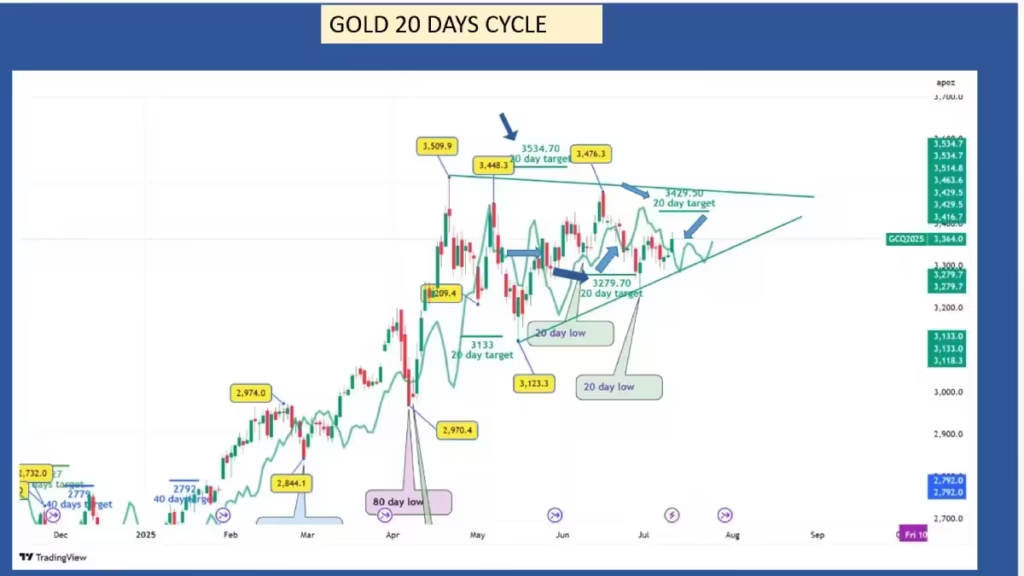
Let’s take a closer look at what we can expect over the next 20-day cycle. Since the beginning of the year, this cycle has proven to be particularly productive, yielding 4 positive signals out of 5, which translates to an impressive success rate of 80%.
The most recent trading signal occurred on May 23, when gold bullion crossed above its cycle line at 3,330, setting an upside target of 3,534. On June 16, the gold market reached a high of 3,476.30, narrowly missing its target by $58 or 1.60%. This marked the first instance since January that the gold market failed to hit its target.
On June 23, the gold market fell back below its cycle line at 3,378, with a downside target set at 3,279.70. Then, on June 30, the market dipped to a low of 3,250.50, slightly exceeding its target by $29 or 0.89%.
The latest signal was last Friday, July 11, when gold crossed at 3,340, aiming for an upside target of 3,429.50. However, to validate this target, we need to see a bullish candle on the trading day.
If we consider all the signals from the beginning of the year, we have recorded 4 positive trades and 1 negative trade, resulting in a total profit of 446 dollars, for only 1 contract and depending on the trader’s strategy. Personally, I believe that the best way to trade gold bullion is through the ETF GLD and utilizing the options market. Please note that this is not a trading recommendation; it is merely my personal opinion, as trading options can be quite risky.
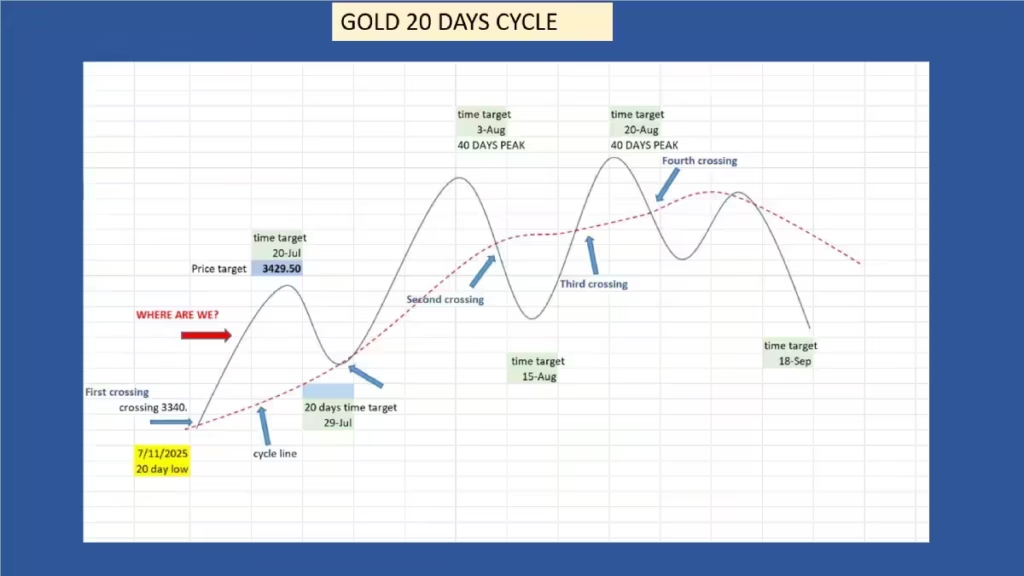
Now, let’s examine what we can anticipate for the next two months. Starting with the low from June 30, the first crossing on July 11 occurred at 3,340 for a target of 3,429. The gold market is expected to reach this target during the upcoming 20-day peak formation around July 20, plus or minus two days. After this peak is formed, the gold bullion will likely begin a correction, coinciding with the next 20-day low cycle expected on July 29. This low should occur on its cycle line, after which a rebound will elevate the gold market to the 40-day cycle peak around the end of July or the beginning of August.
Technically, after forming its 40-day cycle peak, likely around August 3, the gold bullion should cross below its cycle line, setting a downside target for this 20-day cycle low. According to the rule of synchronicity, this will also coincide with the 40-day low, which is anticipated to form around August 15. Depending on the level of bullish sentiment in the gold market, there is also a possibility that the market will establish its low on its cycle line rather than crossing it during the next 40-day cycle low formation.
Following the formation of the 40-day low, the gold bullion market is expected to cross its cycle line for the third time, establishing an upside target for the 80-day cycle peak. Finally, for the fourth and last time, the gold market will cross its cycle line again, this time on the downside, projecting a downside target for the low of the next 80-day cycle, which should occur around September 18. Before reaching this low, the gold market will likely experience a preliminary low before rallying toward its cycle line, represented by the red dotted line, without crossing it, serving as resistance before heading down to the low.
All dates are calculated according to the Hurst nominal model. If one low occurs on a different date, the other dates will also need to be adjusted using the same nominal model, while adhering to the rule of variation. In conclusion, this trading cycle is expected to last around 68 days.
In conclusion
The gold bullion is currently in a trading range within a triangle pattern. We anticipate a significant low in September. Before this major low forms, there is a chance for the gold bullion to reach a brief new all-time high. Regardless of how the gold bullion exits the triangle, the ensuing movement is likely to be sharp.
—