
THE FUTURE LINE OF DEMARCATION (FLD )
For me the future line of demarcation, is probably the most powerful trading tool in the J.M.Hurst cycles theory.
This tool, when applied correctly, helps traders and analysts predict future price movements and identify potential turning points in financial markets
The FLD represents the future price level that the market is expected to interact with based on historical cyclical patterns.
The Future Line of Demarcation is a projection tool that Hurst developed as part of his cyclical analysis
By projecting this line into the future, analysts can anticipate potential support and resistance levels, as well as possible reversal points.
We will see below the different uses of the future line of demarcation, but first left’s start by the definition of the future line of demarcation.
DEFINITION:
It is essentially a displaced moving average, typically a simple moving average (SMA), which is shifted forward by half the period of the cycle being analyzed
The future line of demarcation is a price move predictors.
There is an FLD associated with each wave of a cyclic model.
CONSTRUCTION THE FLD:
The Construction of an FLD consists essentially of shifting past prices into the future by a calculated time span called the FLD number.
The first step in the construction of an FLD is to calculate this FLD number.
Determine the length of the cycle you are analyzing. This could be any period from the nominal model.
The FLD number is derived as follows:
- Divide the period of the wave on which the FLD is based by 2, and add 1 to this and Round the result to the nearest whole number.
Example determination of an FLD number for a wave with a period of
17.5 days:
- Divide the wave period by 2 = 17.5/2 = 8.75
- Add 1+ 8.75 + 1 = 9.75
- Round to the nearest whole number: 9.75 becomes 10
- Therefore, the FLD number corresponding to the 17.5 days wave is 10 days.
PLOTTING THE FUTURE LINE Of DEMARCATION
Once the FLD number has been calculated, the corresponding FLD is drawn on the price-bar chart as follows.
First, calculate the mid-point of the day, week or month.
To calculate the mid-point, take the high add to the low and divide by 2.
If today’s high is 5340 and the low 5285, then the mid-point will be 5312.5
this mid-point will be used to construct the future line of demarcation.
- Note the most recent price-bar on the chart, (day A)
- counting this last price-bar as one, continue to count price
bars to the left, one time unit at a time, until the FLD number, which is 10,
3 Note the mid-point price for the price-bar reached at the end of the count.
4 Plot the value of this average price in the first future time position on the chart (one time unit to the right of the most recent price bar plotted).
- Now note the average price of the price bar immediately to the right of the one found by counting back the FLD number.
Plot this average price in the second future time position (two time units to the right of the most recent price-bar plotted).
6) Continue in this manner until you run out of price bars or run out of space on the chart.
- Connect the plotted future-time average price values by short straight lines.
The result is the future line of demarcation for the wave from whose period the FLD number was derived.
If the FLD-number count should end on a time space when the markets were not open (daily charts only), connect the average prices of the two price bars on either side of the time gap by a straight line.
Use the price value of this straight line where it intersects the day of the needed average price.
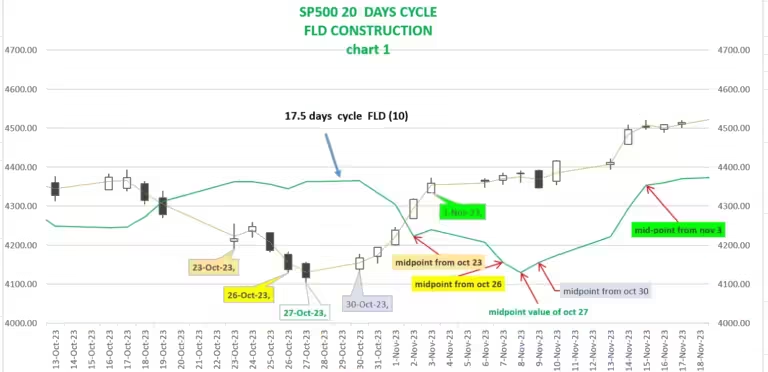
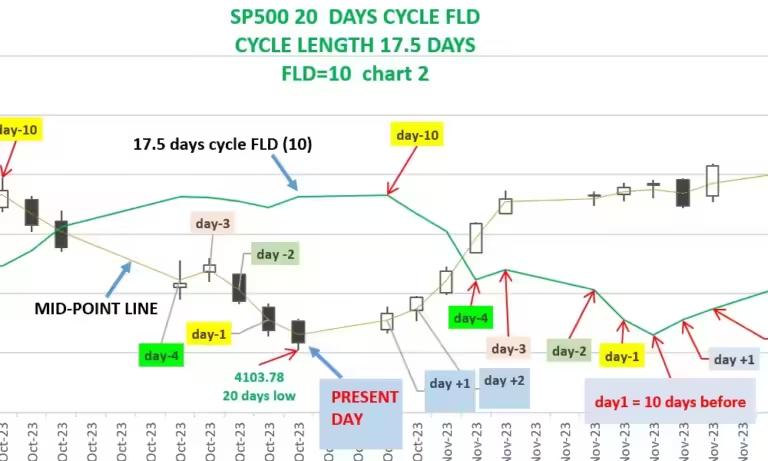
The above chart shows only one FLD, the one based on the price wave wit aa period of 17.5 days.
other FLD’s corresponding to all other waves in the applicable cyclic model could be drawn on the same bar chart.
But to have a clear picture of the market, I personally prefer to plot each FLD separately on his own chart.
The FLD is an extremely powerful tool of cyclic analysis, and it can be used in a wide variety of ways.
The one of the most important of these uses is the estimation, of the objective for a potential change in price, before a price reversal has even started, also the estimation of a potential price targets.
FLD’s work because of the actuality of the basic cyclic concepts and principles in equity price movement.
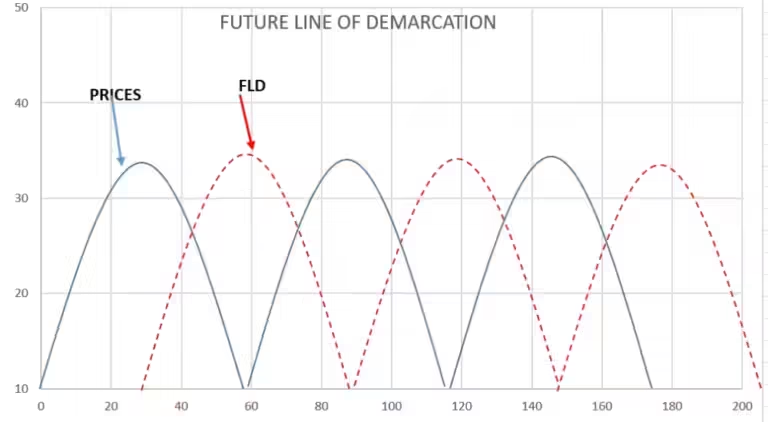
Applying the FLD process to a single, ideal wave results in a second wave that is identical to the first except that it is phase-shifted forward in time by essentially one-half of the wave period.
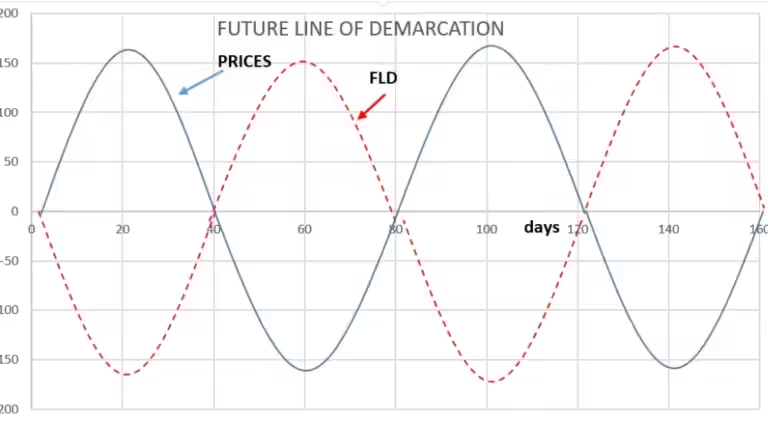
THE USE OF THE FLD
As indicated in the following chart, two such waves, are identical except for a phase,
The difference is one-half of the wave period, exhibit three useful characteristics:
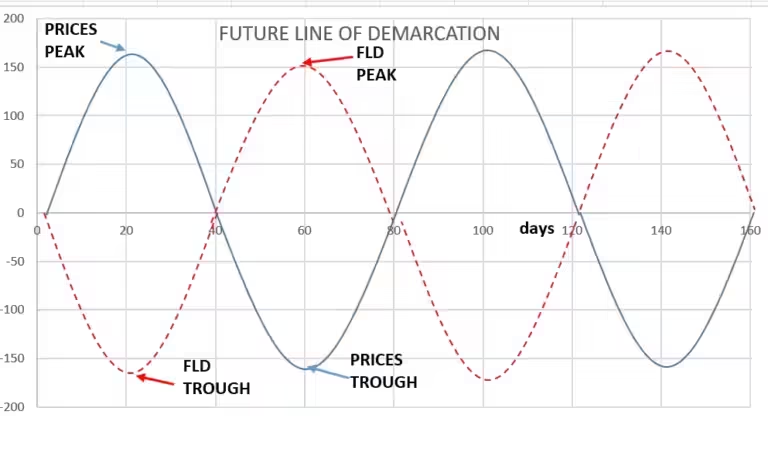
- When the FLD of the wave is forming a trough in the future, that is where the price wave will form a peak when that future time has arrived.
- Similarly, when an FLD forms a peak in future time, it is implied that price action caused by the associated price wave will probably form a trough in the vicinity of the same time in the future.
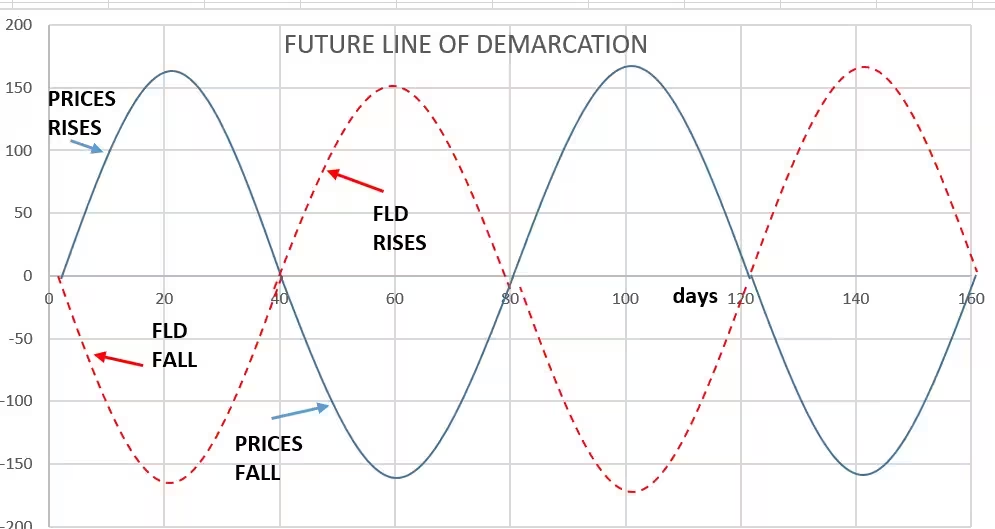
When the FLD of the wave is moving down in the future, that is where the price wave will be moving up when that future time has arrived.
Similarly, when the FLD of the wave is moving up in the future, that is where the price wave will be moving down when that future time has arrived.
When the price wave moves up through its FLD, the price wave has formed a trough one-fourth of the wave period in the past, and the price wave is one-half as far up as it is going to go for that cycle.
Similarly, when the price wave moves down through its FLD, the price wave has formed a crest one-fourth of the wave period in the past, and the price wave is one-half as far down as it is going to go for that cycle.
Dynamic Support
The FLD can act as a dynamic support and resistance level.
Prices often interact with the FLD, bouncing off it or breaking through it, which can provide valuable, support, resistance point and entry and exit points.
The more the FLD’s that are below prices, the more vulnerable prices are to a downward reversal.
The more FLD’s that are above prices, the more vulnerable prices are to an upward reversal.
The FLD’s as the magnet effect, with FLD’s tending to draw prices toward themselves.
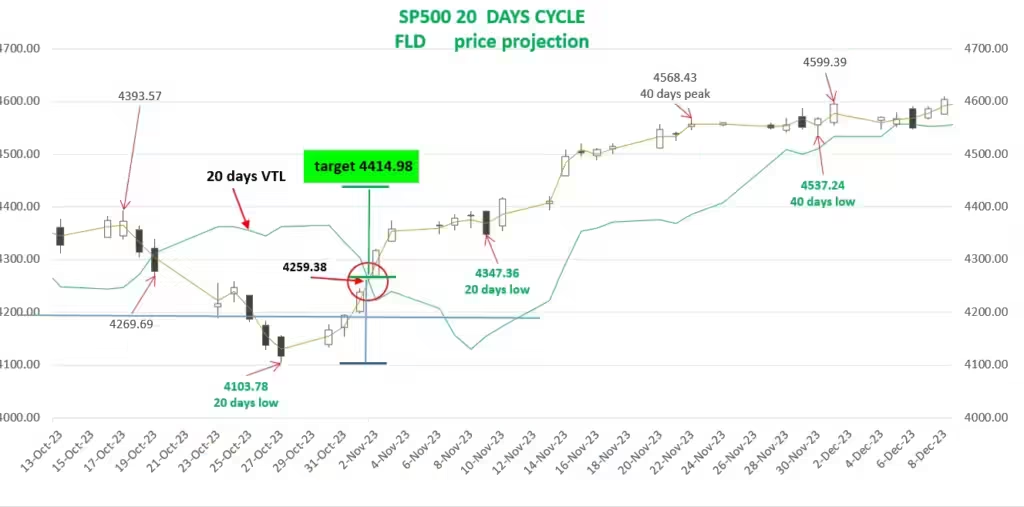
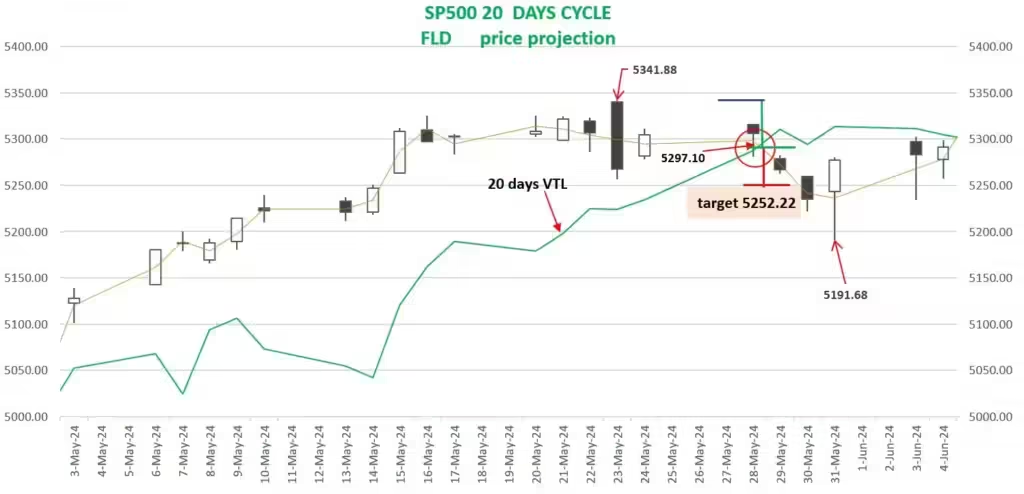
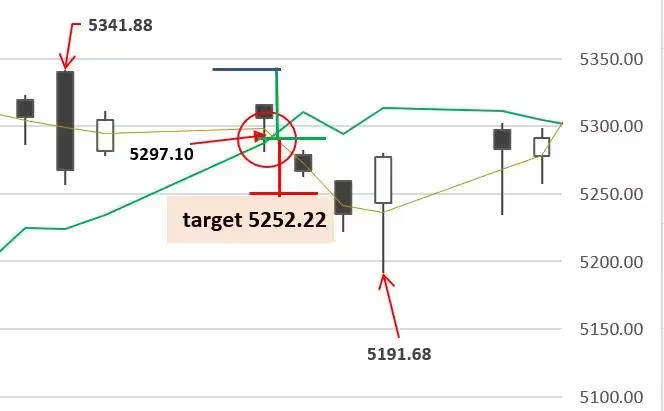
PRICES TARGET:
Another way to use the FLD to predict the future potential prices,
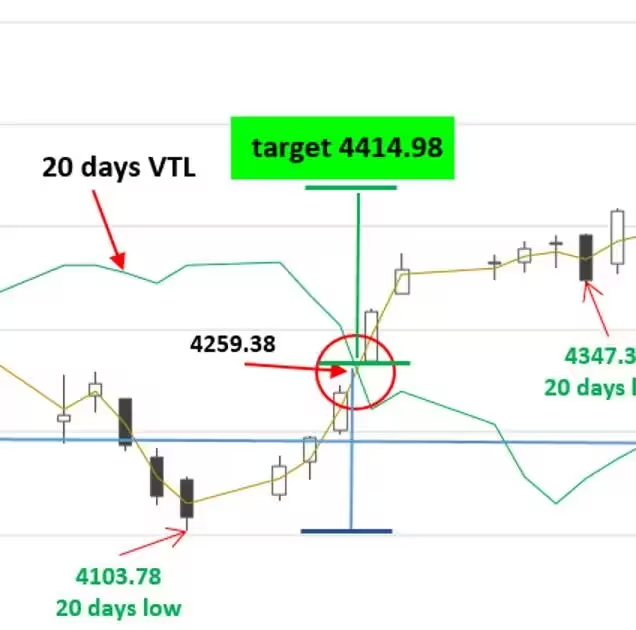
When prices have been below an FLD and then break above it, at the time of the breaking point, we should measure the difference from the crossing point to the last lowest point below the FLD before the crossing,
Then add this number to the crossing point, this will estimate a minimum price target for this particular cycle.
When the price crosses the FLD from above, it is typically a bearish signal, suggesting a potential decline
When prices have been above an FLD and then break below it, at the time of the break ,we should measure the difference from the highest point above the FLD before the crossing point , Than subtract this number from the crossing point, this will estimate a minimum price target for this particular cycle.
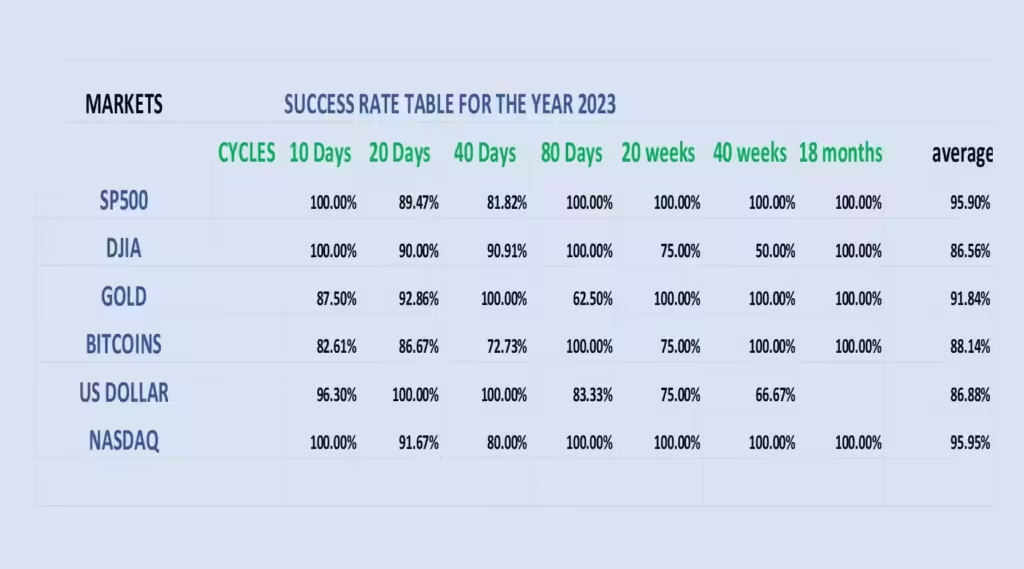
Below is the success rate table for the year 2023,
The accuracy rate from the Fld crossing signal on the upside and downside, is usually very high,
This table help to choose which market and which cycle to trade with the higher probability of success.
The past performance is not guarantee of future results.
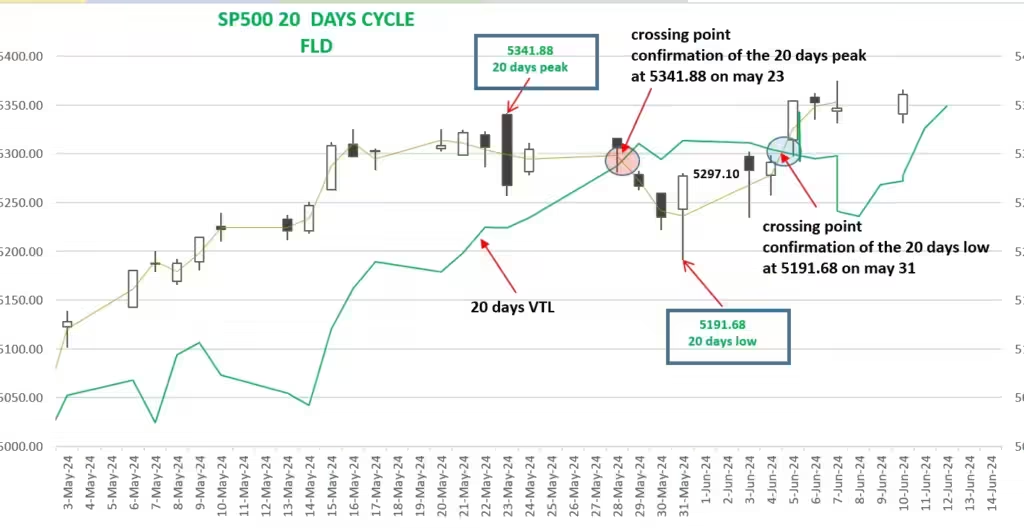
IDENTIFYING THE END OF THE CYCLE
The FLD can help confirm the presence and length of a market cycle.
When prices move in accordance with the FLD predictions, it reinforces the identified cycle length.
When prices have been below an FLD and then break above it,
at the time of the break, we have the confirmation of the low of this particular cycle.
In other words, if the prices of the 20 days cycle cross above the 20 days FLD, this will confirm the precedent low is the 20 days cycle low.
When prices have been above an FLD and then break below it,
at the time of the break we should, we have the confirmation of the peak of this particular cycle.
In other words, if the prices of the 20 days cycle cross below the 20 days FLD, this will confirm the precedent higher high is the 20 days cycle peak.
Very important precision, prices are said to break an FLD when, is only the midpoint line falls on the opposite side of the FLD from the side it has been on in the recent past, and not the bar chart.
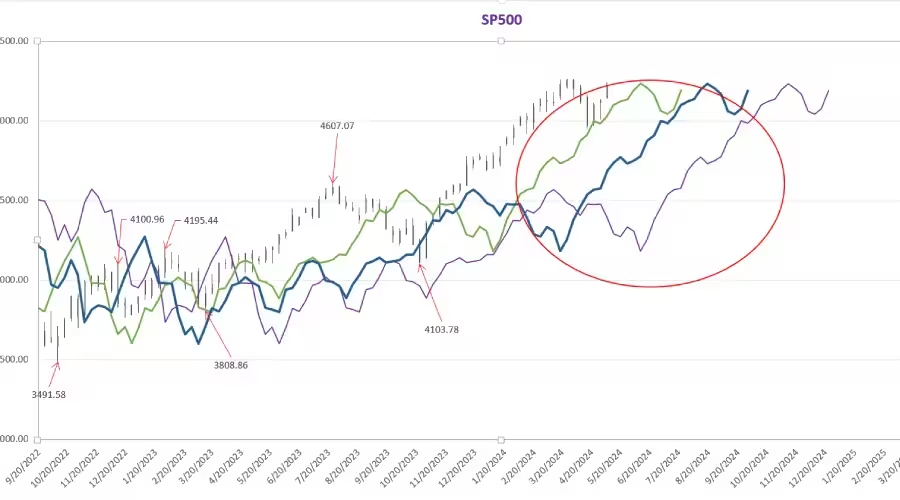
MULTIPLE FLD’s.
The cascade effect
Cascade effects occur due to the interaction between multiple cycles.
When several cycles align, they reinforce each other, leading to amplified price movements.
When a number of FLD’s are all moving steeply in the same direction (up or down), and they are evenly spaced and parallel with respect to each other,
We can expect a price reversal, when it comes, is likely to be large and swift.
We call that the FLD Cascade Effect.
FLD’s may arrange themselves so that a break of one FLD projects a price move that implies a break of the next.
A cascade stops, when prices the price projection is between
FLD’s, when prices project into a reversal pause zone, or when there are no more FLD’s to be broken in the direction that prices are moving.
Irregular spacing, with wide gaps between some FLD’s and narrow gaps between others, implies a spotty or weak potential price reversal.
When FLD’s are flat (horizontal), they are unlikely to be broken by a potential price reversal.
Conclusion:
The Future Line of Demarcation is an innovative approach to market analysis.
By providing time and prices projection of market cycles, the FLD offers traders a unique perspective on future price movements.
When used correctly, it can enhance the accuracy of market predictions and improve trading outcomes.
However, like all analytical tools, the FLD should not be used in isolation.
It is most effective when integrated with a comprehensive trading strategy that includes other technical indicators, risk management, and a thorough understanding of market dynamics.
29 Responses