

“DOW JONES: Major Cycle Top Approaching? (Hurst Analysis)”
DOW JONES: Major Cycle Top?
This the first time I published an update on the Dow Jones Industrial Average index.
Last year in April 2024, I made a video, see my YouTube channel.
Basically the Dow Jones Industrial Average index match the S&P500, but for different reasons, some traders feel more comfortable trading the Dow Jones Industrial Average index, that the reason of this post.
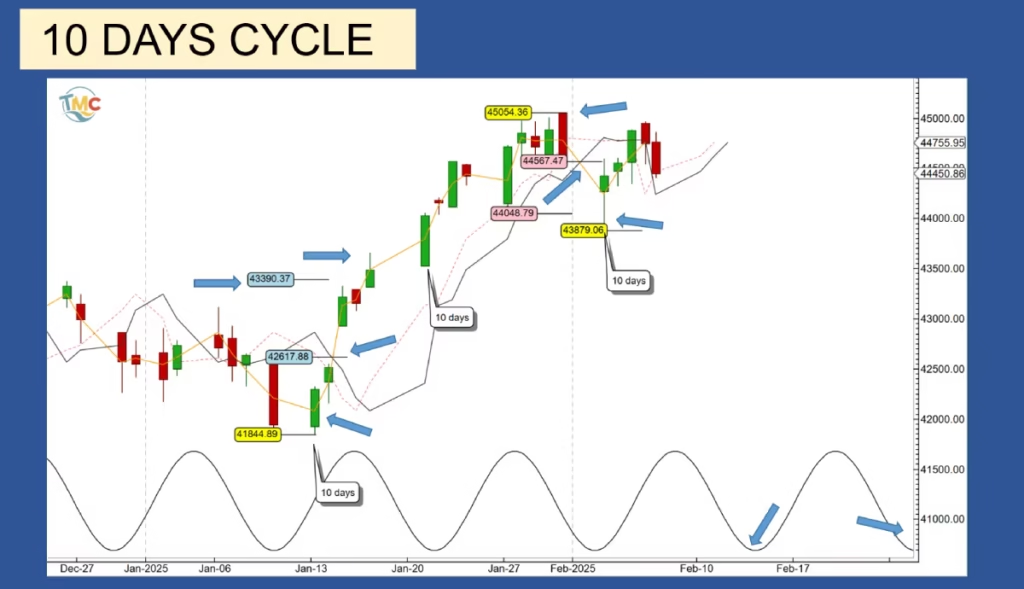
For the short term traders let’s start with the 10 days cycle.
From the January 13 2025 from his last major low, the Dow Jones Industrial Average 10 day’s cycle give 2 trading signals and both of them has been successful.
The first signal was on January 15, when the market crossed above his cycle line at 42617.88 providing an upside target at 43390.37.
On January 17, two days later, the Dow Jones Industrial Average meet his target and 4 days later as expected, the index made his first 10 days cycle low.
Then rally up to the January 31, 45054.36 high, shy of his all-time high.
This day was reversal day since the market made a red candle.
On February 3, the Dow Jones Industrial Average give the second signal by crossing below his cycle line at 44567.41 for a downside target at 44048.79, on the same day the Dow Jones Industrial Average made a low at 43879.06, just 169.73 points below his target, for a second success trade.
These two trade give a profits of 1291.17 points.
Then the market rebound but failed to cross above his cycle line and give a new upside target.
Technically after forming his second 10 days cycle, the market supposed to cross above his cycle line and give and give an upside target.
For the past two trading days Thursday and Friday the market trade along his cycle line with a red candles, this is usually bearish for the market, at least for the very short term.
If Monday the market cross below his cycle line, then we will have a potential downside target at 45121, or 621 points of potential profits.
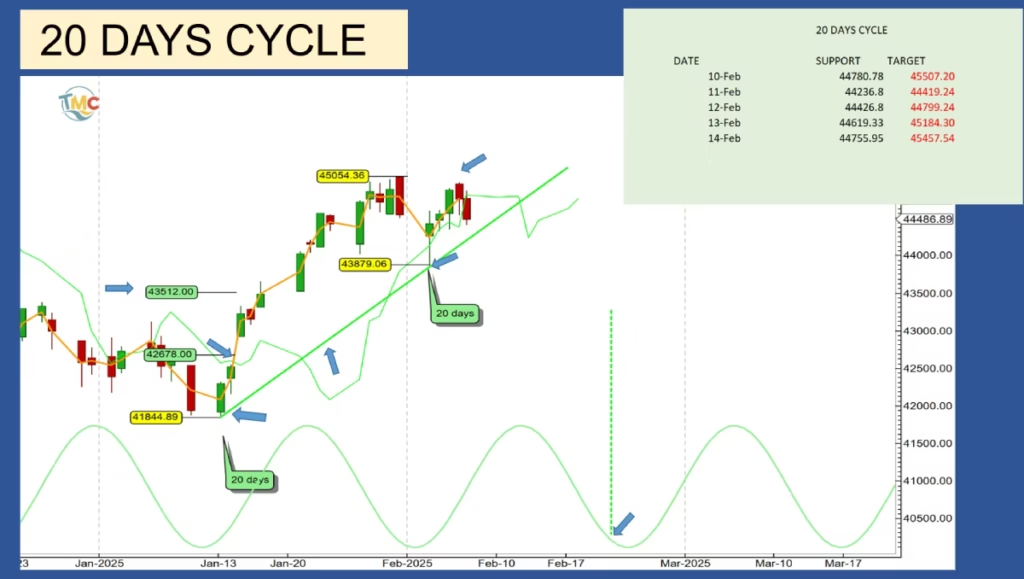
The 20 days cycle.
The last major low on the Dow Jones Industrial Average index, was on January 13 2025, when the index formed his 20 weeks cycle low.
Due to the Hurst synchronicity principle, all the lower time frame also formed their lows at the same time.
Since this low, the Dow Jones Industrial Average crossed above his cycle line at 42678 and provide a potential upside target at 43512, 834 points or 1.95%.
Two days later the Dow Jones Industrial Average meet his target for a profit of 834 points in only 2 days.
This was the first trading signal for this year, and this signal was a success, giving a 100% success rate so far for this beginning of the year.
On February 3, 3 days later than expected the Dow Jones Industrial Average index, formed his first 20 days cycle low, and as expected for the first low after a major low, the market found support on his cycle line.
Since this low formation, the rebound was very weak.
The next 20 days cycle low is expected on February 21, during the next low formation the market should cross below his cycle line, providing a downside target.
On the top right corner there is a table with the cycle line for this week and their potential targets if the market cross below this week.
From the January 13 low to the February 3 low, I draw the 20 days cycle trend line, when the market will cross below it, this will confirm the 20 days cycle peak has formed, but not only the 20 days but also the 40 days cycle peak.
If the February 6 high was the 20 days cycle peak, then we can expect a sharp correction, because in this case the peak will occur on the left part of the cycle, which is negative for the market.
Since we use the 20 days cycle line to trade the 80 days cycle, during the 80 days cycle analysis, we will have more details about what to expect for this 20 days cycle.
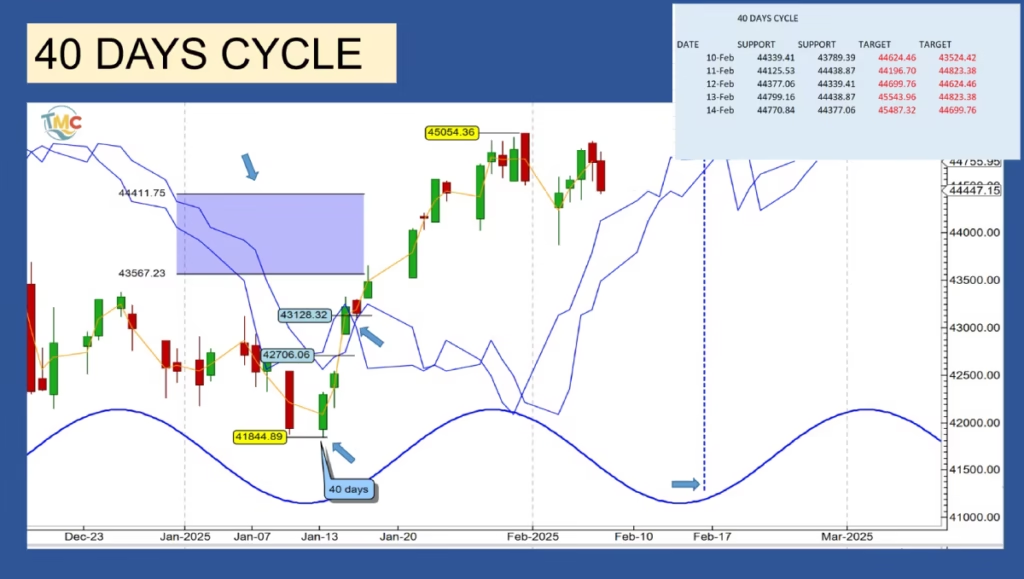
The 40 days cycle.
The last 40 days cycle formed his low on January 13 2025.
The next one is expected to form on February 16.
On January 16, the Dow Jones Industrial Average crossed above his cycle lines at 42,706 and 43,128,
at the same time the crossing provide a target zone between 44,411 and 43,567.
The next day, the Dow Jones Industrial Average enter the target zone and continue his rally to the 45,054 high, short of 19.27 points to make a new all-time high.
This is the first sign of some weakness coming to the market.
Technically at the time of the first 40 days cycle low formation after a major low, the market should find support on his cycle line, but since it looks like the market start to losing steam, there is a possibility the Dow Jones Industrial Average will cross below his 40 days cycle line.
The weakness will be confirm if the 45,054 high, is the 40 days cycle peak, in this case the 40 days cycle peak will be on the left part of the cycle, we call that the left time translation, which is negative for the market.
On the top right chart, you will find the cycle lines and their potential targets if the market cross below his cycle lines this week.
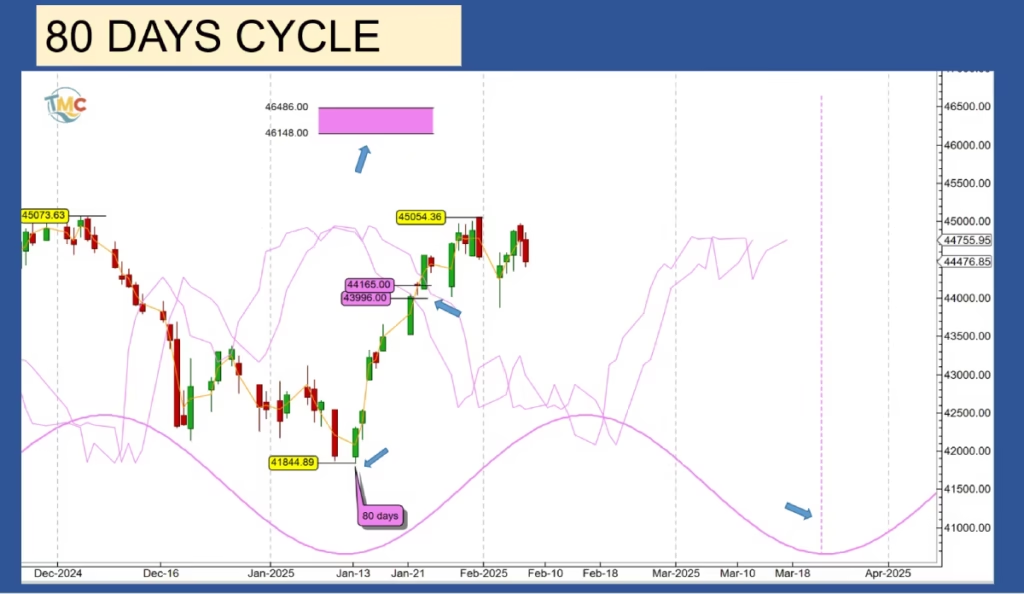
The 80 days cycle
On January 13, the Dow Jones Industrial Average formed his last 80 days cycle low.
On January 23 the market crossed above his cycle lines at 43,996 and 44,165, providing an upside target zone between 46,486 and 46,148, a new all-time high.
It is very important to watch where the market will form his next 80 days cycle low.
Technically the Dow Jones Industrial Average, should form his low on his cycle line on March 20, on the vertical purple dashed line.
For now is still little bit too early to know where they going to be on March 20, we will have this information by the end of this week,
It is crucial the Dow Jones Industrial Average stay above his cycle line during the formation of the 40 and 80 days low.
Let’s see on the roadmap what we can expect for the next 2 months.
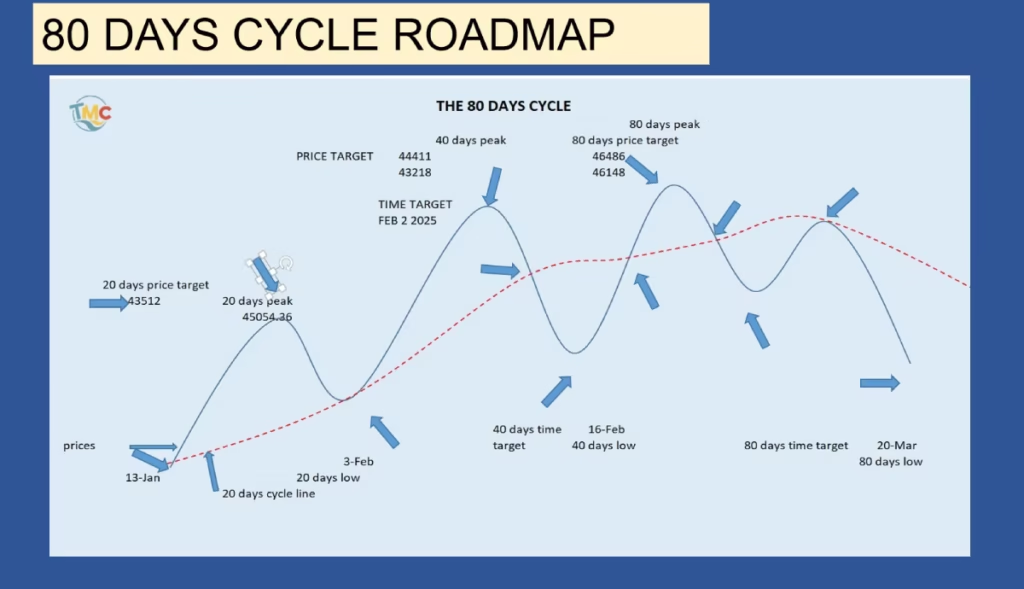
The 80 days roadmap
This 80 days low started on the January 13, then like expected crossed above his cycle line at 42,678 providing a 43,512 target.
On January 31 the Dow Jones Industrial Average formed his peak at 45,054.
As expected the market formed his low on his cycle line, but 3 days later than expected.
Then the market star a news rally on his way to the 40 days cycle peak.
It is very important to know where the market 40 days peak will occur compare to the cycle peak.
The cycle peak is expected on February 2, if the market form his peak before this date, this will be negative for the market and we can expect a sharp correction, if it’s happened on the right part of the cycle, at least 3 or 4 day after the February 2, then we can expect a moderate correction.
When the 40 days peak will be confirm, the Dow Jones Industrial Average will cross below his cycle line providing a downside target for the 40 days low.
After the formation of the 40 days low will be confirm, the market will cross back above his cycle line providing an upside target for the 80 days peak.
When the 80 days peak will be form, then the Dow Jones Industrial Average will cross again below his cycle line, giving a target for the 80 days low, before reaching his 80 days low, the market will for form a first low around beginning of March, then will rally toward his cycle line and using it as resistance before resuming his decline on his way to the 80 days low on March 20.
It is very important this low occur on or above his cycle lines.
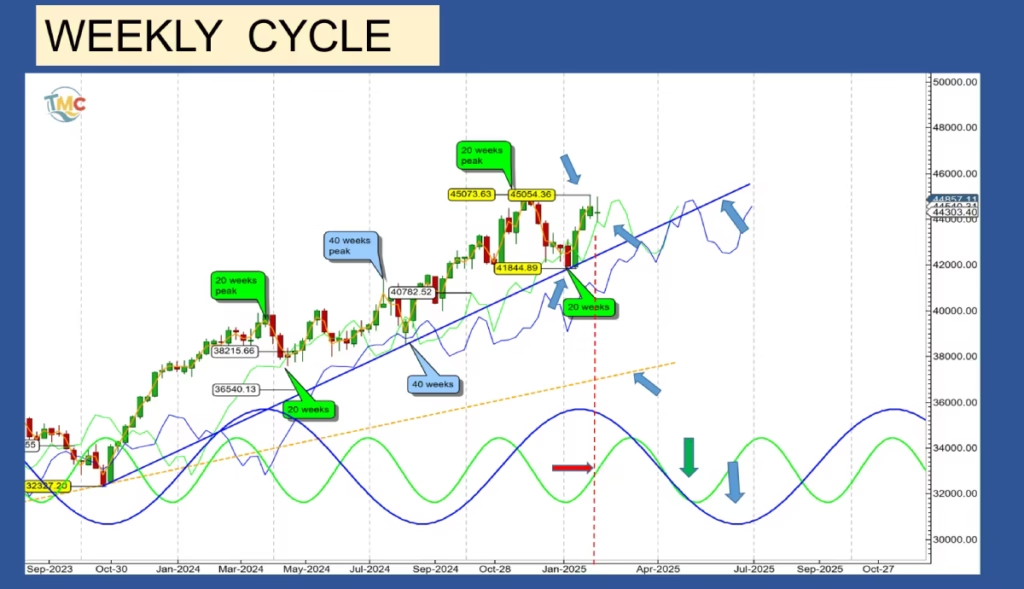
The weekly cycles
Like the S&P500, the Dow Jones Industrial Average formed his last 20 weeks cycle low on January 13 2025, then rebound and failed to make a new all-time high.
The Dow jones is trading very close to his 20 weeks cycle line, the green line on the chart, if the market cross below his cycle line in the next two weeks, then the 44054.36 could be the 20 weeks cycle peak.
Since this peak will occur on the left part of the cycle, what Hurst calls left time translation this could be bearish for the market, the red arrow and the red dashed vertical line.
In this case we can expect a sharp correction.
This 20 weeks cycle low will form at the same time then the 40 weeks and 18 month cycle low.
On the bottom of the chart the green sinewave represent the 20 weeks cycle, and the blue one the 40 weeks cycle.
Technically the market should cross below his 40 weeks cycle line, the blue line on the chart and provide a downside target, possibly to the orange dashed line, which is the 18 months cycle trend line.
When the market will cross below his 40 weeks trend line, ( the blue trend line) then this will confirm the 18 months cycle peak has formed and the Dow Jones Industrial Average will be on his way to his 18 months cycle low.
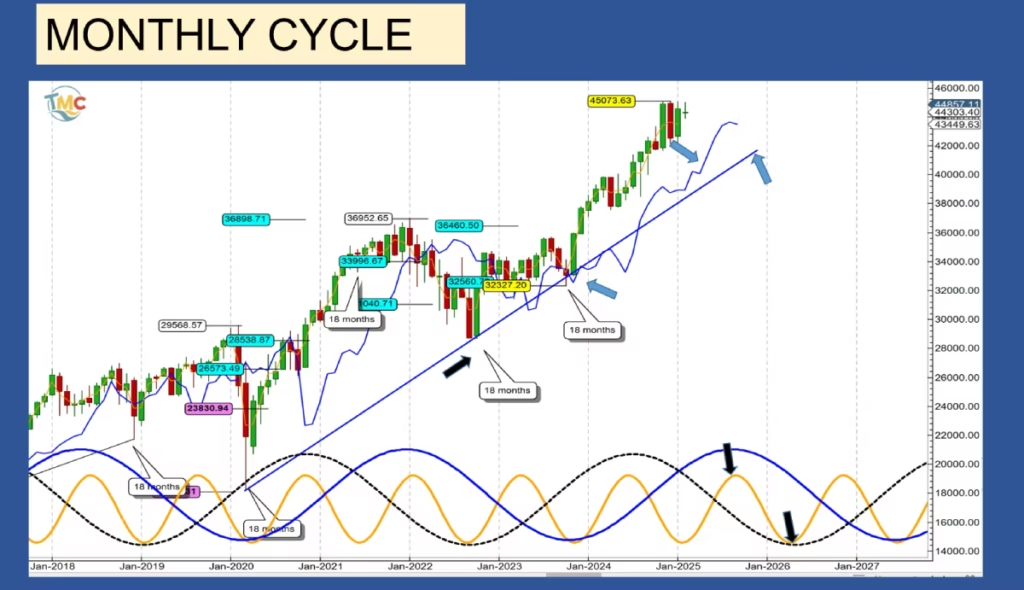
The Monthly cycles
The next 18 months cycle low is expected on the third week of May.
On the chart the last 18 months cycle low was in October 2023.
This cycle was only 12 months long, shorter than the Hurst nominal model which is 18 months.
Since that low, the Dow Jones Industrial Average keep moving up until making a new all-time high in December 2024.
This high could be the actual 18 months cycle peak.
The Dow Jones Industrial Average should now start his correction to his 18 months low.
The blue cycle line, (FLD) on the chart is the 18 months cycle line, this line is an important line to keep an eye on.
If the market cross below it, it will give a downside target.
Which cycle degree is the next correction?
Is it going to be an 18 months or a 54 months (4.5 years) cycle?
We have 2 scenarios to answer this question.
The first Scenario
This scenario is the most likely to happen and this is my preferred scenario.
On the bottom of the chart we have 3 different sinewaves, the orange one which represent the 18 months, the blue for the 54 months cycle is scenario 1 and the black dashed line for the scenario 2.
On the first scenario the last 54 months cycle formed his low in October 2023 and the next low is expected on mid-2027.
In this case we are in the first 18 months of the next 54 months cycle.
Usually the first 18 months cycle after the 54 months low is very bullish, the second one less bullish to neutral and the third one is bearish.
The rally from October 2023 was very bullish, if this scenario is correct then we can expect a moderate correction, the cycle line should be use as support. Then the market should rally to new all-time high to the next 18 months peak.
The next cycle peak is September 2025, and the low for April 2026.
This scenario will still valid until the Dow Jones Industrial Average cross below his cycle trend line, the blue line, which is the 54 months or 4.5 years cycle line, if the market cross sharply below, then we can start to considerate the second scenario.
The second scenario
In this scenario the last 54 months cycle low occurred on October 2022, the black arrow, the next one is schedule between May and September 2026.
In this scenario we are actually in the second 18 months of this 54 months cycle.
In this case the Dow Jones Industrial Average should cross below his cycle line and certainly his cycle trend line.
This second 18 months cycle is still expected during the third week of May 2025.
Then the market should rally to around September 2025, then start his sharp correction to his next 54 months low.
How we will find out which is the best scenario?
We will have the confirmation when the Dow Jones Industrial Average will cross below his 54 months cycle trend line.
When this will happen then we can switch to the second scenario.
Conclusion
The overall market is in top formation phase and very soon should start a major correction, this correction should be at least an 18 months cycle.
We can expect this correction end around the third week of May.