
Dow Jones Cycle Analysis 2026:
Is the 18-Month Peak Looming?
Introduction
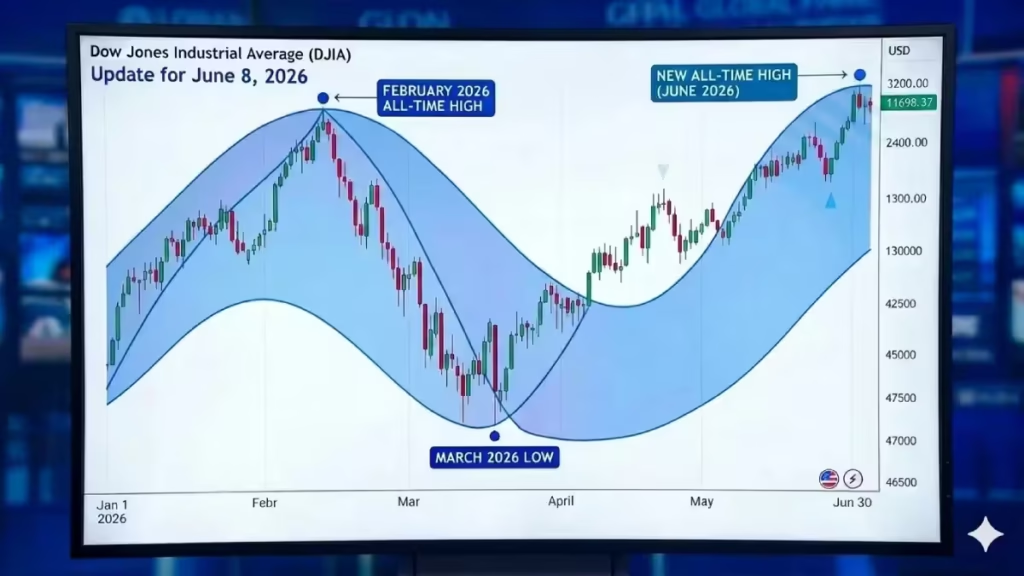
Welcome to our comprehensive Dow Jones Industrial Average (DJIA) cycle analysis for June 8, 2026. As the financial markets continue to navigate unprecedented waves of volatility and record-breaking momentum, identifying the underlying rhythmic patterns becomes vital for the modern trader. By using classic Hurst cycle principles, this technical breakdown peels back the layers of market noise to expose the dominant long-term and short-term trends driving price action. We will evaluate critical structural shifts, starting from the macroscopic 18-month cycle peak down to the highly precise 20-day trading waves. Whether the market is preparing for a major corrective phase or gearing up to extend its powerful bullish run, understanding these cycles offers a strategic roadmap. Read on to discover how current price targets, Future Line of Demarcation (FLD) crossings, and synchronicity rules can help refine your trading strategy and optimize your market timing over the coming months
The 18 Month Cycle:
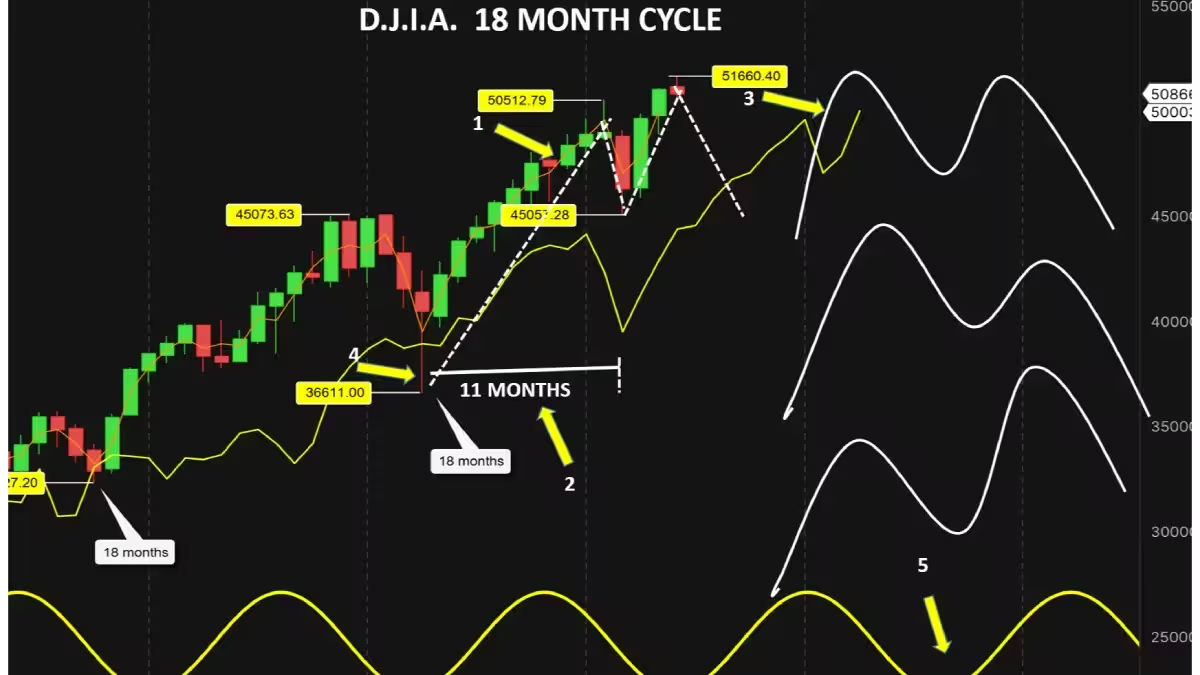
This week’s update will focus on the Dow Jones Industrial Average. Let us start with the long-term picture: the 18-month cycle. The 50,512.79 all-time high recorded on February 10, 2026 (arrow1), is part of the 18-month cycle peak. This peak formed after a 10-month rally (arrow 2), since the last 18-month cycle low occurred in April 2025. A 10-month duration lands right at the crest of the cycle; this would be the perfect place for the 18-month cycle peak.
If the February high is part of the 18-month cycle peak, why does the market keep making new all-time highs? Let us go back to the basics of cycle analysis. In the stock market, a major top has a rounded shape, opposite to a bottom, which is usually very sharp due to panic selling. In cycle analysis, a market top often forms an “M” shape (arrow 3). This means that during the top formation, there are two distinct peaks: one on the left side and one on the right side. These two peaks are the result of the next shorter sub-cycles.
The February high is certainly the first peak of this “M” shape, and the rally following the 45,057 March low is part of the second peak (the right side of the “M” shape). If the February peak is part of the 18-month cycle top, the subsequent rally gives us highly valuable information. Indeed, during a major top formation, if the second peak reaches the same level as the first one, it represents a neutral cycle; this means the next decline may drop back to where the cycle originally started. If the second peak forms much lower than the first one, it is bearish for the market, and we can expect a sharp correction following the second peak’s completion. The third possibility is when the market forms its second peak well above the first one; this occurs in a strong bullish market, and we can expect the next correction to be relatively moderate.
The March decline, as expected, found solid support close to its cycle line (arrow 4), and the next major low is now anticipated to form between August and September (arrow 5). Even though cycles are incredibly powerful tools for analyzing the markets, as mentioned in the past, there is no holy grail. Cycles do not tell the future; instead, they help us navigate through the inherent complexity of the markets. Sometimes it is not very easy to identify certain lows, especially within a highly bullish environment.
The alternative possibility is that the March low was actually the official 18-month cycle low, which in this case would make it only 11 months long. Under the Hurst nominal model, the 18-month cycle has an average duration of 17.93 months. To me, 11 months for an 18-month cycle is very short, but it remains entirely possible since we are in a very powerful bullish trend. Just as a reminder, in bullish trends, cycles have a tendency to run shorter than the nominal model, whereas in bear markets, they usually run longer.
The only structural clue in favor of this alternative analysis is that after crossing below its 40-week cycle line and missing its downside target, the DJIA crossed back above its FLD and crossed below its 40-week cycle trend line, or VTL (see the 40-week cycle analysis section below). We must keep this possibility in mind. If that is the correct analysis, we can expect another very bullish move ahead. However, for this week’s update, I will use my preferred scenario: the 18-month cycle low is still ahead of us, as this represents the most conservative approach.
From a practical trading perspective, is it critically important to identify the 18-month cycle low with absolute certainty right now? Not really. The 18-month cycle simply gives us the long-term macroeconomic picture. When we face some uncertainty about exactly where to place a major cycle low—which happens frequently in very bullish markets—we simply trade the shorter cycles that we are 100% certain have formed their lows. In this case, the cycle we are absolutely certain about is the 20-week cycle. By utilizing even shorter cycles, we should be able to precisely fix the ultimate position of the 18-month cycle.
The 40 week:
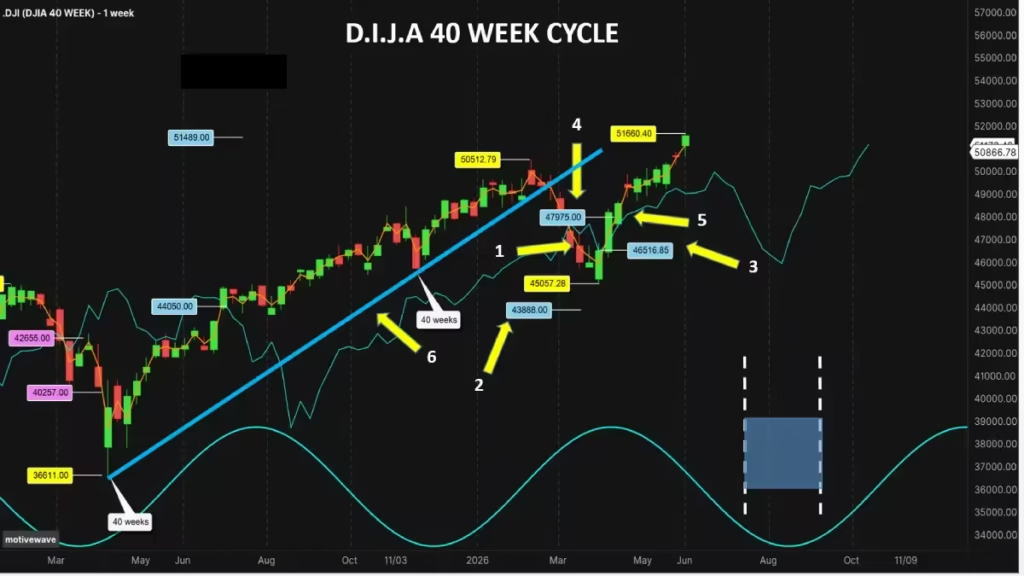
Since we have two 40-week cycles embedded within a single 18-month cycle, labeling its exact position is very difficult, as mentioned above. The only structural clue in favor of the alternate analysis is that after crossing below its 40-week cycle line (arrow 1), the D.J.I.A. missed its 43,888 downside target (arrow 2). The DJIA then crossed back above its FLD at 46,516 (arrow 3), providing a new upside target of 47,975(arrow 4), which offered 1,459 points or 3.13% of potential profit. The target have been met very rapidly (arrow 5). Additionally, during the March low formation, the Dow Jones Industrial Average crossed below its 40-week cycle trend line, or VTL (arrow 6), confirming that a potential 18-month peak is currently in formation.
With one positive signal out of two, the success rate for the 40-week cycle is 50 %.
But using my favorite scenario, which assumes that the major 18-month and 40-week cycle lows are still ahead of us, we can expect the 40-week cycle low to form between late July and August (the blue zone). Otherwise, if the 40-week low was already established back in March, then the next imminent move should be exceptionally bullish.
The 20 week:
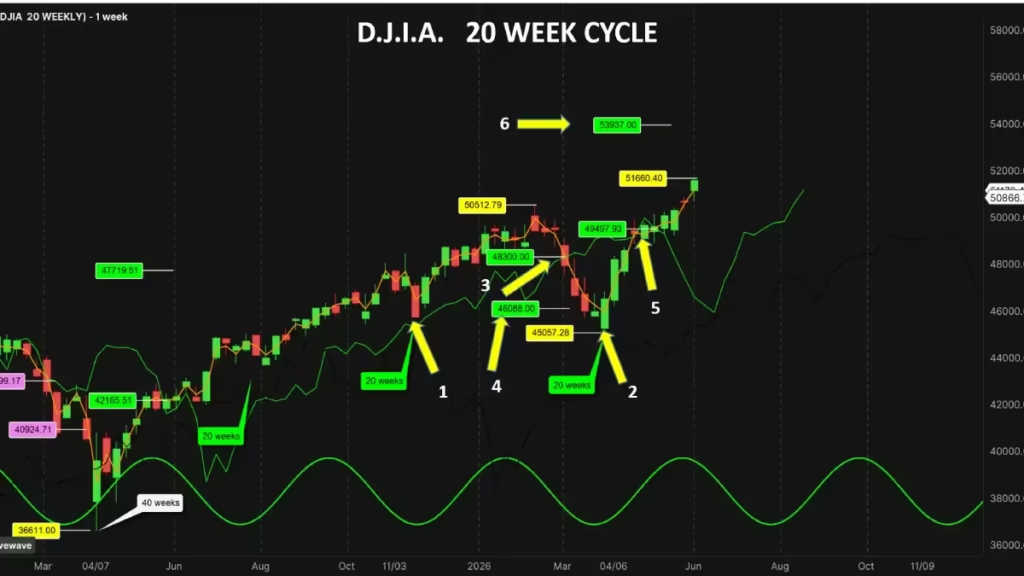
Exactly 19 weeks separated the November 2025 low (arrow 1), and the 45,057 March 30 low (arrow 2). On the Hurst nominal model, the average length for the 20-week cycle is 19.47 weeks. With high certainty, and regardless of the 40-week and 18-month cycle positions, we can comfortably label the March low as the official 20-week cycle low, exactly as expected during my last market update.
During the first week of March, the Dow crossed below its cycle line at 48,300 (arrow 3), providing a potential downside target of 46,088 (arrow 4). By hitting 45,057 on March 30, the market met and ultimately exceeded this target. Then, during the fourth week of May, the Dow Jones Industrial Average crossed back above its cycle line at 49,497 (arrow 5), triggering a 53,937 upside target (arrow 6), which represents 4,440 points or 9% of potential profit.
With one positive signal out of one, the success rate for the 20-week cycle stands at a perfect 100%.
During my last update, I was expecting the Dow Jones to rebound toward its cycle line, using it as an overhead resistance before resuming its decline into the fourth and final 20-week cycle of this 18-month period. However, the market is so incredibly bullish that it crossed cleanly back above its cycle line instead. We are still expecting the market to form its next major 20-week low during the second week of August.
The 80 Day:
On March 30, a new 80-day cycle officially began (arrow 1). On February 27, (arrow 2) the market crossed below its cycle line at 49,216, providing 47,920(arrow 3) as a potential downside target. On March 3, the market successfully met and exceeded this target on its way down to the 45,057 March 30 low. The fact that the market exceeded its downside target by more than 2,000 points proves that the March 30 bottom was a high-degree cycle low. This crucial statement may help us resolve the true 18-month and 40-week cycle positions.
In fact, from this point forward, there are only two real possibilities. After crossing above its cycle line (arrow 4) at 49,389 on April 22, the Dow Jones Industrial Average provided an active 53,721(arrow 5) upside target, representing 4,332 points or 8.77% of potential profit. Now, if the March 30 low was indeed the true 40-week cycle low, the Dow Jones Industrial Average should find firm support on its cycle line or FLD ( arrow 6) during the next 80-day cycle low formation. This will provide us with vital information. This low was originally expected to form around June 5.
If the market crosses sharply below its cycle line or FLD during the 80-day low formation on June 5, then this price action will give much more credit to our primary scenario, which projects that the 40-week and 18-month lows are still ahead of us. However, the fact that the Dow Jones Industrial Average formed its first 80-day low well above its cycle line heavily favors the highly bullish option—meaning the 18-month and 40-week cycle lows are already safely behind us. This is exactly where tracking the shorter cycles becomes incredibly helpful to identify the true status of longer cycles.
But again, we must keep the second option in mind. If this alternative analysis is correct and the 18-month low is behind us, then the American stock market cycles are running much shorter than the standard Hurst nominal model. In this case, it will be time to recalculate a brand-new spectral and phase analysis to establish the fresh average length of these active cycles. The next 80-day cycle low is currently scheduled to land around August 2(arrow 7).
So far, with one positive trading signal out of one, the 80-day cycle maintains a 100% success rate.
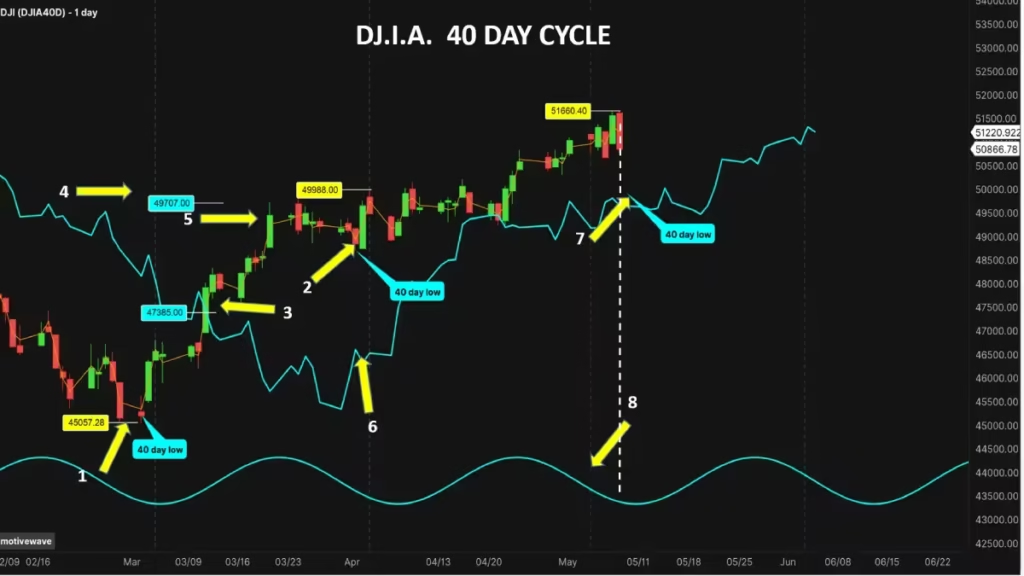
The 40 Day:
Since the last 40-day cycle low formed on March 30 (indicated by arrow 1), I was expecting the next one to materialize between late April and early May, with May 3 being the most probable target date. On April 29, (arrow 2) the Dow Jones Industrial Average formed a low at 48,708.57, officially marking the 40-day cycle low. This 40-day low arrived right on its expected time target.
On April 8, (arrow 3) the Dow Jones crossed above its 40-day cycle line at 47,385, providing a potential upside target of 49,707(arrow 4). On April 17, (arrow 5) the market cleanly met its target, locking in a 2,322-point profit projection. I was also expecting the market to form its next 40-day low directly on its cycle line (arrow 6); however, due to the immense amount of underlying bullish momentum, the Dow Jones formed its low well above its cycle line instead.
The next low, which by the Hurst rule of synchronicity will also double as the 80-day cycle low, should technically cross below its 40-day cycle line or FLD (arrow 7) to provide a downside target. But time is running out for this second 40-day cycle to establish its low; the optimal time target was June 5. Unless we witness a very sharp, sudden decline over the next few days, the sheer amount of bullishness makes it highly possible that the market will form its next low entirely above its cycle line. This second 40-day cycle peak formed on the right side of the ideal cycle wave (arrow 8), further confirming the strength of the bullish trend.
With two positive trading signals out of two, the 40-day cycle successfully maintains its 100% track record.
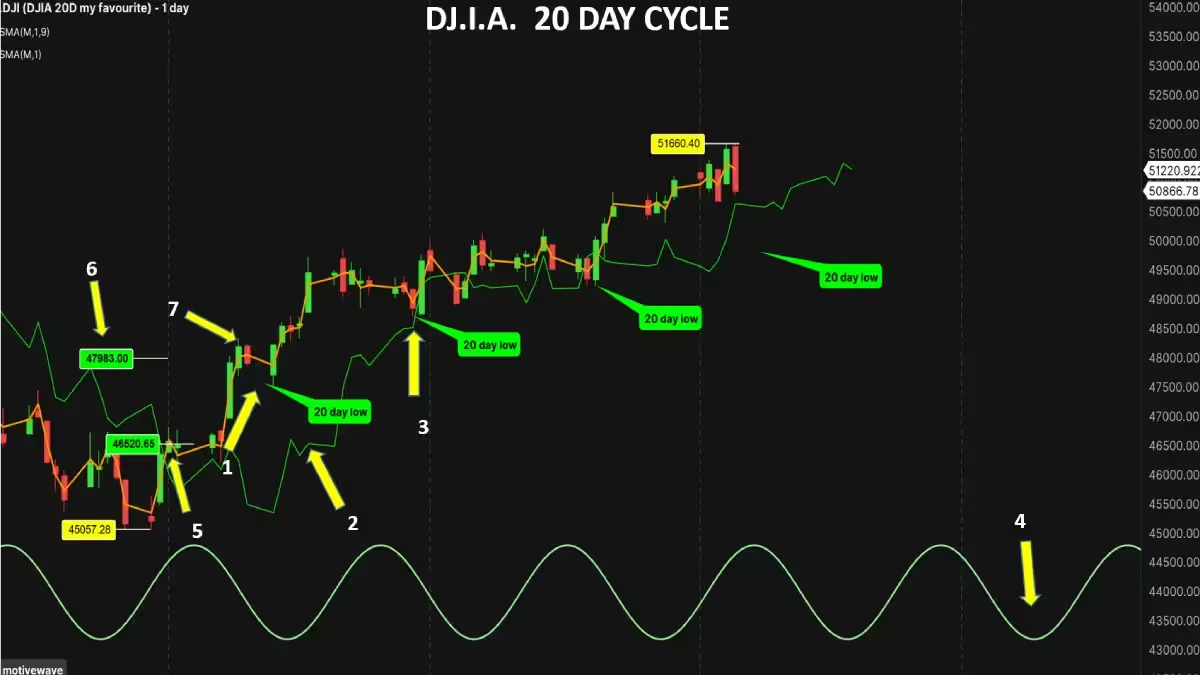
The 20 Day:
During my last update, I was expecting the next 20-day cycle low to form around April 18 (arrow 1). Instead, the low occurred on April 13, arriving four days early and confirming that the market is in an incredibly bullish mood. The subsequent lows formed right on schedule on April 30, then on May 19, and the next one was scheduled to land on June 4.
Another clear sign of persistent underlying bullishness is found during the first 20-day cycle formation after a major 80-day cycle bottom is established: the market is supposed to form its low right on its cycle line (arrow 2), but instead, the low formed well above it. The second 20-day cycle was supposed to cross cleanly below its cycle line or FLD, but it instead found support right on its cycle line (arrow 3). Following standard behavior, the third one should have formed well below its cycle line, as should the fourth one.
What is next for the 20-day cycle? The Dow Jones Industrial Average should keep trading above its 20-day FLD until at least July 6 (arrow 4). We will need to closely monitor exactly where the next 20-day cycle peaks form to see if they materialize on the left part or on the right part of the cycle wave.
On April 6, the Dow Jones crossed above its cycle line at 46,520 (arrow 5), providing an upside target of 47,983 (arrow 6). Due to the extreme velocity of the bullishness in the American stock market, this target was rapidly met on April 8 (arrow 7), securing a 1,463-point move. Since the start of the year, the 20-day cycle has provided five distinct trading signals. With five out of five positive signals, the overall success rate for this 20-day cycle remains at a perfect 100%.
Conclusion:
In conclusion, this technical look at the Dow Jones Industrial Average highlights the incredible utility of Hurst cycle analysis when decoding complex market behavior. While determining the absolute position of major macroscopic anchors like the 18-month and 40-week cycles presents an ongoing analytical challenge in highly bullish conditions, the shorter-term cycles offer invaluable clarity. The flawless 100% success rate across our 80-day, 40-day, and 20-day trading cycles proves that actionable, high-probability setups remain abundant. Traders should keep a close eye on incoming price interactions around the cycle lines and FLD targets through June and July, as these movements will ultimately reveal whether the macro cycle has shortened or if a larger corrective wave is looming for August. Stay disciplined, monitor the shift in cycle peaks, and let these synchronized time horizons guide your risk management parameters.