
Dow Jones Cycle Analysis 2026: 18-Month Peak and Price Targets
Introduction
Welcome to this week’s in-depth technical analysis at tradingmarketcycles, where we focus our lens on the cornerstone of American equities: the Dow Jones Industrial Average (DJIA). As we navigate the complex ebbs and flows of the 2026 market, understanding the underlying Hurst nominal cycles becomes paramount for any serious trader.
This week, we dive deep into a significant transition period for the index, following the recent historic highs. By applying time-tested cyclical models, we aim to demystify current price action and provide clear, actionable roadmap targets for the months ahead.
Whether you are tracking long-term shifts or short-term swings, this analysis breaks down the interaction between price and time, offering a comprehensive look at where the Dow stands in its current 18-month journey. Let’s explore how the recent crossing of cycle lines is signaling a shift in market regime and what it means for your portfolio.
The 18 Month Cycle.
This week, we will dive into the oldest American stock market index: the Dow Jones Industrial Average.
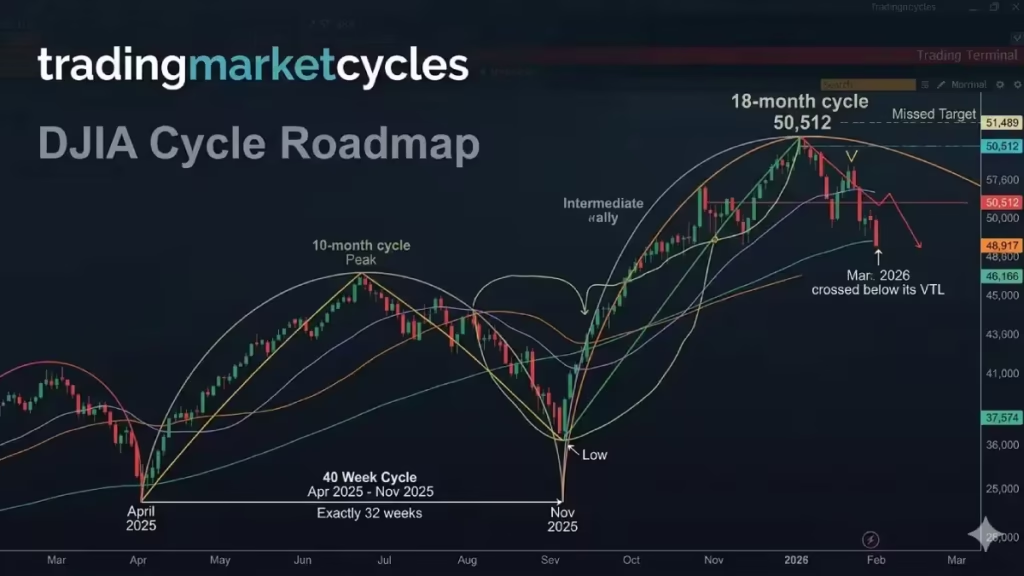
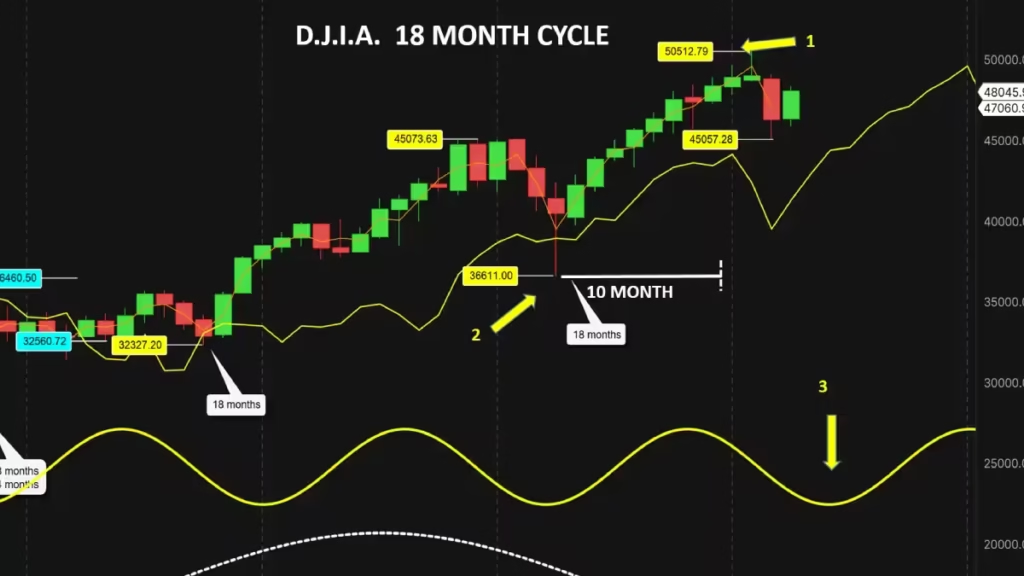
Let us start with the long-term picture, specifically the 18-month cycle. The 50,512.79 all-time high recorded on February 10, 2026, marked the 18-month cycle peak.
This peak formed after a 10-month rally; since the last 18-month cycle low occurred in April 2025, a 10-month duration lands right at the crest of the cycle, representing perfect timing. The 50,512.79 peak missed its 51,489 long-term 40-week target by 977 points, or 1.89%.
The next 18-month low is expected to form around September, but to obtain a more precise time target, we must analyze shorter cycles, such as the 40-week cycle.
The 40 week Cycle.
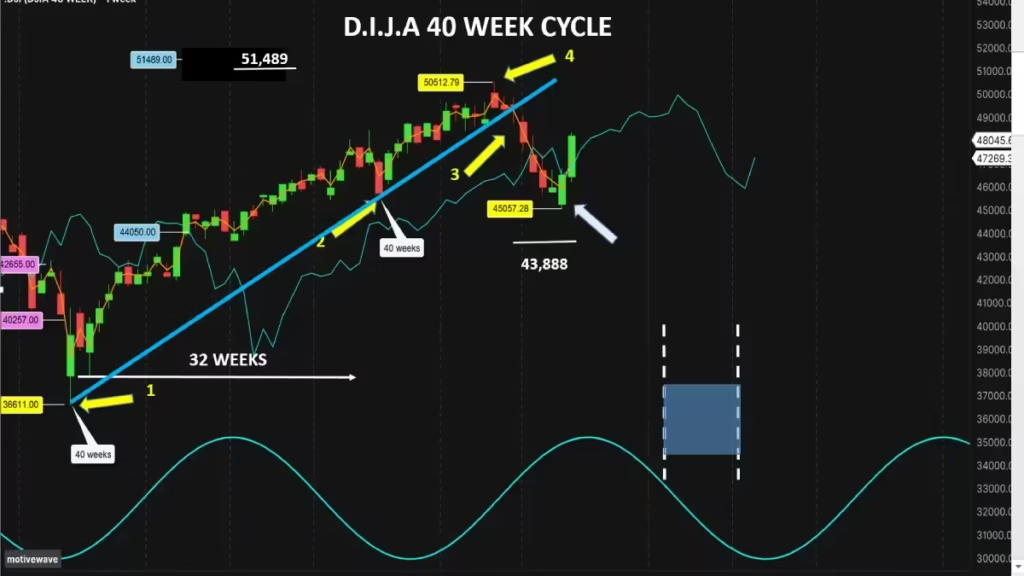
The previous 40-week cycle, spanning from April 2025 (arrow1) to November 2025 (arrow 2), was exactly 32 weeks long. A 32-week duration is notably short, being almost 7 weeks shorter than the 38.97-week average length derived from the Hurst nominal model. If we apply this same 32-week length to the November low, it identifies the week of June 29 as a potential time target for the next 40-week cycle low.
However, if we use the Hurst nominal model average length of 38.9 weeks, it points to the second week of August as a potential date. Consequently, we can expect the 40-week cycle low to form between late June and August (the blue zone).
A second possible scenario is that the March low represents the first 40-week cycle low since April 2025 (blue arrow). In this case, the 40-week cycle would be 50 weeks long—11 weeks longer than the nominal model. At 50 weeks, this duration is exceptionally long, making this scenario very unlikely to occur.
For the purpose of this analysis, if the March low were the 40-week low, it would be bearish for the Dow Jones. Indeed, according to Hurst, cycles tend to run shorter in bull markets and longer in bear markets compared to the nominal model.
While this scenario is improbable, we must keep the possibility in mind. During the first week of March, the Dow Jones crossed below its 40-week cycle trend line (VTL) (arrow 3), confirming that the high (arrow 4) established before the crossing was the peak of the next longer cycle: the 18-month cycle peak. The following weeks, the index crossed below its cycle line at 47,200.
This crossing provided two vital pieces of information: first, since the market missed its 51,489 target and crossed below the cycle line prematurely, the upside target is invalidated; second, the crossing confirms the 50,512 all-time high as the 40-week cycle peak and provides a potential downside target of 43,888 for the 40-week cycle low.
The 20 week Cycle.
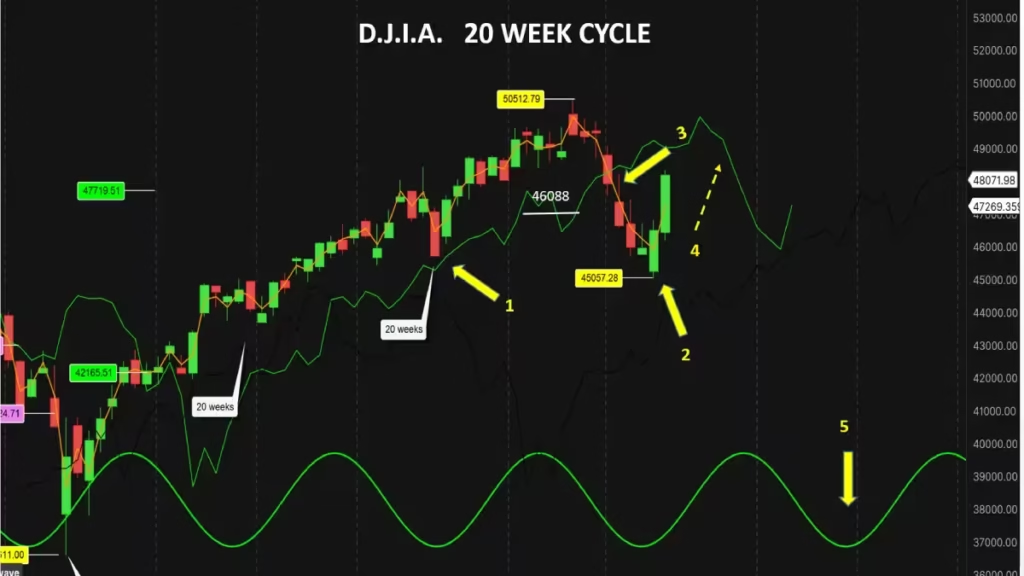
Due to the Hurst rule of synchronicity, the last 20-week cycle low formed simultaneously with the 40-week cycle in November 2025 (arrow 1). From the November low, using the Hurst nominal model’s 18.9-week average length, we identified the last week of March as a potential date for the next 20-week cycle low. At exactly 19 weeks, on March 30 (arrow 2), the Dow Jones formed a low of 45,057, hitting the time target perfectly according to the Hurst nominal model of 19.47 weeks.
During the first week of March, the Dow crossed below its cycle line at 48,300 (arrow 3), providing a potential downside target of 46,088. By hitting 45,057 on March 30, the market met and exceeded this target. This represents the first trading signal of the year for the 20 week cycle; with one positive signal out of one, the success rate is 100%.
Moving forward, we can expect the Dow Jones to rebound toward its cycle line (arrow 4), using it as resistance before resuming its decline into the fourth and final 20-week cycle of this 18-month period. We expect the market to form this low during the second week of August (arrow 5).
The 80 Day Cycle.
On March 30 (arrow 1), a new 80-day cycle began. On February 27(arrow 2), the market crossed below its cycle line at 49,216, providing 47,920 as a potential downside target. On March 3, the market met and exceeded this target on its way to the March 30 low.
The fact that the market exceeded its target by more than 2,000 points proves that the March 30 low was a high-degree cycle low. By meeting and exceeding this target, the success rate for the 80-day cycle remains 100% for the year. The next 80-day low is scheduled for June 6 (arrow 3). Before moving to shorter cycles, let us look at the 80-day roadmap for the next two to three months.
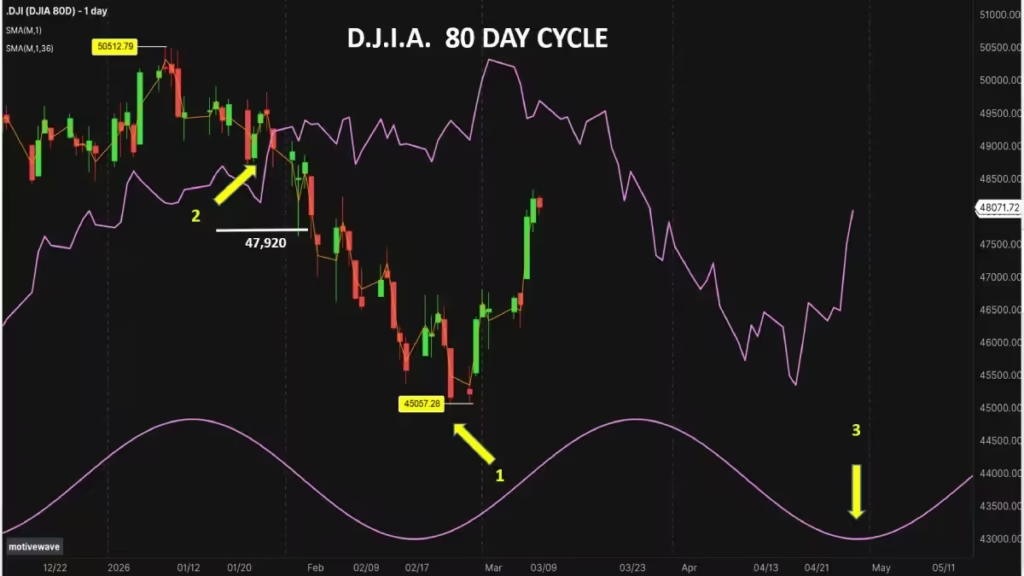
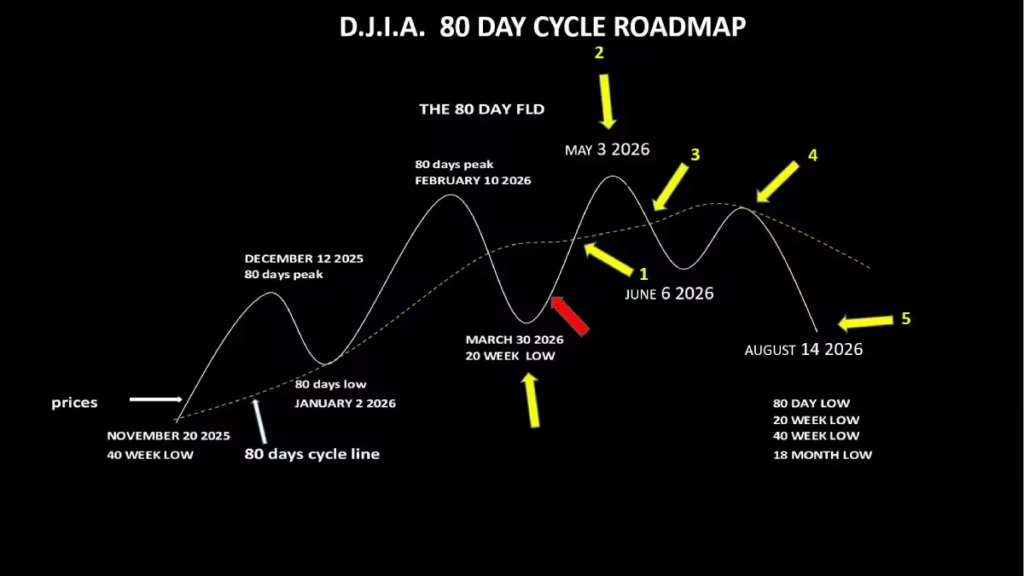
The Roadmap.
Following the March 30 low, we are currently at the “red arrow” position. In a balanced market, the Dow Jones should technically cross above its cycle line (arrow 1), providing an upside target for the next 80-day peak (arrow 2) expected around May 3.
After forming this peak, the index should cross back below its cycle line (arrow 3) toward the next 80-day low on June 6. Subsequently, the market should rebound toward the cycle line without crossing above it (arrow 4), using it as resistance before resuming the decline toward the final 80-day cycle low of the 18-month cycle (arrow 5).
The 40 Day Cycle.
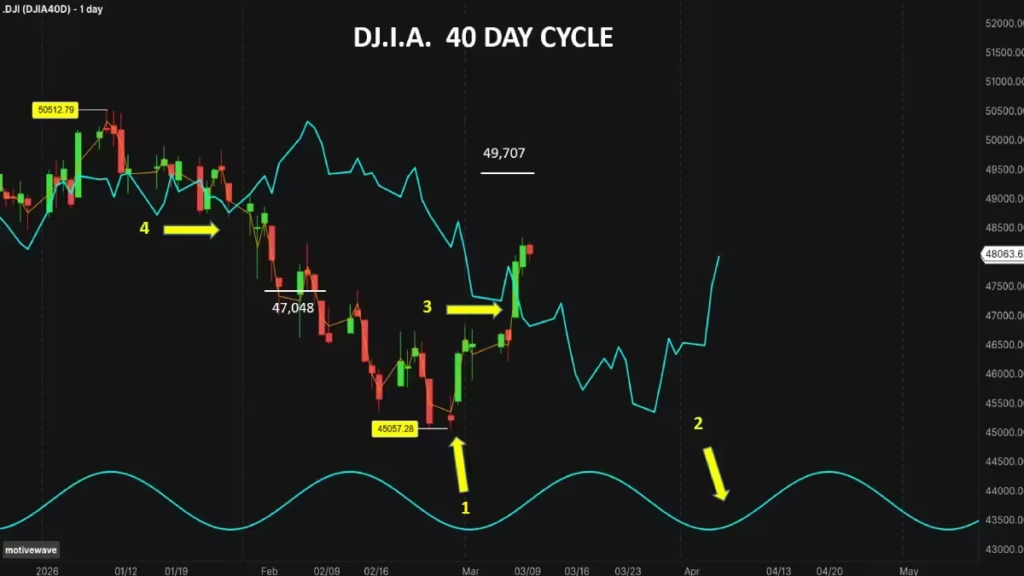
Since the last 40-day cycle low formed on March 30 (arrow1), we expect the next one to form between late April and early May(arrow 2), with May 3 being the most probable date. Last week, on April 8 (arrow 3), the Dow Jones crossed above its 40-day cycle line at 47,385, providing a potential upside target of 49,707.
Earlier, on March 2, the index crossed below its cycle line for the first time this year at 48,780 (arrow 4), targeting 47,048—a target met just days later. Thus, the 40-day cycle maintains a 100% success rate. If the upside crossing is confirmed in the coming days, we expect the market to form its next 40-day low on its cycle line, then rebound to form the second 40-day cycle before crossing back below the line.
We must also monitor where the next peak forms relative to the cycle top; a peak occurring on the left side of the cycle (left translation) would be a negative signal for the market.
The 20 Day Cycle.
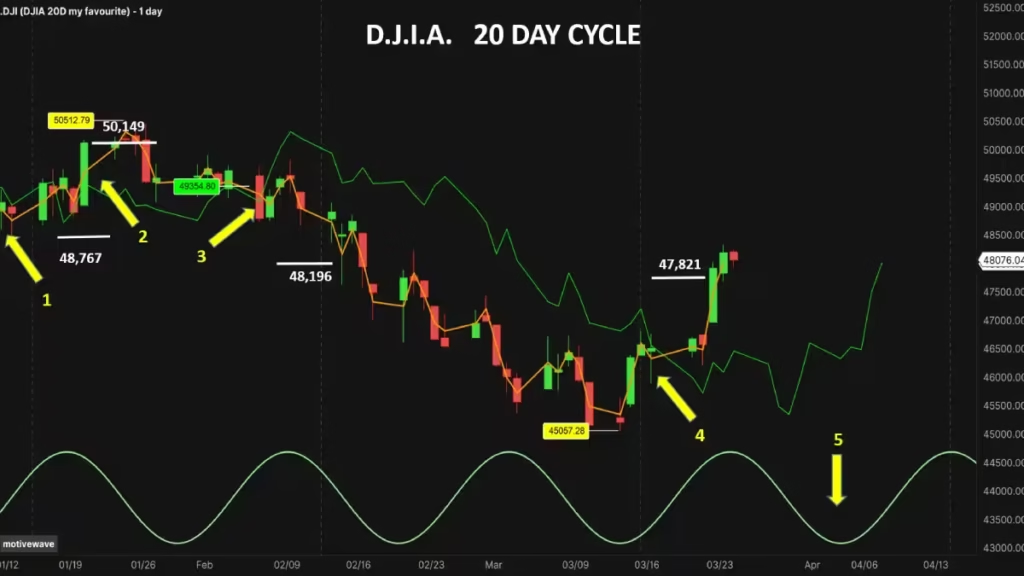
Since the start of the year, the 20-day cycle has provided four trading signals. The first occurred on January 27 (Arrow 1) when the Dow crossed below its cycle line at 49,200 for a 48,767 target; with a 48,459 low), the target was met.
The second signal arrived on February 4 (Arrow 2) with a crossing at 49,304 and a 50,149 upside target, met two days later.
The third signal was to the downside on February 24 (Arrow 3) at 49,354 targeting 48,196, which was met on March 5.
The fourth signal occurred last Monday, April 6 (Arrow 4), when the Dow crossed above its cycle line at 46,439 for a 47,821 upside target; this was met on April 8 with a high of 48,017. With four out of four positive signals, the success rate is 100%.
The next 20-day cycle low should form around April 18. To remain bullish in the very short term, the low should form on its cycle line. On April 17, this cycle line (FLD) will be at 46,600 (arrow 5).
Conclusion.
In conclusion, our cyclical analysis of the Dow Jones Industrial Average reveals a market at a pivotal crossroads. With a 100% success rate across our 20-day, 40-day, and 80-day cycle signals so far in 2026, the Hurst nominal model continues to prove its reliability for the modern trader.
The confirmation of the 18-month peak at 50,512.79 sets the stage for a broader corrective phase, with significant downside targets now in play. As we look toward the potential 40-week and 18-month lows expected between June and September, precision timing will be your greatest asset.
Stay tuned as we monitor the interaction with the 46,600 FLD level in the coming days. Remember, in a market driven by time, understanding the cycle is the key to unlocking consistent profitability.