

Essential Stock Chart Patterns for Technical Analysis: Part 1
Decoding the Market part 1
Decoding the Market with this series of articles, let’s explores key technical analysis patterns that traders use to predict stock price movements.
From classic reversal formations, like head and shoulders, and double tops to continuation patterns such as flags, pennants, and triangles, you will learn how to identify these visual cues on price charts.
We’ll examine the psychological factors behind these patterns, and explain how volume confirmation enhances prediction accuracy.
Today’s we will explore, the double top, double bottom, triple top and bottom and the head and shoulder.
Let’s start by some very common pattern, todays we will explore, first the double top, double bottom, triple top and bottom and the head and shoulder.
The Double Top
What is a Double Top?
A double top is a classic chart pattern that signals a potential reversal in the price of a stock or an asset. It typically forms after a strong upward trend and is characterized by two distinct peaks at roughly the same price level, separated by a trough.
This pattern indicates that buyers have attempted to push prices higher on two occasions but have failed to break through a significant resistance level.
– Indication:
Signals that the uptrend is weakening, and the stock may reverse into a downtrend.
– Key Level: Breakout occurs when the price breaks below the support level at the trough between the two peaks.

How a Double Top Forms
The formation of a double top begins with a price rise to a new high. Following this, the price pulls back, creating a trough. In the next phase, the price rallies again, reaching a peak that is approximately equal to the first high. This second peak is crucial; it reflects the market’s struggle to overcome resistance.
After the second peak, the price typically declines, confirming the double top pattern.
Why:
Shows that buyers tried twice to push prices higher but couldn’t break through resistance.
This suggests weakening buying pressure.

Volume Analysis:
Decoding the market by analysing the volume provide crucial validation for the Double Top. Typically, volume is high during the first peak as enthusiasm reaches a maximum.
During the rebound toward the second peak, volume is usually lower despite similar price levels—a warning sign of diminishing buying interest.
Finally, volume often increases significantly during the breakdown below the confirmation level, indicating strong selling conviction and validating the pattern’s completion.

What to Expect After a Double Top
Once the double top pattern is confirmed, it is easier for decoding the market, typically after the price breaks below the trough created between the two peaks, traders can expect a continued downward movement.
This decline often mirrors the height of the pattern, providing a target for potential price movement.
To calculate this potential downside target, traders can follow these steps:
When prices break below the support line, you can calculate the potential downside target by subtracting the support price from the highest point, then subtracting this difference from the support price.
- Identify the High Point and Support Level: Determine the highest price within the double top formation and the support level, which is the lowest point between the two peaks.
2.Calculate the Difference: Subtract the support price from the highest price. This difference represents the height of the pattern.
I personally make an average between both high.

In the example chart, the first high price is 6099.97, the support line is at 5773.31, and the second high price is 6147.43.
The difference is 6123.70 (6099.97+6147.43/2=6123.70) – 5773 = 350.39.
Establish the Target: To find the potential downside target, subtract this difference from the support price.
Therefore, the potential target is 5773 – 350.39 = 5422.92.

Psychological Dynamics behind the Pattern.
This pattern represents a fundamental shift in the supply-demand relationship.
During the first peak, some investors begin taking profits while others still believe in the uptrend.
The subsequent decline doesn’t immediately alarm most bulls, who view it as a healthy pullback.
When price approaches the previous high during the second peak,
the early sellers from the first peak often re-enter the market with sell orders, creating a resistance ceiling.
New buyers become scarce as they observe price struggling at the same level twice.
This increasing supply and decreasing demand cause the second failure and subsequent breakdown.
Timeframe Considerations:
Double Tops can appear on any timeframe, from one-minute charts to monthly charts.
However, patterns on longer timeframes generally have more significance and reliability.
A Double Top forming over several months on a weekly chart suggests a more substantial reversal than one forming over several hours on an intraday chart.

Variations and Nuances:
Perfect Double Tops with exactly equal peaks are rare.
recognizing the double top is essential for decoding the market
More commonly, the second peak may be slightly higher or lower than the first, or the pattern may take longer to develop than expected.
What matters most is that the resistance area is tested twice and rejected both times.
Sometimes a “throwback” occurs after the initial breakdown, where price temporarily rebounds to test the broken support (now resistance) before continuing downward—this actually strengthens the pattern’s reliability rather than invalidating it.
Conclusion
The double top is a vital pattern for traders to recognize, as it signifies a potential reversal in price trends.
Understanding its formation, the psychology behind it, and how to calculate potential price targets can equip traders with valuable insights for making informed decisions in the stock market.
Like any trading strategy, however, it should be used in conjunction with other analysis tools and risk management techniques for optimal results.

The Double Bottom
The Double Bottom pattern is a bullish reversal formation that appears after a prolonged downtrend, signaling a potential shift from bearish to bullish market conditions.
This pattern is essentially the inverse of the Double Top and offers traders a structured way to identify when selling pressure is exhausting and buying interest is resurging.
Formation Process:
The Double Bottom develops in a multi-stage process during an established downtrend.
Initially, price declines until it reaches a significant support level, creating the first bottom.
At this point, buying interest emerges (often from value investors or traders who believe the selling is overdone), causing the price to rebound, typically rising from the low.
The price then falls again as some sellers attempt to continue the downtrend, approaching or reaching the previous low.
Critically, this second attempt to push through support fails, creating the second bottom at approximately the same level as the first.
After this second rejection, buyers gain stronger control, pushing the price upward.
The pattern is officially confirmed when the price rises above the peak between the two bottoms (the “neckline” or “confirmation level”).

Measuring Implications:
Upon confirmation, the Double Bottom offers a quantifiable price target. Analysts measure the vertical distance from the bottoms to the peak between them, then project this same distance upward from the breakout point, same as for the double top.
This projection is based on the principle that the momentum needed to reverse the prior trend will likely continue with similar strength.
Psychological Underpinnings:
This pattern reflects changing market sentiment and shifting power dynamics between buyers and sellers. During the first bottom, early bargain hunters begin accumulating positions while most investors remain bearish. The subsequent rally doesn’t immediately convince most bears, who view it as a temporary bounce in a continuing downtrend. When price approaches the previous low during the second bottom, sellers who missed their chance during the first bottom try again, but their diminishing numbers can’t push prices significantly lower. Meanwhile, buyers who saw the first bottom hold are encouraged to buy more aggressively. This decreasing supply and increasing demand cause the second bottom to form and the subsequent breakout.

Volume Characteristics:
Volume behavior provides important confirmation for the Double Bottom. Typically, volume is high during the first bottom as panicked selling reaches its maximum. During the decline toward the second bottom, volume is usually lower despite similar price levels—a positive divergence indicating weakening selling pressure. Finally, volume often increases notably during the breakout above the confirmation level, indicating strong buying conviction and validating the pattern’s completion.
Confirmation Elements:
Several factors increase a Double Bottom’s reliability:
1) The pattern forms after a substantial downtrend, not just a minor dip; 2) The bottoms occur at a significant support level (e.g., previous historical support, round numbers, or major moving averages);
3) The second bottom has lower volume than the first;
4) The breakout occurs with notably increased volume;
5) The pattern takes sufficient time to develop (generally, the longer it takes, the more significant the potential reversal).

Lorem ipsum dolor sit amet, consectetur adipiscing elit. Ut elit tellus, luctus nec ullamcorper mattis, pulvinar dapibus leo.
Lorem ipsum dolor sit amet, consectetur adipiscing elit. Ut elit tellus, luctus nec ullamcorper mattis, pulvinar dapibus leo.
The Triple Top and triple bottom Pattern
The triple Top is a bearish reversal pattern that forms after an uptrend. It consists of three peaks at nearly the same price level, with two troughs in between.
Indication:
Signals that the uptrend is losing strength, and the price is likely to reverse downward.
Key Level:
Breakdown occurs when the price breaks below the support level at the lowest trough.
Target Calculation:
-the calculation mode is exactly the same than for the double top.
Measure the distance from the lowest point of the triple top (the trough) to the peak formed between the three tops.
Target Price = Breakout Point – (Peak – Trough).
Triple Bottom Formation Process:
Conversely, the Triple Bottom appears during a downtrend when price falls to a support level three separate times, creating three troughs at roughly the same level.
Between these troughs, price rebounds, forming two peaks.
The pattern is confirmed when price breaks above these peaks after the third trough.
The horizontal line connecting the three bottoms represents a strong support level where buying interest consistently overcomes selling pressure.
Measuring Implications:
These patterns provide measurable price targets.
Traders calculate the vertical distance from support line to the lowest trough the highest peak within the pattern, then project this distance from the breakout point in the direction of the new trend.
This projection is based on the principle that the momentum needed to reverse the previous trend will likely continue with comparable force.


The Head and Shoulders.
The Head and Shoulders pattern is one of the most recognizable and reliable reversal patterns in technical analysis, typically signaling the end of an uptrend and the beginning of a downtrend.
Formation Process:
This pattern develops over time and consists of three peaks.
Initially, the price rises to a peak (the left shoulder) during a bullish trend, then retraces downward.
Next, buyers regain control and push the price to a higher peak (the head), demonstrating their last strong effort.
After reaching this highest point, the price falls again, often to approximately the same level as the previous trough.
Finally, buyers attempt one more rally, but their strength has diminished, resulting in a third peak (the right shoulder) that’s lower than the head and usually similar in height to the left shoulder.
The lows between these peaks form what’s called the “neckline” – usually a horizontal or slightly sloping line.
Psychological Factors:
The pattern represents a gradual shift in market psychology.
During the left shoulder formation, market sentiment is bullish as buyers confidently push prices upward.
The head represents peak optimism and the strongest buying pressure.
However, when prices retreat from the head, it indicates that buying enthusiasm is waning.
The right shoulder forms as some optimistic buyers try to maintain the uptrend, but their decreasing numbers can’t push the price to previous highs.
This reveals that market sentiment has fundamentally shifted.
Volume Characteristics:
Volume analysis enhances the reliability of this pattern.
Typically, volume is highest during the left shoulder formation, decreases during the head formation despite higher prices (a warning sign), and is notably lower during the right shoulder, confirming weakening buying pressure.
Volume often spikes when the price breaks below the neckline, validating the pattern completion.

Confirmation and Trading Implications:
The pattern is considered complete when the price breaks below the neckline after forming the right shoulder.
This breakdown confirms that sellers have taken control. The traditional price target is calculated by measuring the vertical distance from the head to the neckline and projecting that same distance downward from the neckline breakpoint.
This projection is based on the principle that the force needed to reverse the trend will likely continue with similar momentum.

False Signals and Variations:
Not all Head and Shoulders patterns lead to significant reversals.
Sometimes prices may briefly break the neckline only to reverse again (a “head fake”).
Traders often wait for confirmation of the breakout, such as a close below the neckline or a break with significant volume.
The pattern can also appear with variations—the shoulders might not be symmetrical in height or time duration, or the neckline might be sloping rather than horizontal.
Timeframe Considerations:
This pattern can form on various timeframes, from intraday charts to weekly or monthly charts.
Generally, patterns that form over longer timeframes (weeks or months) are considered more reliable and may indicate more significant trend changes than those forming over shorter periods.
Risk Management:
Decoding the market, is an important part of risk management. Prudent traders place stop-loss orders above the right shoulder when entering short positions based on this pattern, limiting potential losses if the pattern fails. Some traders wait for a “pullback” to the neckline after the initial breakdown before entering positions, potentially getting a better entry price while confirming the neckline now acts as resistance.

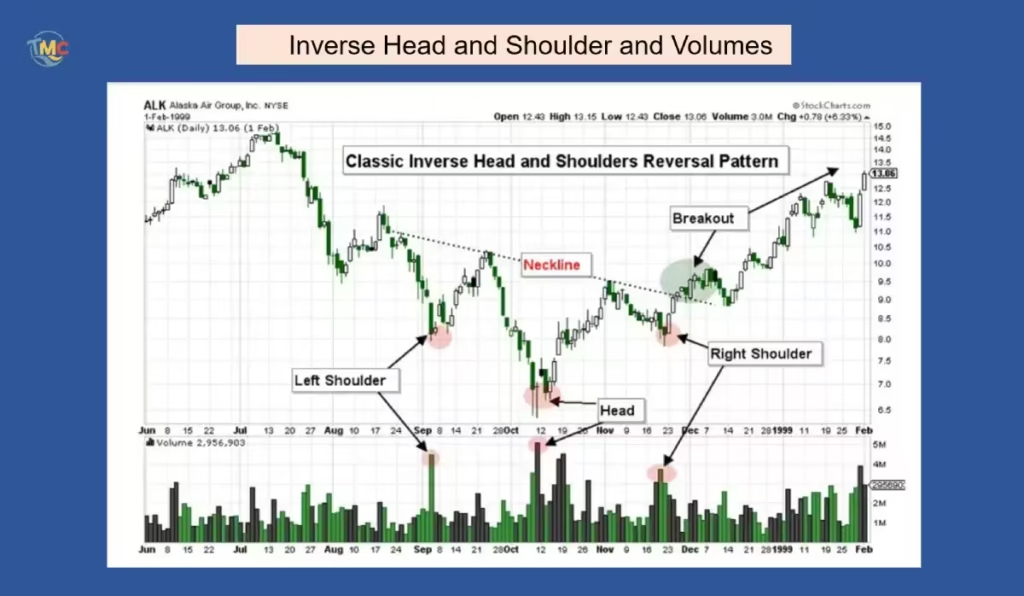
The Inverse Head and Shoulders
The Inverse Head and Shoulders pattern is a mirror image of the standard Head and Shoulders, signaling a potential reversal from a downtrend to an uptrend. It’s considered one of the most reliable bullish reversal patterns.
Formation Process:
This pattern develops during a downtrend and consists of three troughs instead of peaks. First, the price reaches a low point (the left shoulder), then rebounds somewhat.
Next, selling pressure pushes the price to an even lower point (the head), representing sellers’ final strong effort.
The price then bounces back, often to near the same level as the previous rebound. Finally, sellers make one more attempt to push prices down, but their diminishing power results in a third trough (the right shoulder) that’s higher than the head and usually similar in depth to the left shoulder.
The highs between these troughs form the “neckline” – typically a horizontal or slightly sloping line.
Psychological Factors:
This pattern illustrates a gradual shift from bearish to bullish market psychology. During the left shoulder formation, sentiment is predominantly bearish as sellers confidently push prices downward.
The head represents peak pessimism and strongest selling pressure. When prices bounce from the head, it indicates that selling momentum is diminishing. The right shoulder forms as some pessimistic sellers try to continue the downtrend, but they can’t push the price to previous lows.
This demonstrates that market sentiment is fundamentally shifting toward bullishness.
Volume Characteristics:
Volume patterns significantly enhance this pattern’s reliability. Typically, volume is highest during the left shoulder formation, decreases during the head formation despite lower prices (a positive divergence), and is notably lower during the right shoulder, confirming weakening selling pressure.
Volume often increases substantially when the price breaks above the neckline, validating the pattern completion and new uptrend.
Confirmation and Trading Implications:
The pattern is considered complete when the price breaks above the neckline after forming the right shoulder. This breakout confirms that buyers have gained control. The traditional price target is calculated by measuring the vertical distance from the head to the neckline and projecting that same distance upward from the neckline breakpoint. This projection estimates how far the new uptrend might extend based on the momentum needed to reverse the previous downtrend.
False Signals and Risk Factors:
Like all patterns, the Inverse Head and Shoulders isn’t infallible. Sometimes prices briefly break the neckline only to reverse downward again.
To mitigate this risk, traders often wait for confirmation signals such as a decisive close above the neckline, increased volume during the breakout, or a successful retest of the neckline from above (where the former resistance becomes support).
Advanced Applications:
Experienced traders sometimes enter positions early, when the right shoulder is still forming, anticipating the breakout. This riskier approach offers better entry prices but requires additional confirmation signals. Others look for this pattern within larger chart contexts—an Inverse Head and Shoulders forming at a major support level or during a longer-term bullish cycle may have higher probability of success.
Broader Market Implications:
When this pattern appears on major market indices or sector leaders, it may signal broader market reversals that could affect related stocks or sectors.
This makes it valuable not just for trading the specific security showing the pattern, but also for overall market analysis.

One Response