

Bitcoins Market update November /4/2024
Overview of Bitcoin’s Market Cycles
In this comprehensive analysis, we will explore the latest developments in the Bitcoin market, focusing on the critical 20-day, 40-day, and 80-day and weekly cycles. This update aims to provide valuable insights for investors and traders.
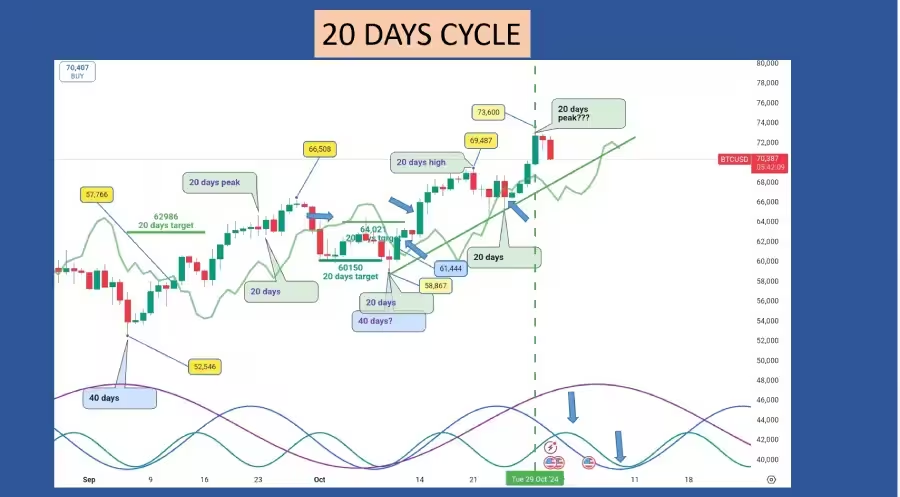
The 20-Day Cycle Analysis
As of my last update, the Bitcoin market was trading precisely on its cycle line, and we anticipated a breakout above this line.
This breakout occurred on October 12, where Bitcoin triggered an upside potential target of $64,021.
This target was not only met but exceeded two days later, on October 14, resulting in a profit of $2,577.
Following this, the Bitcoin market reached a high of $69,487 on October 21, as expected during the second cycle following an 80-day cycle.
On October 25, the Bitcoin market found support on its cycle line at a low of $65,521.
While the bar chart dipped slightly below the cycle line, the median price remained on the cycle line. Subsequently, the Bitcoin market continued its rally towards the upcoming peaks of the 20-day and 40-day cycles.
We expect the peaks for the 20-day and 40-day cycles to occur on November 3, with lows anticipated on November 13.
During the formation of the next low, the Bitcoin market is expected to cross below its cycle line, setting a target for the 40-day cycle low, which should decline to at least the 40-day cycle line, projected at $66,848 by November 13.
The success rate for the 20-day cycle is an impressive 77%.

The 40-Day Cycle Insights
The last 40-day cycle low was formed on October 10, coinciding with the 80-day cycle low.
After crossing above its cycle line at $65,730, the Bitcoin market generated a buy signal with a target of $72,593 on October 15.
This target was achieved and surpassed 14 days later, on October 29, yielding a profit of $6,863, or 10.4%.
The peak for this 40-day cycle is expected on October 27.
On October 29, the Bitcoin market reached a high of $73,600, very close to an all-time high.
The current 40-day cycle peak formed on the right side of the cycle, known as “right time translation,” a term coined by Hurst, which often indicates bullish trends.
We can anticipate a moderate correction during this phase.
At this point in the cycle, the market is likely to cross below its cycle line, providing a downside target for the next 40-day low, expected on November 13.
However, given the prevailing bullish sentiment in the Bitcoin market, there is a possibility that the Bitcoin market will find support on its cycle line instead of dropping below it.
On the chart, there is a table with the cycle line support for the next few days.
To determine the potential downside target, we must await the confirmation of the 40-day peak and utilize the highest point achieved.
For further insights on target calculations, I recommend watching my YouTube videos that delve into the secrets of market cycles or reading my detailed articles.
The success rate for the 40-day cycle stands at 82%.

The 80-Day Cycle Update
Since my last update, we confirmed the 80-day cycle low on October 10. From the low on August 5 to the low on October 10, I plotted the 80-day cycle trend line, referred to by J.M. Hurst as the VTL.
These cycle trend lines are instrumental in anticipating peak formations.
We will leverage this trend line to identify the next peaks for the 80-day and 20-week cycles.
In fact, when the Bitcoin market crosses below this line, it will confirm that the peaks for the 80-day and 20-week cycles are either formed or in formation.
The next anticipated low for the 80-day cycle is slated for December 15.
On September 18, the Bitcoin market crossed above its cycle line at $60,000, presenting a buying opportunity with a target of $67,454.
At the time of my last update, this target had not yet been reached, but by October 15, the market achieved and exceeded this target, resulting in a profit of $7,454 over 27 days.
The success rate for the 80-day cycle since the start of the year is 77%.

The Roadmap
What lies ahead for the 80-day cycle? Let’s take a closer look at the roadmap.
Following the October 10 low, the Bitcoin market crossed above its cycle line, setting a target of $64,021 for the upcoming 20-day peak.
This peak was realized on October 21 at $69,487.
As anticipated, the market began its correction, finding support on its cycle line on October 25 at $65,521.
Currently, the Bitcoin market is positioning itself to form the peak of the 40-day cycle the red arrow.
Once this peak is established, the Bitcoin market should drop below its 20-day cycle line, indicating a potential downside target for the 40-day low, expected on November 13.
When the market reaches its 40-day low, we can anticipate a new rally towards the 80-day peak.
As it approaches this peak, the Bitcoin market should cross back above its cycle line, setting a target for the 80-day peak.
After the formation of this peak, the market is expected to dip below its cycle line, establishing a price target for the 80-day low.
Before reaching the low on December 15, the Bitcoin market is expected to form an initial low around the third week of November, then rebound towards its cycle line, using it as resistance before continuing its decline towards the 80-day low on December 15.

The 20-Week Cycle Perspective
According to Hurst’s principle of synchronicity, a new cycle of 18 months, 40 weeks, and 20 weeks started on August 5.
The Bitcoin market is progressing towards its 20-week cycle peak.
Since my last update, there has been a noticeable shift in market sentiment from neutral to bullish.
For this first 20-week cycle since the major low, the low for the 20-week cycle should find support on its cycle line during the first week of December, marked by a green vertical dashed line. This cycle line is projected to be around $62,747.
Despite the neutral market sentiment during my last update, the Bitcoin market crossed above its cycle line in the third week of September.
In my previous update, I mentioned $78,000 as the target for the 20-week cycle, I apologize for the miscalculation.
A crossing at $63,800 indicates an upside potential target of $75,154, which would set a new all-time high for Bitcoin.
This $75,154 mark is the next target for the 20-week cycle, as indicated by the green target label on the chart.
However, if the Bitcoin market crosses below its 20-week cycle line before hitting the $75,154 target, this would invalidate the target, leading to a high probability of a bearish trend due to longer-term cycles exerting downward pressure on the market.

The 40-Week Cycle Analysis
The next anticipated low for the 40-week cycle is around March 31, 2025, indicated by a blue vertical dashed line.
The cycle line is projected to be at $70,571 on March 10, 2025. As this is the first 40-week cycle since the major low, this line should serve as the support for this cycle.
The red semi-circle at the bottom of the weekly chart symbolizes the 40-week cycle.
It is still too early to determine whether we will experience a left or right time translation for the peak of this cycle, with the peak expected around the first week of December.
As noted during the 20-week analysis, the mood in the Bitcoin market appears to have shifted to a more bullish sentiment compared to previous weeks.
In fact, the Bitcoin market crossed above its cycle line during the week of October 21 at $67,539, presenting a new target for an all-time high at $82,532.
Conclusion
In summary, the Bitcoin market remains in a bullish trend and is on track to reach the 20-week cycle peak. We can anticipate the occurrence of the 20-week cycle low in mid-December. This ongoing bullish momentum, combined with well-defined cycles, offers intriguing opportunities for investors and traders alike.