

Bitcoin Price Prediction 2026:
Decoding the 18-Month Cycle & $73K Target
Introduction
As we navigate the opening weeks of 2026, the Bitcoin market finds itself at a critical technical crossroads. Following our December update, all eyes are on the convergence of major Hurst cycles that point toward a significant volatility window. Currently, Bitcoin has dipped below its 18-month cycle line, signaling a potential correction toward the $73,408 mark. While some analysts suggested a low was reached in late 2025, the lack of a sharp rebound above the 20-week cycle line suggests that the true bottom is still ahead of us.
This analysis dives deep into the synchronicity of the 40-week and 20-week cycles. We are currently approaching a “cluster” of cycle lows expected between late January and early February. Understanding these time windows is essential for distinguishing between a standard corrective phase and a more significant shift in the 54-month macro trend. Whether Bitcoin finds support at its Valid Trend Line (VTL) or breaks further, the next few weeks will define the trajectory for the remainder of the year.
The 18 Month Cycle
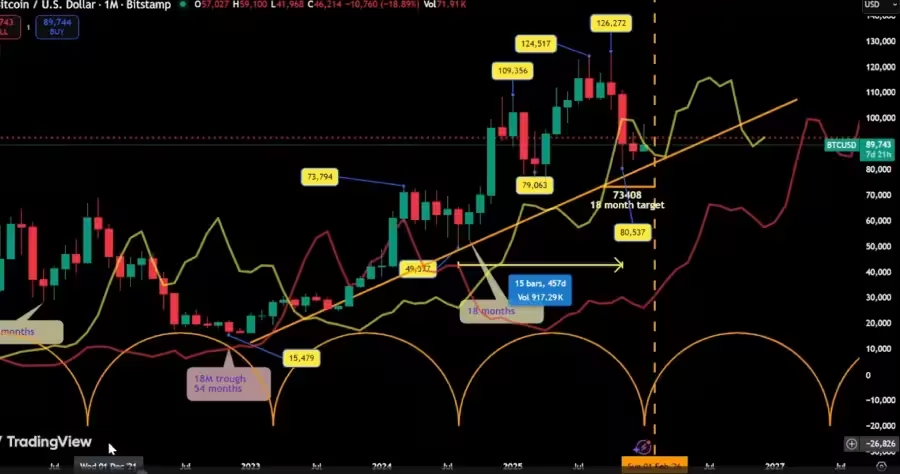
On my December 8 2025 update, I was expecting a major low to form around February 2026.
Since the Bitcoin crossed below his 18 month cycle line, the yellow line on the chart, the target for the 18 month is $73408.
Some may wonder if the low we saw on November 21 at $80,537 was the second 18 month cycle of the actual 54 month cycle and the start of the next cycle. I believe this is very unlikely for two reasons.
The first reason if the actual 18 month cycle formed his low on November 21 at $80,537, this second cycle will be only 15 month long, and since the bitcoin is in corrective phase, usually the cycle run little bit longer.
The second reason is, usually after the formation of an 18 month cycle,
the market rebound sharply and very quickly cross above the 20 week cycle line,
Which wasn’t the case,
we will see that when analyzing the 20 week cycle.
The $73408 target is still valid, and the ideal time target for the bitcoin to reach this target, should be between the last week of January and the first week of February.
The $73408 target is below the cycle trend line or V T L, the yellow solid uptrend line on the chart.
What that’s mean for the longer picture?
Even if the bitcoin market reach this $73,408 target,
it doesn’t mean a very bearish trend for the next 18 months.
We have to watch carefully the bitcoin market reaction if he reach this target.
As reminder, the most important part of the bar chart if the bitcoin cross below his V T L, is the median price, if this happen this could be a bearish sign for the bitcoin market,
But after meeting his target, If the bitcoin rebound sharply, and cross back above his cycle trend line or V T L, and above his cycle line the F L D, this will raise the possibility of the 18 month cycle low has formed.
If the bitcoin do not cross back right away above the both, the cycle line and the cycle uptrend line, and continue his decline, there is a high probability the 126,272 high is the 54 month cycle peak,
In this case we can expect further decline for the bitcoin market,
possibly to the 54 month cycle line, the red line.
Since there is a very high probability, of the last 54 month cycle low formed in November 2022, the actual 18 month cycle is this second one from that date, so the very bearish scenario for now is unlikely, but not impossible.
The most probable scenario, is the bitcoin may drop very quickly to his V T L , finding support on it, and maybe go to the $73,408 target,
then rally back very strongly, on his way to the third 18 month cycle peak of this 54 month cycle, it may also missed his $73,408 target, which will be very bullish sign.
But in any case, the $126272 is confirmed as at least an 18 month cycle.
The 40 week Cycle
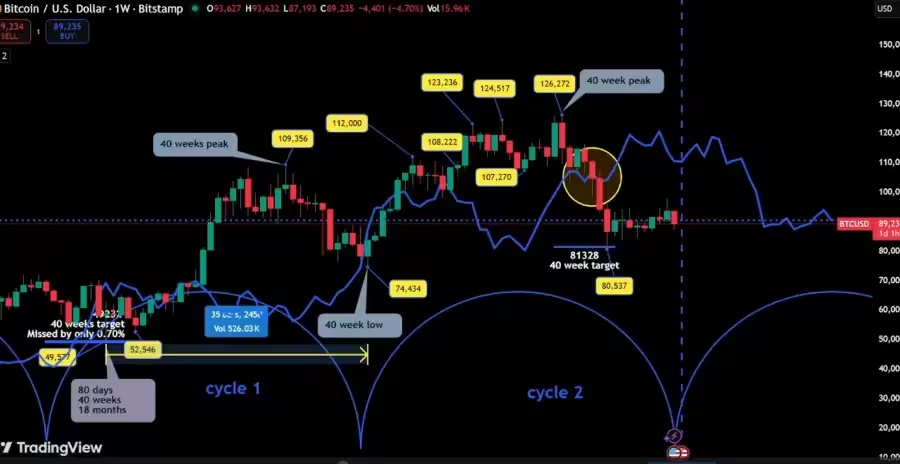
Now let see the 40 week cycle
The best time target for this 40 week cycle to form his low, is the third week of January.
If that is correct, we can expect a sharp move on the downside.
If that the case, the 40 week cycle will maintain the 38.9 week average length from the Hurst nominal model.
This 40 week cycle is the second one of this 18 month cycle,
and by the principle of synchronicity will also be the 18 month low.
We will have an official confirmation of this 40 week low, when the Bitcoin will cross back above his 40 week cycle line, the blue line on the chart.
For now the 40 week cycle meet his last November $81328 target by forming $80537 low on November 21.
At the same time of providing a downside target, the same week the Bitcoin crossed below his 40 week cycle up trend line or V T L, confirming the $126272 October 6 2025 all-time high, is at least the 18 month cycle peak.
On January 19 2026, last week, the 40 week cycle was 41 week long, but like mentioned in my December update, the first 40 week cycle was only 35 weeks long, shorter by almost 4 week then the Hurst nominal model.
To maintain the Hurst nominal average of 38.97 week, the actual 40 week should 42 weeks long.
Which give January 26 the ideal time window for the 40 week cycle formation.
This 40 week cycle may form his low around the $73408, is that correct another 18% decline is possible.
The 20 week Cycle
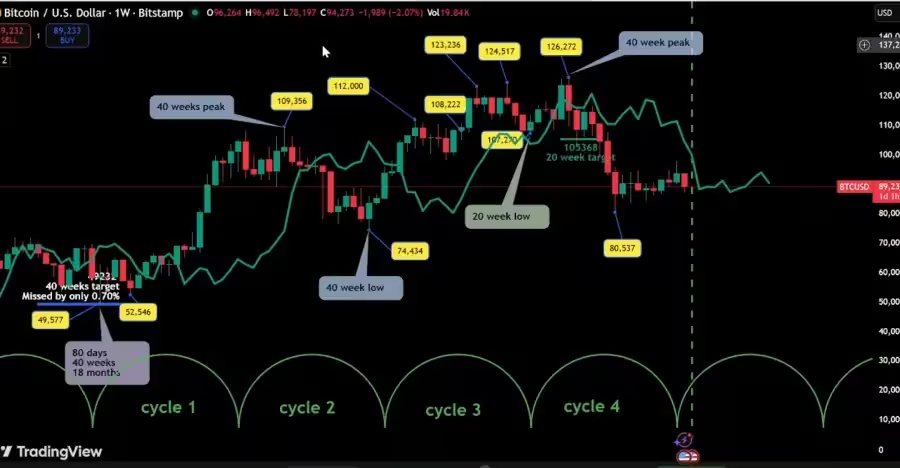
Let see now the next shorter cycle, the 20 week cycle.
The 20-week cycle is our ‘short-term’ confirmation
This cycle is an important cycle to follow on the short term basis, to identify the potential 18 month cycle low, Since this is the fourth and final 20-week cycle within the larger 18-month wave, its low will likely mark the bottom for the whole move.
Indeed, when the bitcoin will cross back above his cycle line, the green line on the chart, this will confirm not only the 20 week low, but also the low of this 18 month cycle,
When the 20 week low will be confirm, with confidence we can call the 18 month cycle low.
The previous 20 week cycle low formed on September 1, the peak on October 6 with the $126272 all-time high.
The next one is expected by the last week of January or perhaps the first week of February.
After the 20 week cycle low formation, the Bitcoin will cross above his cycle and provide a potential upside target on his way to the next 20 week cycle peak,
If the actual 20 week is on time, then we can expect the peak of the next 20 week cycle around the first week of April.
The 80 Day Cycle
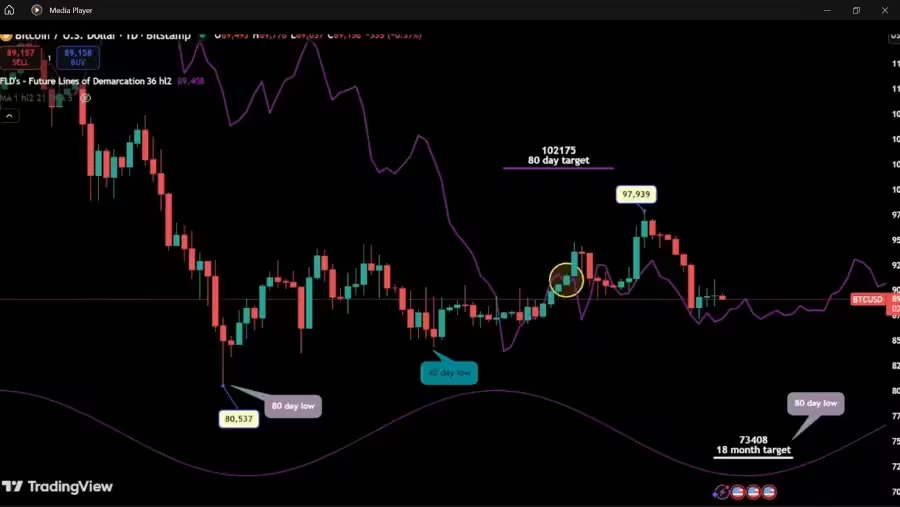
The last 80 day cycle was on November 21 2025,
On December 29, the Bitcoin crossed above his cycle line at $88118, but the crossing was not very clear, when this happen it is better to wait for a more clear crossing.
On January 15, we had a very clear signal at $91356 for a potential $102175 target.
Since the crossing, the Bitcoin trade along his cycle line, hugging the cycle line, and didn’t yet meet his target.
If the Bitcoin crosses back below his cycle line before meeting his upside target, this will be bearish warning on the short term basis, this would likely trigger a sharp decline, into the January 31st window to meet our $73,408 target
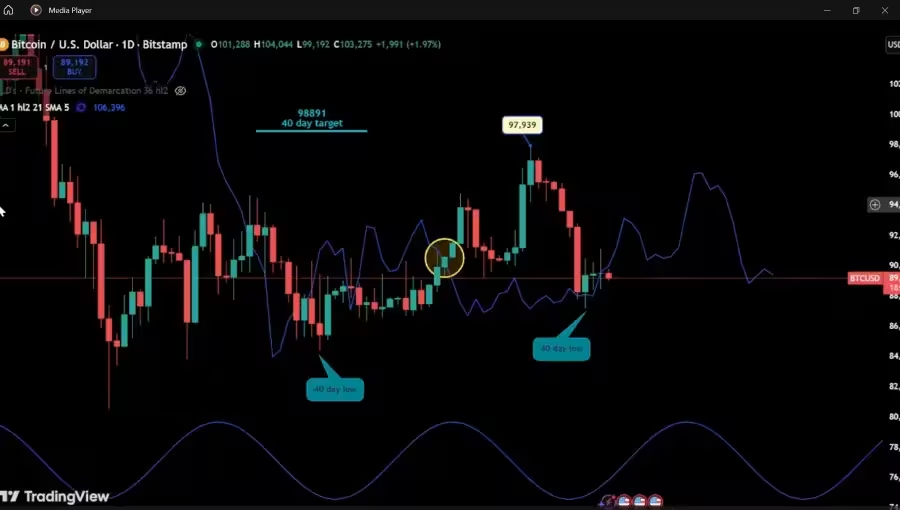
The 40 Day Cycle
Finally, the 40-day cycle, on my December update, I was expected the 40 day cycle to form on December 25,
Since the 40 day formed on December 18, the cycle was 7 day shorter than the Hurst nominal model.
On January 3, the Bitcoin crossed above his cycle line at $89714, for an upside potential $98891 target.
On January 14, the Bitcoin reached $97939, only $952 or 0.96% from the target,
Our last signal was a success—hitting within 1% of the $98,891 target. That gives us a 100% success rate for the year so far
The next 40-day low is expected on January 26. This convergence of the 40-day, 80-day, and 40-week cycles on the same week suggests we are entering a period of maximum cyclic pressure.
Conclusion
In summary, the convergence of the 40-day, 80-day, and 40-week cycles creates a period of “maximum cyclic pressure” centered around late January 2026. While the $73,408 target remains a focal point, the market’s reaction at the Valid Trend Line (VTL) will be the ultimate tell. A sharp rebound would confirm the start of a bullish third 18-month cycle, whereas a failure to recover quickly could signal a deeper 54-month peak reversal. Investors should maintain discipline as we enter this high-probability reversal window, watching the green 20-week cycle line for final confirmation of the bottom.