
Bitcoin & Market Cycle Analysis: Hurst Cycles | Trading Market Cycles
Introduction:
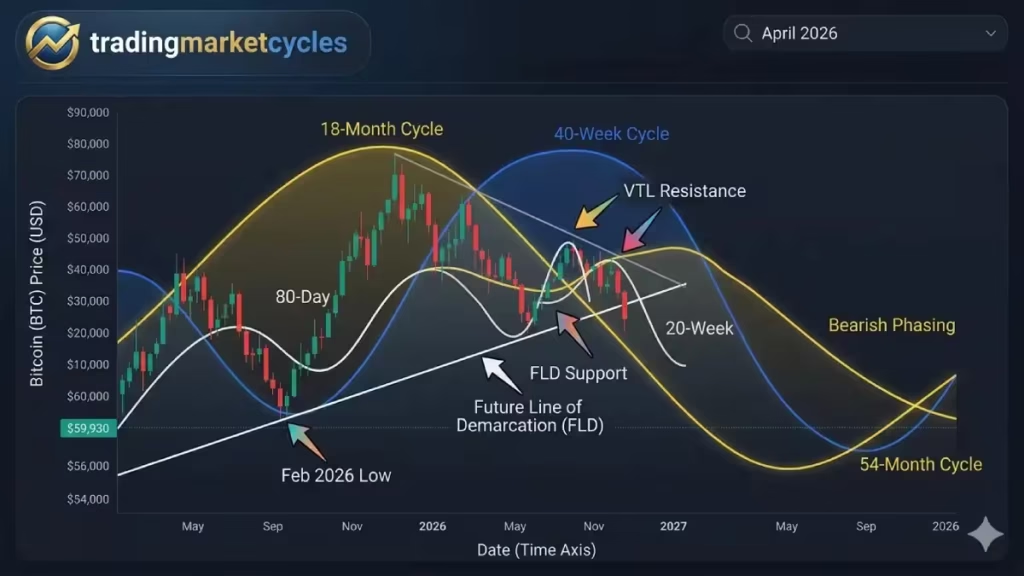
Welcome to our latest technical deep dive into the Bitcoin market structure through the lens of J.M. Hurst’s cyclic principles. As we navigate the complexities of 2026, understanding the intersection of price action and temporal cycles has never been more critical for the strategic trader. The Bitcoin market is currently at a fascinating crossroads, where long-term phasing meets short-term volatility, creating a landscape that demands both patience and precision.
In this update, we focus heavily on the transition following the February low and what it signifies for the broader 54-month cycle. By applying the Hurst nominal model, we can pull back the curtain on market noise to reveal the underlying rhythmic DNA of the S&P 500 and Bitcoin. We will explore how the Valid Trend Line (VTL) and Future Line of Demarcation (FLD) are currently acting as the ultimate arbiters of trend strength. Whether you are a short-term swing trader or a long-term position holder, the following cycle-by-cycle breakdown—covering everything from the 18-month “macro” view down to the 40-day “micro” fluctuations—is designed to provide a professional, comprehensive roadmap for the months ahead. Let’s analyze the data to see where the weight of evidence lies.
The 18 Month Cycle
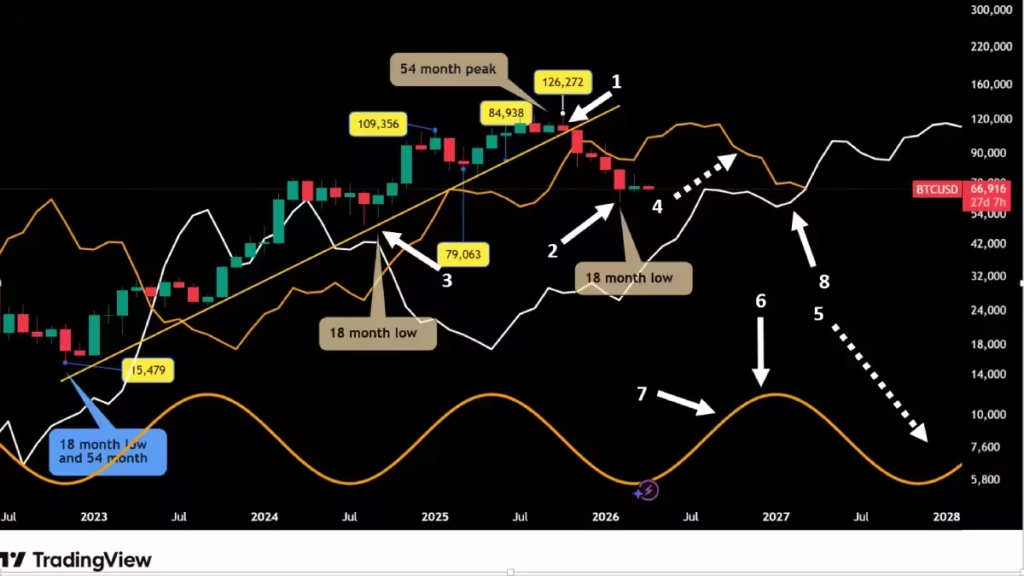
During my last update, I mentioned the possibility that the $126,272 high could be the 54-month cycle peak, provided the Bitcoin market confirms the cycle trend line (the yellow uptrend line) or VTL (Valid Trend Line) crossing. Additionally, the low for the current 18-month cycle is expected to occur in February 2026. By trading below the VTL for the past three months, the Bitcoin market confirms that the October 2025 high is at least the 54-month cycle peak (arrow 1), and it may even represent the peak of a significantly longer cycle.
Timewise, if the February $59,930 low is indeed the 18-month cycle low, then Bitcoin formed its low right on the projected time target( arrow 2). This occurred exactly 18 months since the last 18-month cycle low in August 2024 (arrow 3), closely matching the 18.93-month duration from the Hurst nominal model. Furthermore, the average of the last three 18-month cycles stands at 17.6 months. Since we are currently in a bear market—and in bear markets, cycles have a tendency to run a little bit longer than the Hurst nominal model—even if there is the possibility of the 18-month cycle extending slightly, we can label the February low as the 18-month cycle low with a very high degree of confidence. For the rest of this analysis, let us assume the February low was the 18-month low; if it does extend, we will simply need to move our labeling forward accordingly. Pricewise, with a $59,930 low in February, the Bitcoin market met and even exceeded its downside target.
What to expect next? We are starting a new 18-month cycle; therefore, we can expect the market to rally toward its cycle line—the yellow line (arrow 4)—without crossing it, instead using it as a level of resistance. Following this, it should resume its decline on its way to forming the third and final 18-month cycle of this 54-month cycle, which is expected to form around August and September 2027( arrow 5).
In a balanced market, the peak should typically form around November 2026(arrow 6). However, since the Bitcoin market is currently in the final phase of the 54-month cycle, there is the possibility that Bitcoin forms its peak earlier (on the left part of the cycle, arrow 7). We also have to monitor the white cycle line, the 54-month FLD( arrow 8), to see if the market will find support on it or will cross below it. In the event that Bitcoin crosses below this line, it will trigger another significant downside target. But this is for the very long-term picture; for now, let us focus on the shorter-term cycles.
The 40 week Cycle
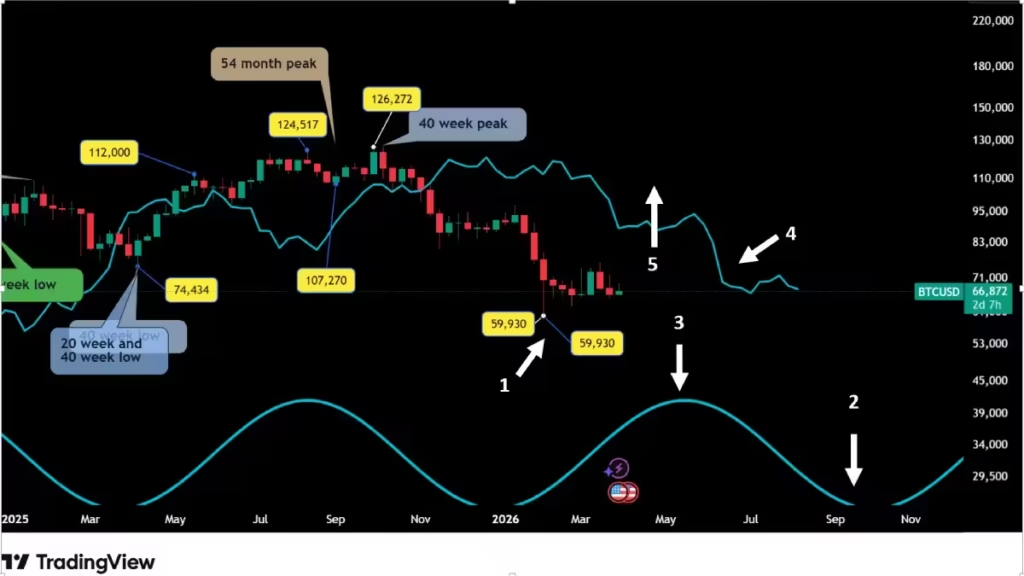
Due to the Hurst rule of synchronicity, if the February low (arrow 1) is the 18-month cycle low, it is also the low of all the shorter cycles, meaning we will start an entirely new series of cycles starting from the February low. On the Hurst nominal model, the 40-week cycle has an average length of 38.97 weeks. Since Bitcoin is in a bear market, the cycle has a tendency to be a little bit longer.
We can estimate that the next 40-week cycle will have an average length between 39 and 41 weeks, which would give the possibility of forming its low during mid-November(arrow 2), while the peak can be expected around May (arrow 3). The peak could find resistance on its cycle line (the blue line arrow 4) then resume its decline to form its low. If Bitcoin remains below its cycle line during the peak formation, then we can expect further decline; however, if the peak occurs above the cycle line (arrow 5), this will trigger a potential upside target, giving a little bit of hope on the bullish side for very short-term traders.
The cycle line will be around $87,000. If Bitcoin crosses this point, it will give a potential target of $114,000. But again, to trigger this target, Bitcoin has to cross above its cycle line, and depending on the total amount of bearishness, it is even possible that Bitcoin won’t even meet its target. For now, we remain in the bearish scenario, where the most likely scenario is that Bitcoin finds resistance on its cycle line, the FLD.
The 20 week Cycle
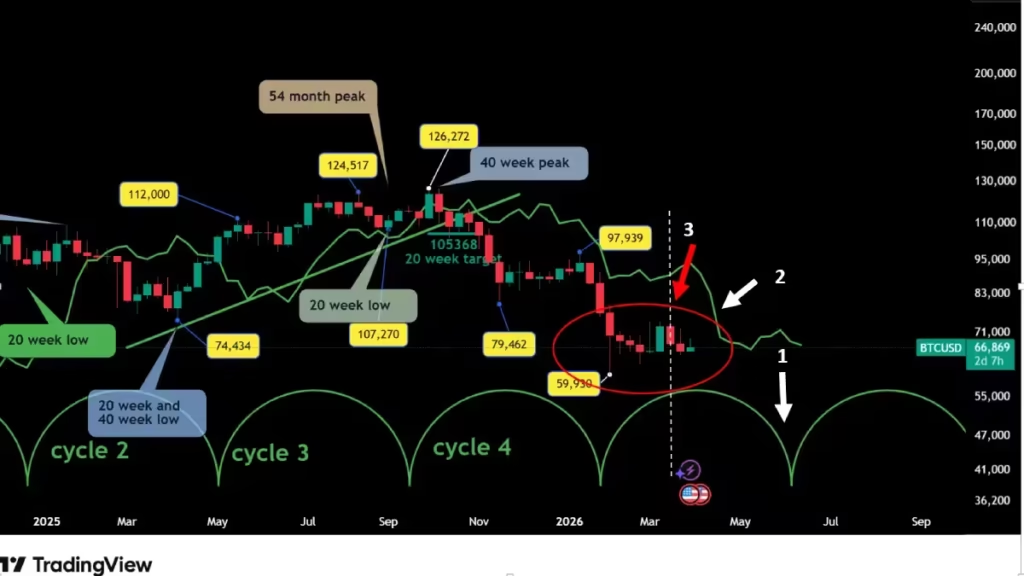
Assuming the February low is the 20-week low, the next one is scheduled for the middle of June (arrow 1). The peak should form during the next two weeks, and this peak should be very close to its cycle line (arrow 2), using it as resistance without crossing above it, before resuming its decline into the middle of June.
The second scenario is that the peak may have already formed on the second of March, (arrow 3) when Bitcoin formed a $76,013 peak. Knowing where the peak will form comparatively to the cycle peak is crucial information for the future trend.
Indeed, if the peak already occurred on the second week of March, and since the peak formed on the left part of the cycle, represented by the white vertical line), this will be a very bearish signal for Bitcoin. In a balanced market, even in a bear trend, after an 18-month cycle low formation, the market should cross above its cycle line, providing a potential short-term target. Very often, however, the market misses its target. Since its February low, the Bitcoin market has moved sideways, which reinforces this second, more bearish scenario.
The 80 Day Cycle
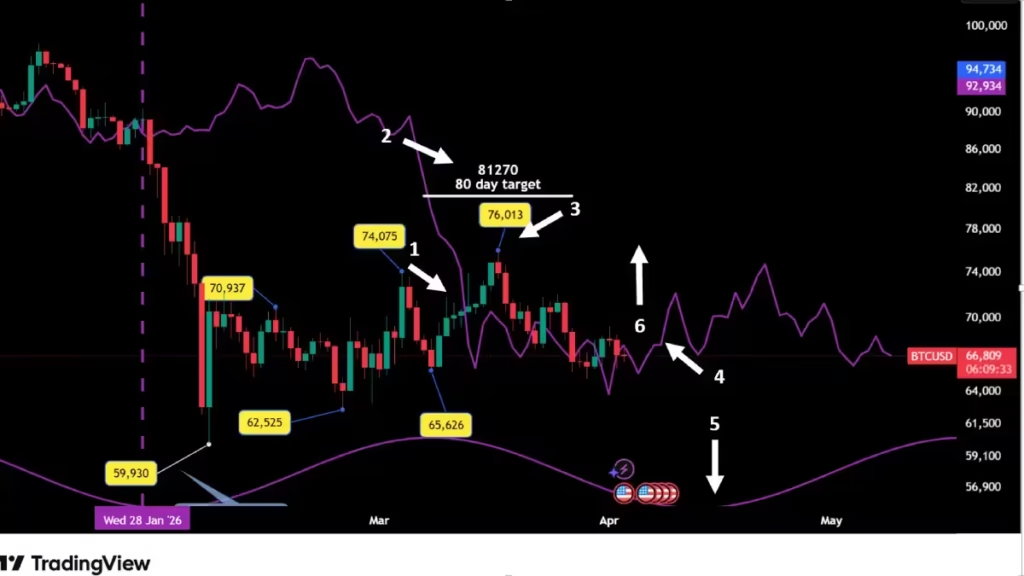
Since the February 6 low, Bitcoin crossed above its cycle line on March 13(arrow1) at $70,700, providing $81,270 as a target (arrow 2). With a $76,013 high on March 17 (arrow 3), the market missed its target, which is usually a bearish sign. However, the target remains valid until the Bitcoin market crosses below its cycle line (arrow 4) without meeting its target. If that does happen, it will be very bearish for the market and we can expect a further sharp decline.
The $76,013 high is the 80-day peak, and we expect the low to form on April 17 (arrow 5). The very important question is where the 80-day cycle low will form comparatively to its cycle line. Technically, after an 18-month cycle formation, the first 80-day cycle low should find support on its cycle line, then rebound( arrow 6) on its way to forming its second 80-day peak before resuming its decline to form the second 80-day low, which will be—by the Hurst principle of synchronization—the 20-week low. If the market forms its second peak above its cycle line during the second 80-day cycle low formation, the market should then cross below its cycle line, providing a downside target for the next 20-week cycle around mid-June.
The 40 Day Cycle
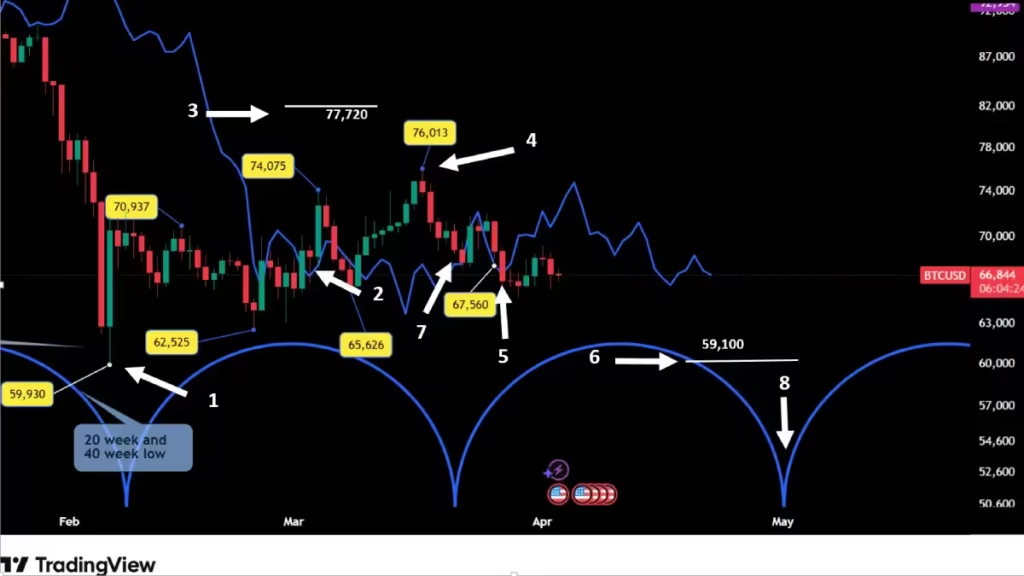
Let us analyze the 40-day cycle now. Since the February low (arrow 1), we have already seen two trading signals on the 40-day cycle. The first one (arrow 2) was when Bitcoin crossed above its cycle line at $68,600 on March 2, providing a $77,720 (arrow3) potential upside target. The March 17 (arrow 4)high missed this target by $1,257 (or 1.6%), which is close to the 1% margin of error, but close enough to state that the market missed its first target. This is a bearish sign, especially as Bitcoin crossed below its cycle line on March 27 at $67,560 (arrow 5), providing a potential downside target at $59,100(arrow 6).
Note that this 40-day target is slightly below the $59,930 February low. The last 40-day low was on March 21 and found support on its cycle line (arrow 7); from there, we expected the market to rebound and maybe meet its upside target, but Bitcoin instead traded along its cycle line. This is not a bullish development, as it means the market does not have enough steam to push the prices higher. What happens next? The 40-day low is expected to form between the second and third week of April (arrow 8).
After forming this low, Bitcoin should technically cross back above its cycle and provide a new upside target. During the third 40-day cycle, which should occur between April 20 and July 28, Bitcoin should cross below its cycle line. We have to monitor with special attention whether Bitcoin will cross back above its cycle line after forming its next low during the third week of April.
Conclusion
In summary, the current technical landscape for Bitcoin suggests we are in a high-stakes environment where disciplined cycle tracking is the only way to filter out prevailing market sentiment. The confirmation of the February low as a major 18-month cycle bottom provides us with a clear “line in the sand” for our primary labels. However, the consistent failure of the market to reach its upside targets—specifically within the 80-day and 40-day windows—serves as a stark reminder that we remain firmly within a bearish phase of the larger 54-month cycle. When a market “misses” its projected targets on the upside and trades sideways along its cycle lines, it is telling a story of exhaustion rather than accumulation.
As we move toward the second and third weeks of April, the formation of the next 40-day and 80-day lows will be the ultimate litmus test for the bulls. If Bitcoin cannot find significant support at these levels and reclaim its cycle lines, the probability of a sharp, accelerated decline toward our downside targets increases substantially. Traders should maintain a neutral to bearish bias as long as price remains capped by the yellow 18-month and blue 40-week FLD lines. These levels are not just arbitrary numbers; they represent the mathematical resistance of the market’s internal clock.
Looking further ahead, the roadmap points toward a challenging path into mid-2027. While short-term relief rallies are mathematically expected, they should be viewed as opportunities to de-risk rather than signs of a new secular bull market. Patience remains the greatest asset in a trader’s toolkit during these final phases. We will continue to monitor the white 54-month cycle line with extreme care, as a breach there would redefine the long-term outlook for the next several years. Stay focused on the cycles, trust the phasing, and let the market prove its strength before shifting your bias.