

ANATOMY OF CYCLES IN STOCK MARKET
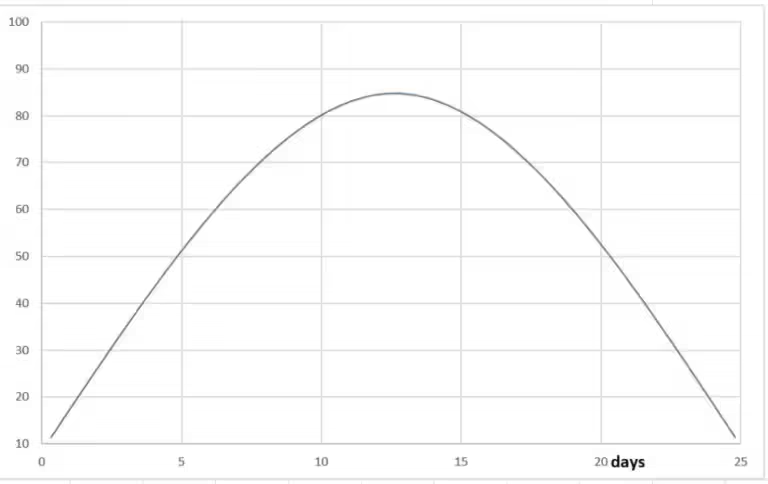
A price wave is a simple, symmetrical, and infinitely repeating oscillation or fluctuation in price from a trough to a crest and back again.
Understand the anatomy of cycles is fundamental.
Above, is a graphic illustration of the shape of such a price wave.
A single repetition of a wave movement is called a cycle.
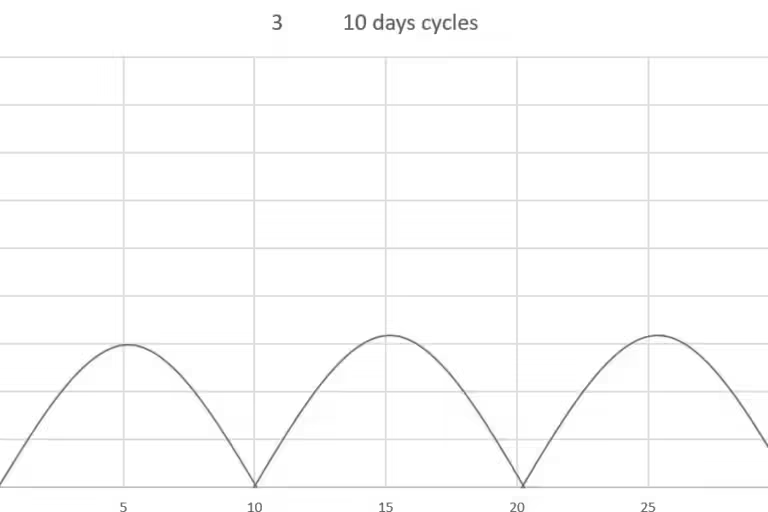
Above only three complete cycles is shown, but the wave itself extends infinitely far to the right.
Such waves repeat themselves cycle after cycle.
As a result, once the wave is identified, its value can be determined at any past or future time.
It is this characteristic of waves that provides a degree of predictability for equity price action.
HOW PRICE ACTION WORKS
THE CYCLE:
Anatomy of Cycles
Stock market cycles typically consist of several phases that reflect the collective sentiment, economic conditions, and market dynamics. Understanding these phases can help investors anticipate market trends and make informed decisions.
There are three different phases that completely describe a wave:
The Amplitude, the period, and the phases.
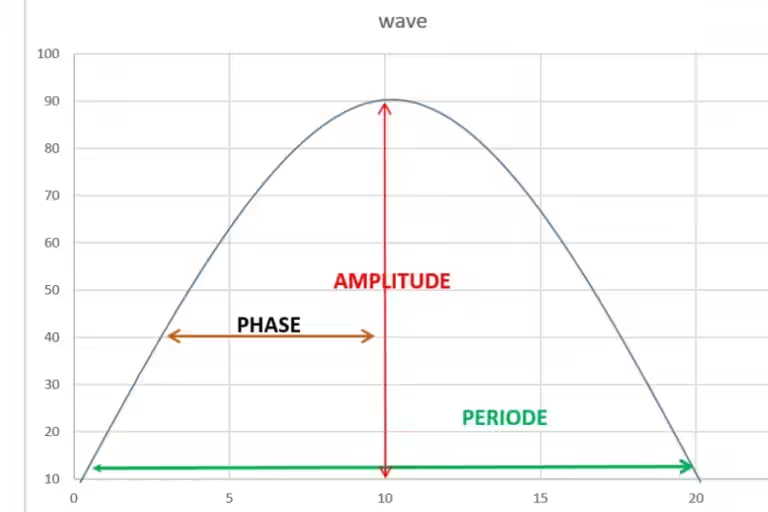
THE AMPLITUDE
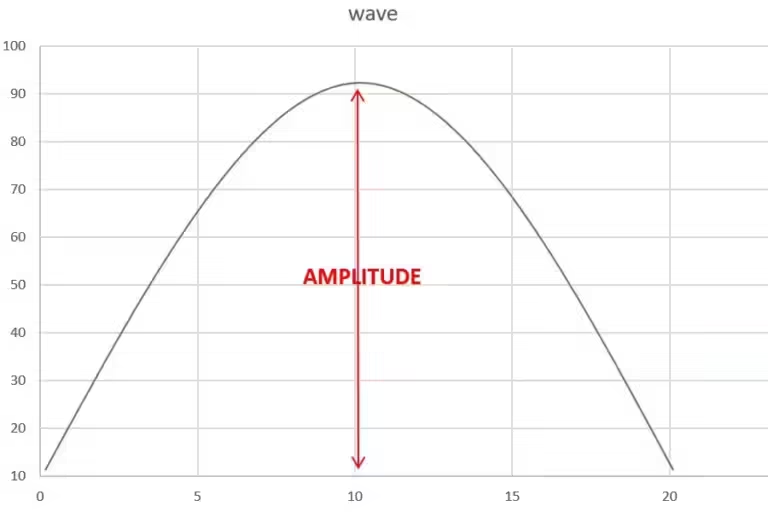
The amplitude of a wave is the extent of the swing from a wave trough to a wave crest, reflecting volatility.
For a price wave, the amplitude is expressed in dollars and cents, in points for the futures market, or some other monetary denomination depending the market.
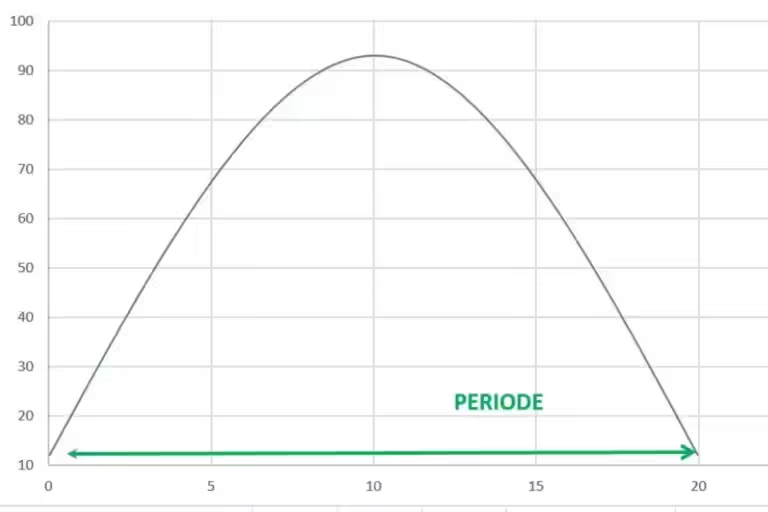
THE PERIOD
The period of a wave is the time span required to complete one full cycle of that wave.
Period is expressed in units of time, such as minutes, hours, days, weeks, or month’s even years.
The period is the quantities use the most in the J.M.Hurst principle, and is one of the most important topic in his principle.
Hurst build his nominal cyclic model from the periods.
I already posted a complete article about the periods.
THE PHASES
The phases indicate the current stage within the cycle.
Like the period, the phase is expressed in units of time, such as minutes, hours, days, weeks, or month’s even years.
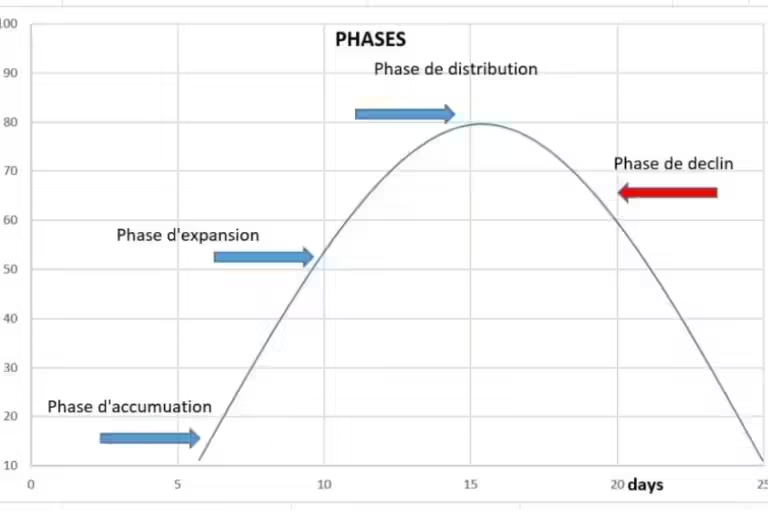
Stock market cycles generally follow a repetitive pattern.
The phases of these cycles include the accumulation phase, the distribution phase, and the markdown phase.
Each phase represents a different stage in the market’s overall trend, from periods of growth to periods of decline.
Accumulation Phase and Markup Phase:
This phase occurs after a market bottom, when investors begin to buy stocks at lower prices, believing that the worst is over.
It is characterized by relatively low trading volumes and stable prices as smart money (institutional investors) starts accumulating stocks.
The overall market sentiment is still negative, with many investors wary of further declines.
Investors who enter the market during this phase often do so based on the belief that the worst of the downturn is over and that better times are ahead.
Markup Phase:
Following the accumulation phase, the markup phase is marked by rising stock prices and increasing investor confidence.
More investors enter the market, and trading volumes rise as the broader public becomes optimistic about future gains.
Investor sentiment turns positive, with more participants expressing optimism about future gains.
During the markup phase, early investors who accumulated stocks during the previous phase see substantial gains.
Momentum builds as more investors join in, pushing prices higher.
This phase often coincides with positive economic indicators, strong corporate earnings, and favorable market conditions.
Distribution Phase:
In this phase, the market reaches its peak, and early investors start selling their holdings to lock in profits.
The distribution phase is characterized by high volatility and increased trading volumes as selling pressure mounts.
Sentiment is mixed, with some investors remaining optimistic while others become cautious and start to sell.
During the distribution phase, smart money gradually exits their positions, transferring ownership to less experienced investors who may be late to the party.
Markdown Phase:
This phase follows the distribution phase and is marked by declining stock prices and increasing pessimism.
Investors start selling off their positions, leading to a downturn in the market.
This phase continues until prices stabilize and a new cycle begins.
Understanding these phases helps investors recognize potential turning points in the market,
Trading activity may decline as investors become risk-averse and hesitant to buy.
Investor sentiment turns negative, with many participants expecting further declines.
The markdown phase can be painful for investors who failed to recognize the distribution phase.
Prices continue to fall until they reach a level where value-oriented investors perceive them as attractive, setting the stage for the next accumulation phase.
Conclusion
Stock market cycles are complex.
That where the Hurst cycle principle can help investors to understand the distinct phases of cycles, and provide investors with valuable insights into market trends for potential turning points, to boost their profits.
THE PRINCIPLE OF SUMMATION
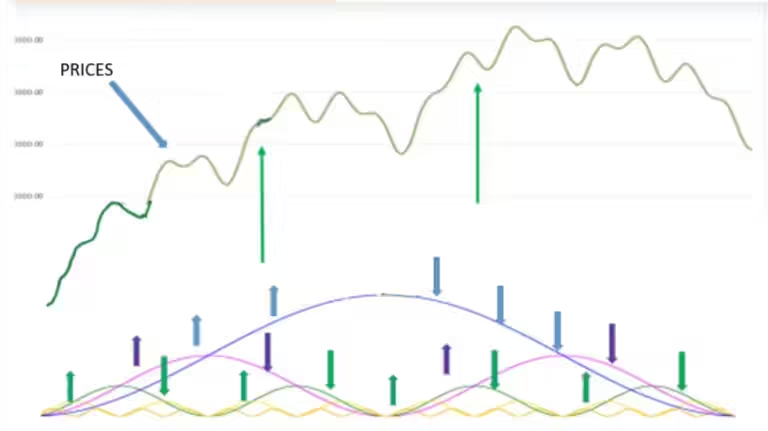
Price waves having different periods and amplitudes.
By combining them, with a simple addition, this will form the complex price action observed in stock and commodity price charts.
This fact is referred to as the Principle of Summation.
The price movements of all stocks, all contracts of all commodities are the result of such a summation.
The process of summation is illustrated in the following charts.
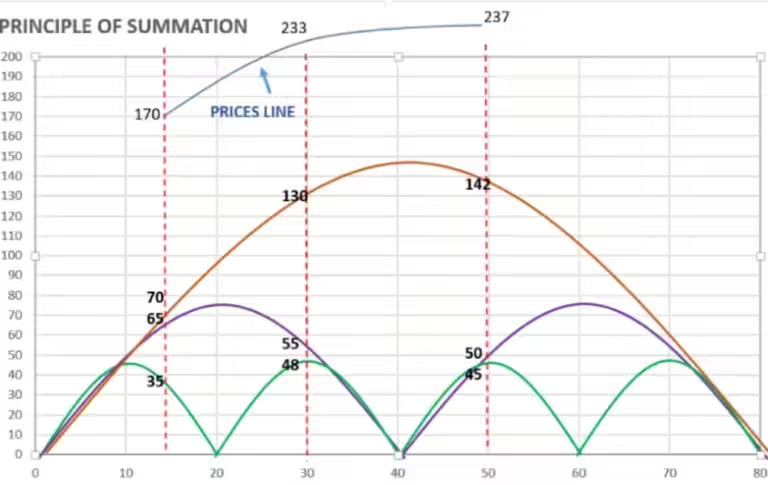
THE PRINCIPLE OF SUMMATION
In this figure note the values of cycle A (20 days cycle) the green line, and B (40 days cycle) the purple line, and C (80 days cycle) the brown line at the time represented.
Using the dotted line,
At this time cycle A has a value of 35, cycle B has a value of 65, cycle C has a value of 70, Adding these three values, results in a sum of 170.
This is the value that is then plotted for the composite wave D (the blue line) for that moment in time.
Similarly, at the time represented by the second dotted line, cycle A is 48, cycle B value is 55, and cycle C value is 130 .
The corresponding composite wave D (the prices line in blue) value is therefore 233
At the right-most dotted line, cycle A is at 45, cycle B is at 50, cycle C is at 142 and the resulting value of the composite wave D, (the blue line) is 237.
The summation process is only shown for the three times indicated by the dotted lines,
But if this same procedure were used for each time value for which cycle A, B and C, are shown in this figure, then the result would be the composite wave D over the full time interval shown.
cycle A, B and C are called components of the composite wave D.
It is very important to understand the principle of summation, because the result of the summation build the price line for any stock, indexes or commodity, as show below.
9 Responses