
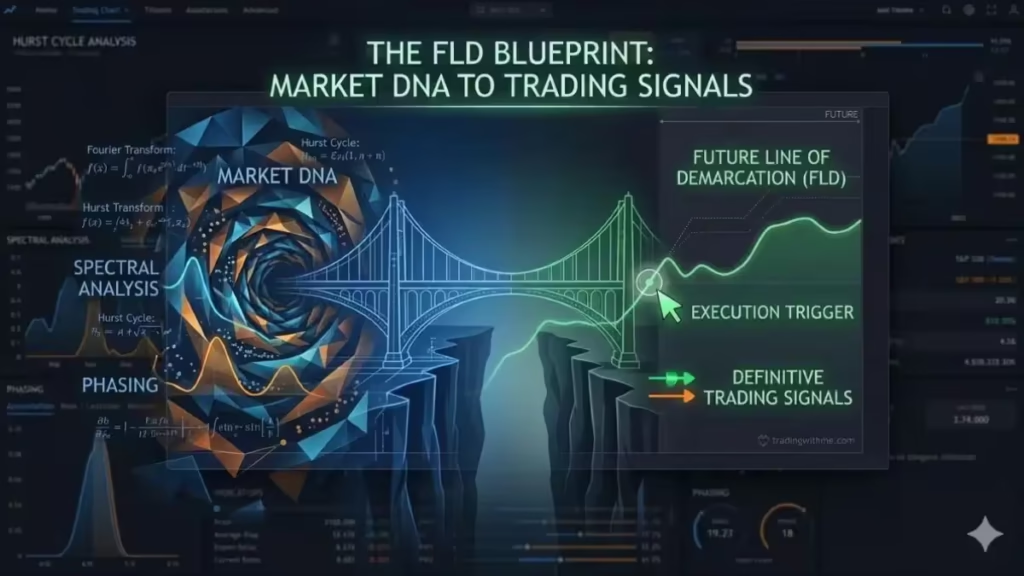
The FLD Blueprint: Turning Market DNA into Definitive Trading Signals
Introduction
The Bridge: From Discovery to Execution.
In our previous deep dive, we successfully decoded the market’s “DNA” through Spectral and Phasing analysis. We learned how to use the radio dial of Spectral Analysis to find the loudest frequencies and how to use Phasing to time the swing of the pendulum. However, knowing that a 42.66-month or an 80-day cycle exists is only half the battle. To a professional trader, a discovery without an execution trigger is just a theoretical observation. This is where the Future Line of Demarcation (FLD) becomes your most powerful ally. The FLD is the bridge between the “what” and the “when” of cycle theory and the “how” of actual trading. It takes the raw cycle lengths we calculated—such as our 14.33-month average—and projects them forward in time to create a dynamic barrier that, when crossed, confirms a cycle turn with mathematical certainty.
The Mechanics of the FLD:
First let see the FLD definition.
FLD is short for Future Line of Demarcation.
There is an FLD associated with each wave of a cyclic model.
The construction of an FLD consists essentially of shifting past prices into the future by a calculated time span called the FLD number.
The first step in the construction of an FLD is to compute this FLD number.
The FLD number is derived as follows:
- Divide the period of the wave on which the FLD is based by 2
- Add 1 to this.
- Round the result to the nearest whole number.
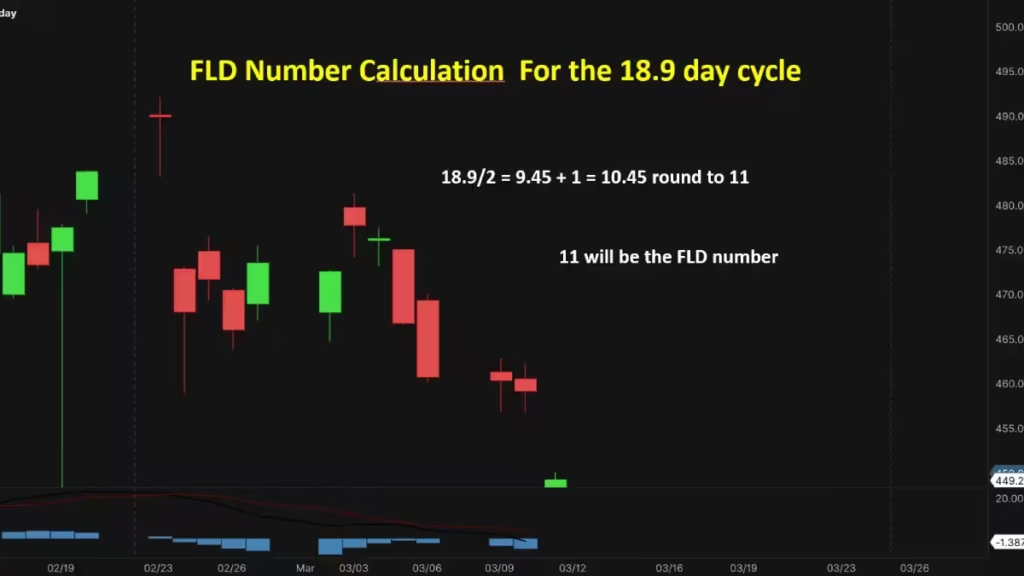
Example if you trade the 18.9 week, 18.9/2=9.45
9.45 +1=10.45 round to the nearest whole number and your FLD number is 11.
The beauty of the FLD lies in its simplicity and its deep roots in the Principle of Summation.
To build an FLD, we take the price action and “shift” it forward by exactly half the duration +1 of the cycle we are tracking.
To reduce the noise, we use the median price of the cycle you want to trade, if we trade the daily time frame we use the median price of the day, for the weekly time frame, use the median price of the week.
To calculate the median price take the high of the time frame you are trading, add the low of the same time frame and divide by 2.
This shifted line creates a “mirror” of the price.
Usually the prices will cross the FLD at the 1/4 of the wave in a past.
When the current price intersects with this shifted line, it signals that a peak or a trough of that specific cycle has been confirmed. Unlike lagging indicators like moving averages that smooth out data and hide the rhythm, the FLD respects the specific frequency of the cycle you are trading.
It acts as a definitive boundary: when price is above the FLD, the cycle is in a rising phase; when it is below, the cycle is falling.
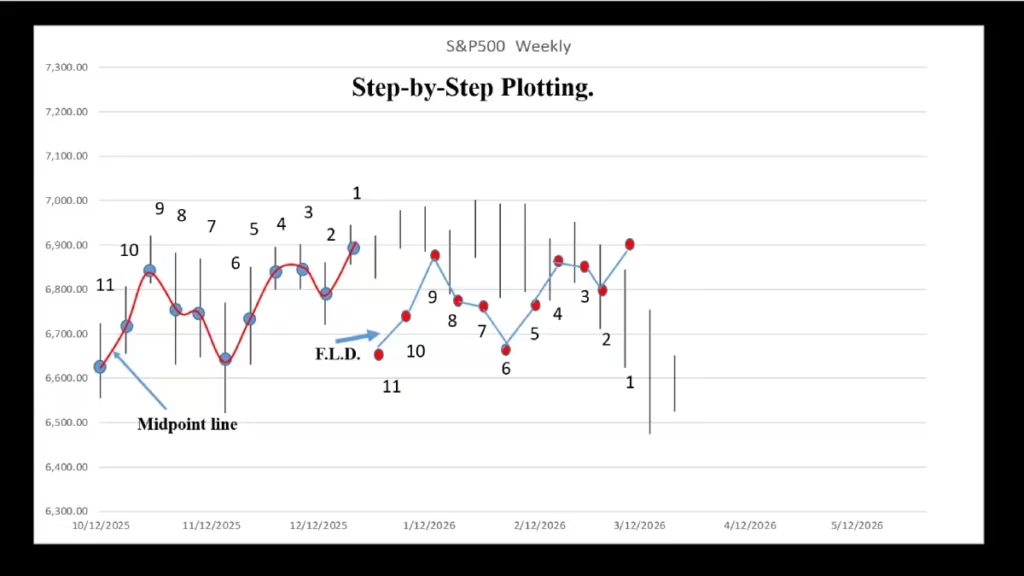
Plotting the FLD on a Price Chart
Drawing the Future Line of Demarcation (FLD) is a straightforward process once you have your specific FLD number. By following these steps, you can project the average price of the past into the future to help identify upcoming market trends.
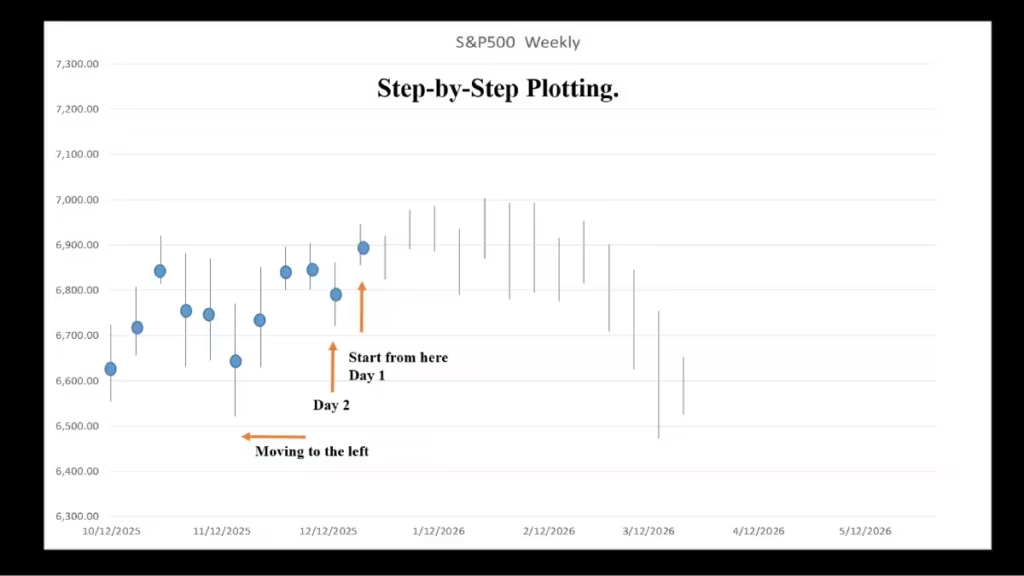
Identify the Starting Point:
Look at the most recent price bar on your chart bar 1.
Count Backwards:
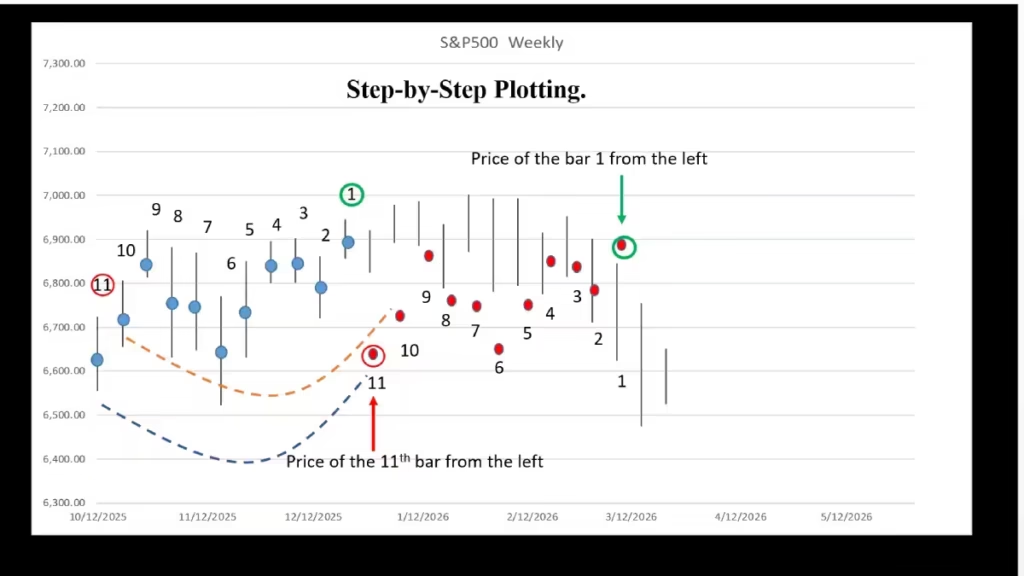
Start with that most recent bar as “one” and count price bars to the left (back in time), one by one, until you reach your calculated FLD number , in our case the 11th bar from the bar 1.
Project the First Point:
Take the average price of that specific bar you just found, bar 11. Now, move to the first “empty” space on the right of your chart (one time unit into the future, the next space from bar 1) and plot that price value there.
Continue the Sequence: Find the average price of the bar immediately to the right of the one you just used. Plot this value in the second future position (two time units to the right of the current price).
Fill the Chart: Repeat this process systematically—moving one bar forward in the past and one space forward in the future—until you either run out of historical price bars or run out of physical space on your chart.
On the 11th bar starting from the bar 1 to the right, you should have the average price of the bar 1.
Drawing the FLD by Connecting the Dots:
Join all these newly plotted future points with short, straight lines. This line is your Future Line of Demarcation for the specific cycle period you are analyzing.
Important Note: If your count lands on a gap when the market was closed (common on daily charts), draw a straight line between the average prices of the bars on either side of that gap. Use the value where that line crosses the gap for your plot.
It is important to understand that you can draw multiple FLDs on a single chart, each representing different waves within a cyclic model. This is a common practice used to get a broader view of market movements. The FLD is a remarkably potent tool in cyclic analysis; its primary strength lies in its ability to estimate or predict price targets for potential shifts—often before the price has even begun to reverse direction.
How FLD’s are related to the waves.
Also when the FLD form a peak in the future, very often the prices will form a low at the time of the FLD peak, conversely when the FLD form a low, there is a very high probability the prices will peak.
Integrating Spectral and Phasing Data for Precision:
Your FLD is only as accurate as the data you feed it. This is why our work in the Spectral Analysis lab was so vital.
If you use a standard 20-day FLD but your Excel Fourier Transform reveals that the actual dominant frequency is currently 22.4 days due to the Principle of Variation, your signals will be early or late.
By integrating the specific averages we calculated—like our six-cycle average for daily timeframes—we customize the FLD to the current “heartbeat” of the market.
When the price crosses the FLD of a shorter cycle (like the 20-day) in the direction of a longer cycle (like the 80-day), you are witnessing the Principle of Harmonic Convergence in action.
This synergy allows you to filter out “market noise” and focus only on the moves that have the mathematical backing of multiple cycle layers.
The definitive power of the FLD is found in its ability to provide clear entry and exit signals that are not based on emotion, but on cyclic completion. An upward cross of the FLD following a projected Phasing trough provides a high-probability “Buy” signal, as it confirms the cycle has turned upward.
Conversely, a downward cross following a peak provides a “Sell” or “Short” signal. For the advanced trader, the FLD also offers price targets; the distance from the trough to the FLD intersection is often mirrored once the cross occurs, giving you a calculated goal for the move.
By using the FLD, you stop chasing green candles and start entering trades exactly when the cycle’s momentum shifts. It transforms the Dow Jones, Bitcoin or S&P 500 from a chaotic chart into a predictable series of waves where the FLD acts as your shoreline.
Understanding FLD Principles and Market Predictions.
The effectiveness of the Future Line of Demarcation (FLD) is rooted in the factual way cycles and principles govern equity price movements.
When you apply the FLD process to a single, ideal wave, it creates a second wave that is identical to the first, but shifted forward in time by exactly one-half of the wave’s period.
This relationship between the price and the FLD reveals three highly useful characteristics for students of market analysis:
When the FLD shows a low point (trough) in the future, that is the exact time the actual price wave is expected to reach its high point (crest).
Conversely, when the FLD shows a peak (crest) in the future, the actual price wave will likely be at its lowest point (trough).
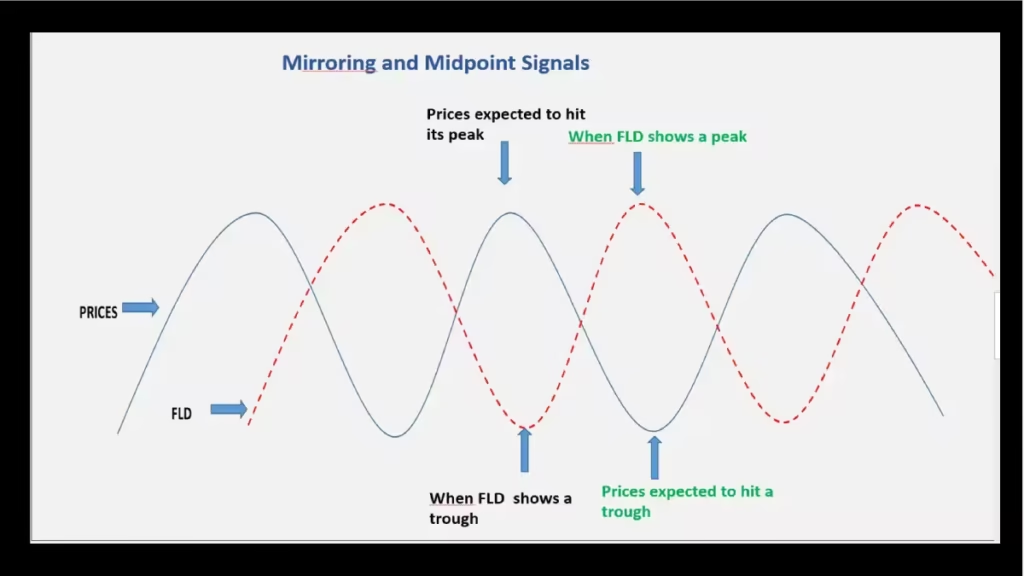
FLD and Prices in Opposing Directions:
When the FLD is trending downward in the future, the price wave will be trending upward during that same period.
Similarly, if the FLD is moving up, the price wave will be moving down.
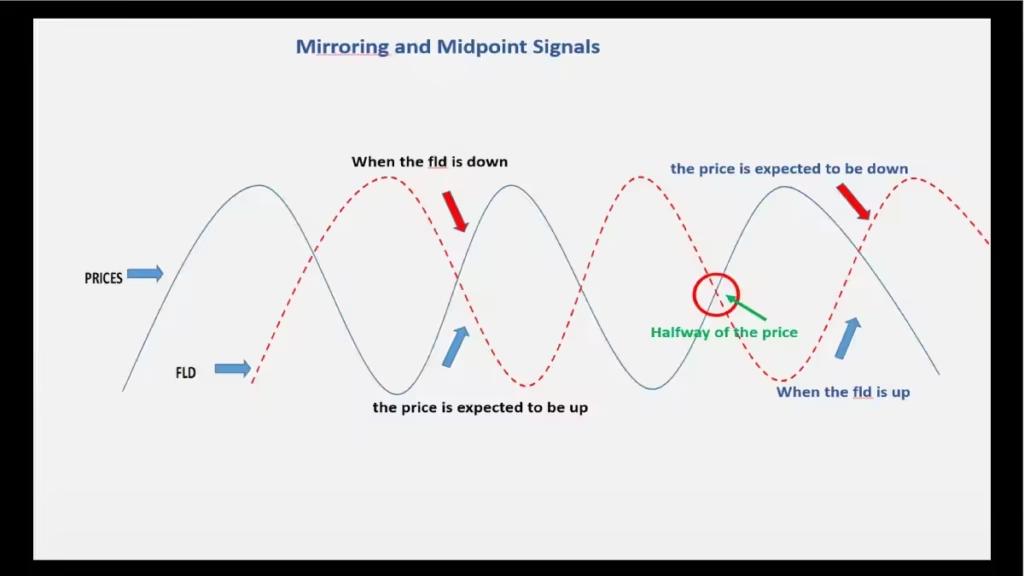
The Midpoint Signal:
When the price moves up and crosses through the FLD, it indicates that the price already formed a bottom (trough) exactly one-fourth of a wave period ago.
Furthermore, it suggests the price is currently halfway to its ultimate peak for that cycle.
On the flip side, when the price drops through the FLD, a peak (crest) occurred one-fourth of a wave period in the past, and the price is halfway down to its expected bottom.
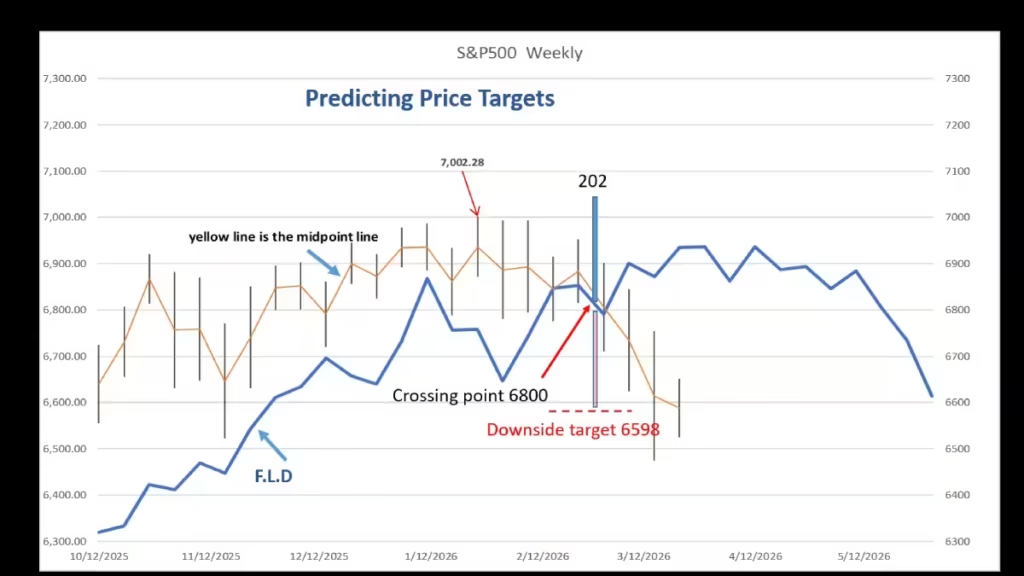
Predicting Price Targets via FLD Interaction.
An FLD “break” occurs when the average price moves to the opposite side of the line it has recently occupied. This interaction allows us to predict how far a price might move.
Downward Break:
If prices have been above the FLD and then break below it, look back into the past by one-half of the wave’s period. The highest price in that window is likely the cycle’s crest. The distance the price fell from that high to the point of the break is your “measuring stick.” You can expect the price to continue falling by that same amount below the break point before it hits its final low.
Upward Break:
If prices have been below the FLD and then break above it, look back one-half of the wave’s period. The lowest price in that window is likely the cycle’s trough. The amount the price rose from that low to the break point is the predicted further gain. Expect the price to move higher by that same amount before reaching its next peak.
Practical Application: Entry and Exit Signals
To turn these observations into actionable trading goals, follow these calculation steps:
For a Downward FLD Break:
1) Find the price bar representing the most recent crest (top) of the specific wave, $7202
2) Calculate the difference between the highest point of that bar $7200 and the price at the exact moment of the FLD break $6800, the difference is $402.
3) Subtract that difference from the break point price. This lower price now becomes your estimated price objective, $6800 -$202=$6398.
$6398 is the estimate potential downside target.
For an Upward FLD Break:
1) Find the price bar representing the most recent trough (bottom) of the specific wave you are analyzing.
2) Calculate the difference between the lowest point of that bar and the price at the exact moment of the FLD break.
3) Add that difference to the break point price. This resulting number is your estimated price objective.
Leveraging Insights from Multiple FLDs.
While a single FLD is a helpful tool, the true strength of this concept is revealed when you analyze the patterns formed by all the FLDs in a specific cyclic model.
By looking at how multiple lines interact, you gain a much deeper understanding of market momentum and potential turning points.
FLD Location vs. Price.
The relationship between where the price sits and where the FLDs are located can tell you a lot about market stability:
During an Uptrend:
When prices are rising, FLDs generally stay below the price action. However, the more FLDs that gather below the price, the more “vulnerable” the price becomes to a downward drop.
During a Downtrend:
When prices are falling, FLDs tend to stay above the price. As more FLDs stack up above the price, the likelihood of an upward reversal increases. You can think of this as a “magnet effect”: FLDs act like weights or magnets that eventually try to pull the price back toward them.
FLD Distribution (Spacing and Alignment)
The way FLDs are spaced and the angle at which they move provide clues about the strength of a coming move:
Parallel and Steep:
If several FLDs are all moving sharply in the same direction and are evenly spaced, any price reversal that occurs is likely to be fast and significant.
Irregular Spacing:
If the gaps between FLDs are inconsistent—wide in some places and narrow in others—it suggests that any potential price reversal will be weak or “spotty.”
Flat Lines:
When FLDs are moving horizontally (flat), they act as strong barriers that the price is unlikely to break through during a reversal.
The FLD Pause Zone.
Sometimes, one or more FLDs will move in a flat, wavy, horizontal pattern in the future section of your chart. This indicates a Pause Zone. When prices reach the area represented by this zone, they are likely to stop moving or hesitate before continuing.
The FLD Cascade Effect.
One of the most powerful phenomena is the Cascade Effect.
This happens when the price breaks one FLD, and the resulting price projection (the target) is far enough to cause a break of the next FLD. This creates a domino effect, projecting even larger price moves.
A cascade typically ends in three scenarios:
The price projects into a large empty gap between FLDs.
The price hits a “reversal pause zone.”
There are no more FLDs left to break in that direction.
Conclusion
Mastering the ultimate Cycle Tool,
The Future Line of Demarcation is truly the ultimate tool in the J.M. Hurst toolkit because it provides the one thing every trader craves: confirmation.
We have moved from the broad “Visual Scan” of history to the high-precision “Data Scan” of Excel, and finally to the interactive “Map” of the FLD.
By mastering this tool, you are no longer guessing where the market might go; you are calculating where it must go based on its own internal rhythms.
The FLD doesn’t just show you the path; it gives you the signal to walk it. In our next analysis, we will explore how to combine these FLD signals with Valid Trend Lines (VTLs) to add a second layer of confirmation, ensuring that your trading strategy is as robust and scientific as the market cycles themselves.
Discover more from tradingmarketcycles
Subscribe to get the latest posts sent to your email.