
S&P 500 Market Outlook:
Are Hurst Cycles Signaling a Major Summer Correction?
Introduction
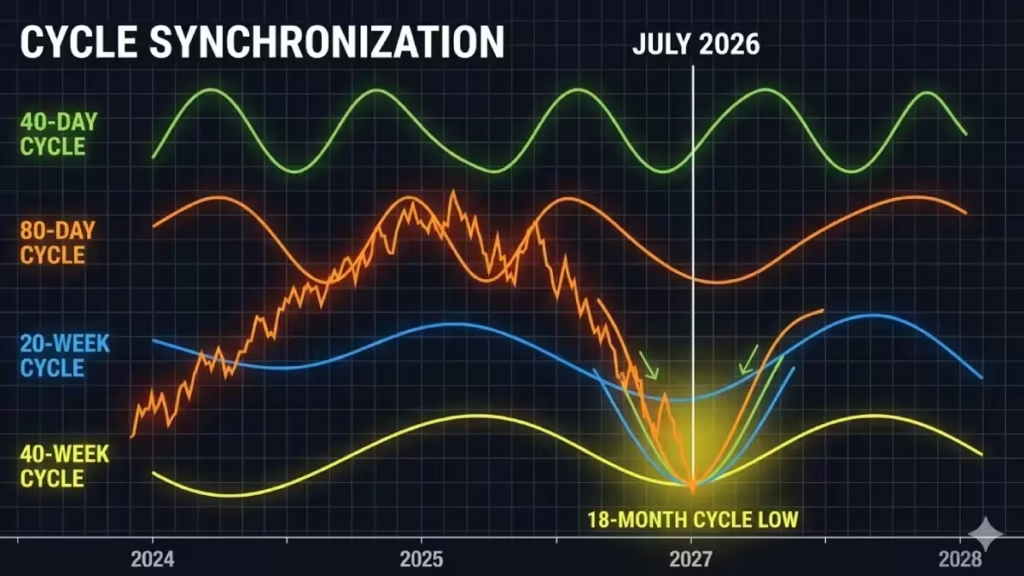
The sideways trend is over, and the signals are turning red. This week, the S&P 500 broke a critical trend line, confirming that a major peak is now behind us. Many investors are wondering: Are we headed for a sharp correction into the summer? While we have hit our immediate short-term targets, the 18-month cycle low is still months away. In this analysis, we break down exactly what the Hurst cycles are telling us about the road to July and why the current market structure suggests a significant shift in momentum.
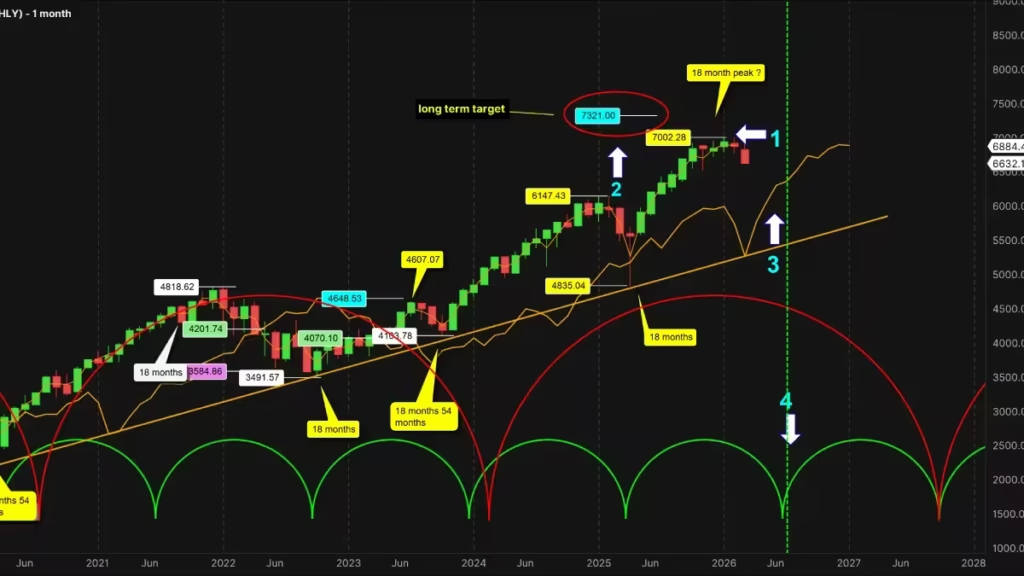
The 18 Month Cycle
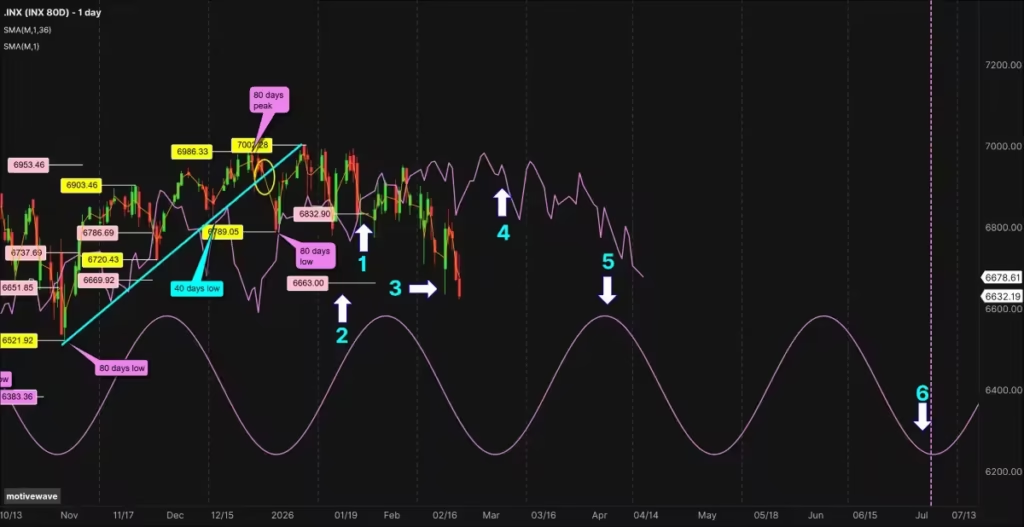
There is a very high probability that the 7,002.28 all-time high reached in January represents the 18-month cycle peak (Arrow 1). If that is the case, the S&P 500 missed its 7,123 long-term target (Arrow 2), which is typically a bearish sign. If the peak is confirmed, we can expect the S&P 500 to decline to at least its cycle line (Arrow 3). The 18-month cycle low formation is still expected to occur between July and August.
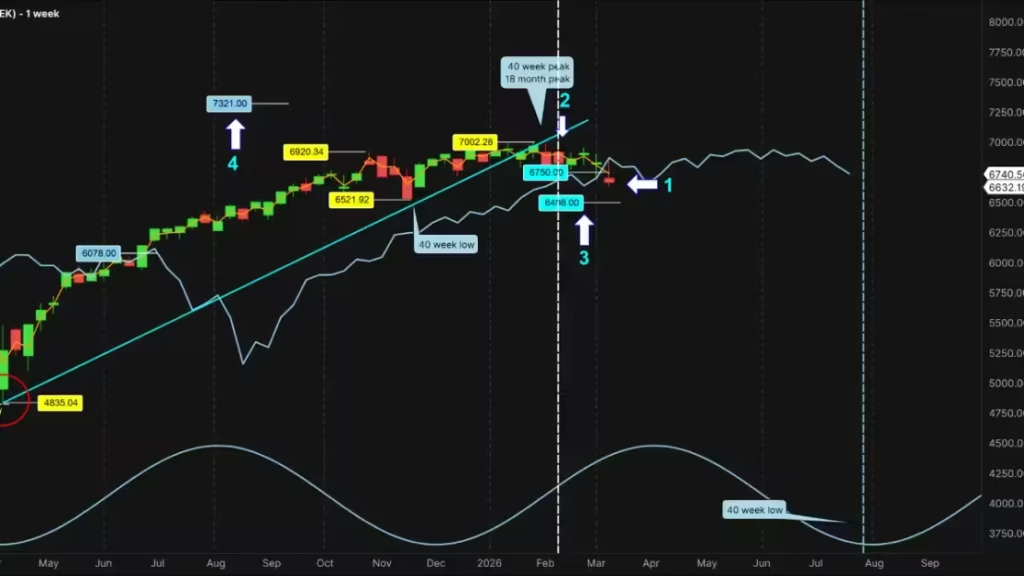
The 40 week Cycle
On the 40-week cycle, we finally have a signal regarding the S&P 500’s potential direction. The index has crossed below its cycle line (FLD) (Arrow 1), a move that also confirmed a crossing below its 40-week cycle trend line (VTL) (Arrow 2). This is highly valuable information for the future trend. As Hurst suggests, a crossing below a VTL not only confirms the peak of the current cycle but also confirms that the peak of the next longer cycle—the 18-month cycle—has formed or is currently forming.
Another critical piece of data is the placement of the 40-week cycle peak. It formed on the left side of the cycle (represented by the white vertical line), which is typically a bearish sign. In this case, we can expect a sharp correction leading into this summer. Since the S&P 500 crossed its cycle line at 6,750, it has provided a potential downside target of 6,498 for the 40-week cycle (Arrow 3).
To validate this target, we need the S&P 500 to continue trading below its cycle line this week. This would mark the first trading signal of 2026. Furthermore, because the 7,321 (Arrow 4) upside target was never met, this crossing confirmation will invalidate that target—another bearish sign. We can expect this 40-week cycle low to find support even lower than the 6,498 level, but for now, 6,498 remains our primary target. When a target is not met, it doesn’t mean the cycles aren’t working; rather, it provides a “missed target” signal. Missing an upside target is usually bearish, while missing a downside target is typically bullish.
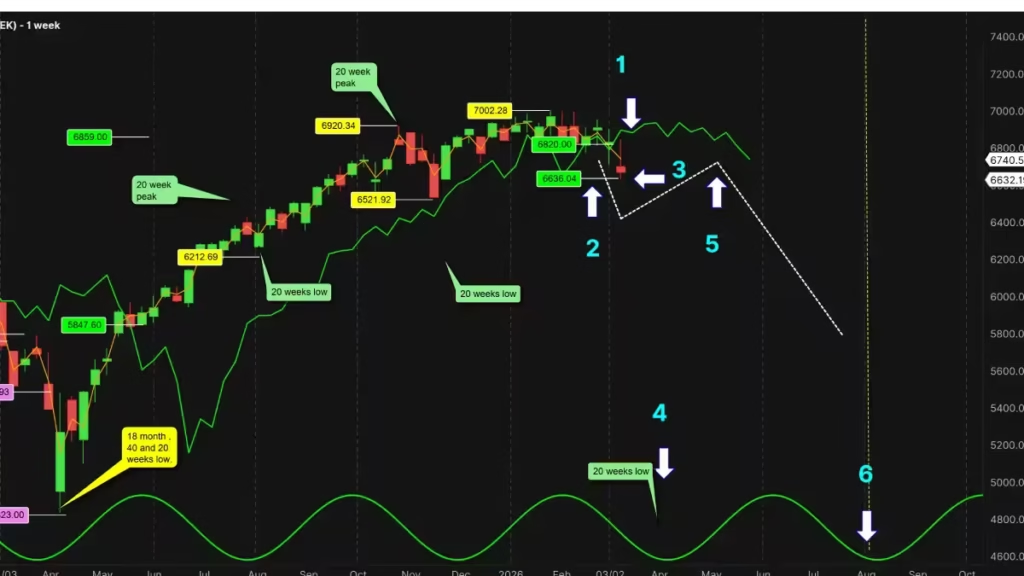
The 20 week Cycle.
As anticipated in my last update, the S&P 500 crossed below its cycle line (Arrow 1) at 6,820, providing a downside target of 6,640 (Arrow 2). With last week’s low hitting 6,636.04 (Arrow 3), the S&P 500 has officially met this target, maintaining a 100% success rate for this cycle. We expect the market to continue its decline until the last week of March or the first week of April (Arrow 4), where the next 20-week cycle low should form. From there, the S&P 500 will likely rebound toward its cycle line (Arrow 5), using it as resistance rather than crossing above it, before resuming the decline into July or August to form the fourth and final 20-week cycle of this 18-month period (Arrow 6).
The 80 Day Cycle.
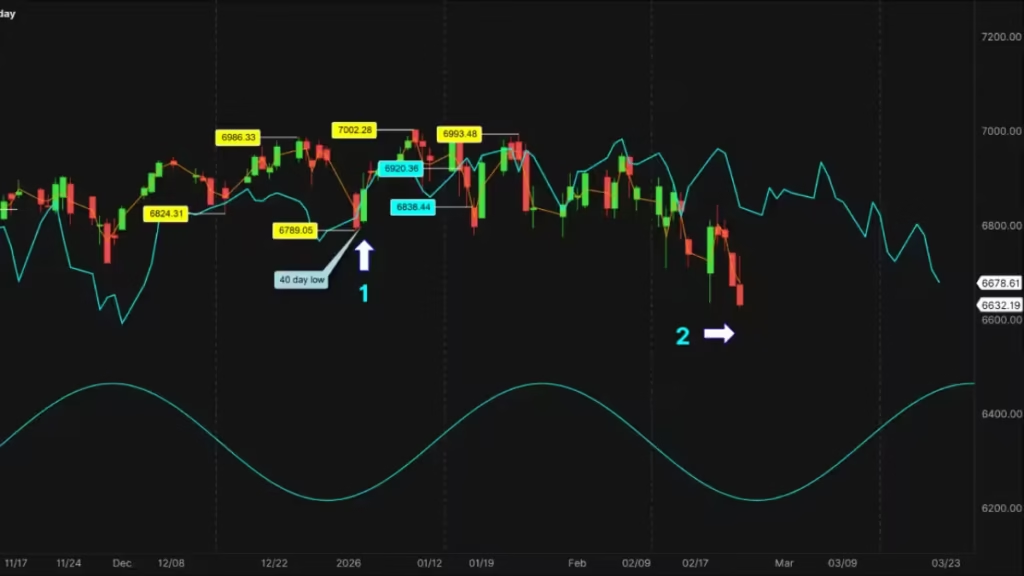
The S&P 500 crossed below its cycle line at 6,832.90 on February 13 (Arrow 1), providing a 6,663 downside target (Arrow 2). With the 6,623.92 low on March 13 (Arrow 3), this target has also been met. During the next rally following the current 80-day cycle low, the index should climb back above its cycle line (Arrow 4) and provide a new upside target. We expect the next 80-day cycle peak to form by late April (Arrow 5). After peaking, the market should cross back below its FLD on its way to the final 80-day cycle low due in July or August (Arrow 6). Per the Hurst principle of synchronization, the S&P 500 will simultaneously form all longer cycle lows up to the 18-month cycle. This convergence suggests a sharp decline, especially if the next 80-day peak forms on the left side of the cycle.
The 40 Day Cycle.
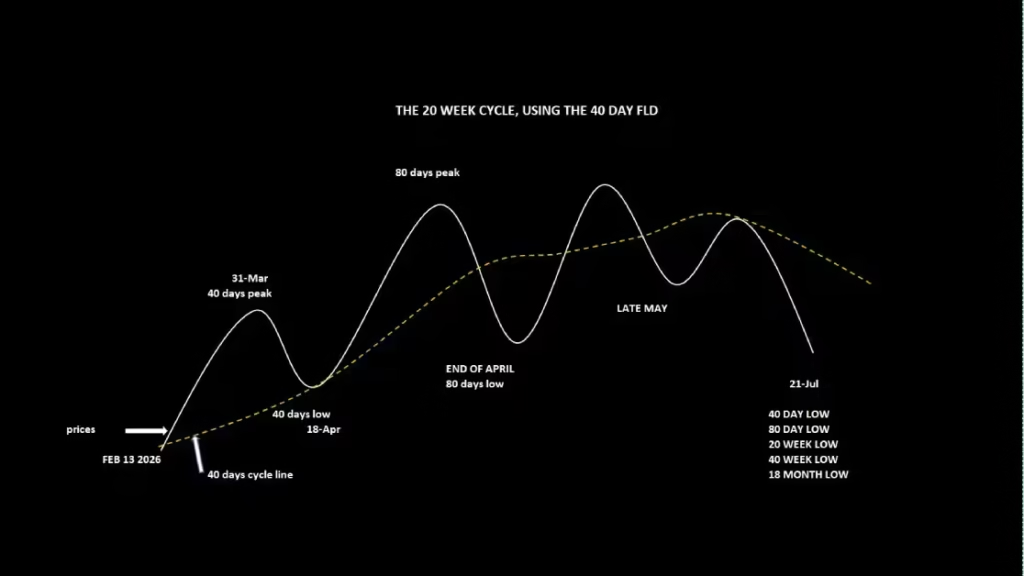
Finally, we examine the 40-day cycle. The last 40-day low formed on January 20 (Arrow 1), and the next is expected around now (Arrow 2). For this analysis, let’s assume the 40-day low formed last Friday, March 13. If it forms later, we will simply adjust the dates.
Following this low, we expect the market to cross above its cycle line, providing an upside target and reaching its first 40-day peak around March 31.
The market should then form its first 40-day low on the cycle line around April 18. To maintain a bullish short-term stance, it is vital that the S&P 500 finds support on this line; a sharp crossing below it would be a bearish warning. After this low, a new rally toward the second 40-day cycle peak will begin. It is crucial to monitor where this peak occurs relative to the cycle peak, expected in the third week of April. A “left-translated” peak (forming early) would be negative, signaling a sharp correction ahead.
Once the 80-day peak is confirmed by prices crossing below the 40-day VTL, the S&P 500 will cross below its cycle line, providing a downside target for the 80-day low at the end of April. Following that low, the market will briefly cross back above its cycle line for one last peak before the 18-month low. Finally, the index will cross back below its cycle line, giving a definitive target for the final 80-day low. Before reaching the ultimate bottom, the market will form a preliminary low in late May, rally toward the cycle line (using it as resistance), and then resume its decline toward the final 40-day low on July 21. By synchronization, this July 21 low will mark the bottom for the 80-day, 20-week, 40-week, and 18-month cycles.
The 20 Day Cycle.
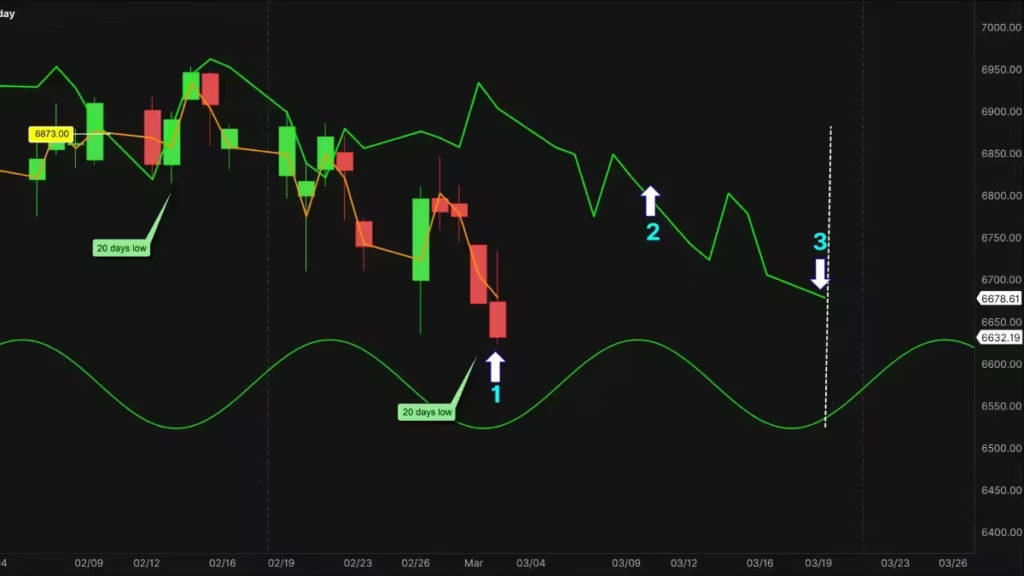
There is a very high probability the 20-day cycle formed on March 13 (Arrow 1). The S&P 500 should now rebound and cross above its cycle line (Arrow 2), providing a potential upside target. When the S&P 500 crosses above its cycle line, this will confirm that the previous low before the crossing is the last 20-day cycle low and will also confirm the very short-term bullish pattern. After forming its 20-day cycle peak around March 22, the S&P 500 should form its next 20-day cycle low on its cycle line (Arrow 3) around March 31. If, during this low formation, the S&P 500 crosses sharply and trades for a few days below its cycle line, this will be another bearish sign.
Conclusion
In summary, the technical evidence provided by Hurst cycle analysis suggests we are entering a period of increased volatility and downside pressure. The confirmation of the VTL crossing and the series of missed upside targets point toward a significant bearish shift that cannot be ignored. While short-term relief rallies are expected in April as the shorter cycles bottom out, the overall synchronization of cycles suggests a heavy correction culminating in late July. Investors should treat upcoming rallies with caution, as the underlying trend has shifted. Watch the 6,498 target closely as the first major level of support; a failure to hold there could accelerate the move toward the 18-month cycle trough.
Discover more from tradingmarketcycles
Subscribe to get the latest posts sent to your email.