
S&P 500 Analysis March 2026:
Healthy Consolidation or Major Peak?
Introduction
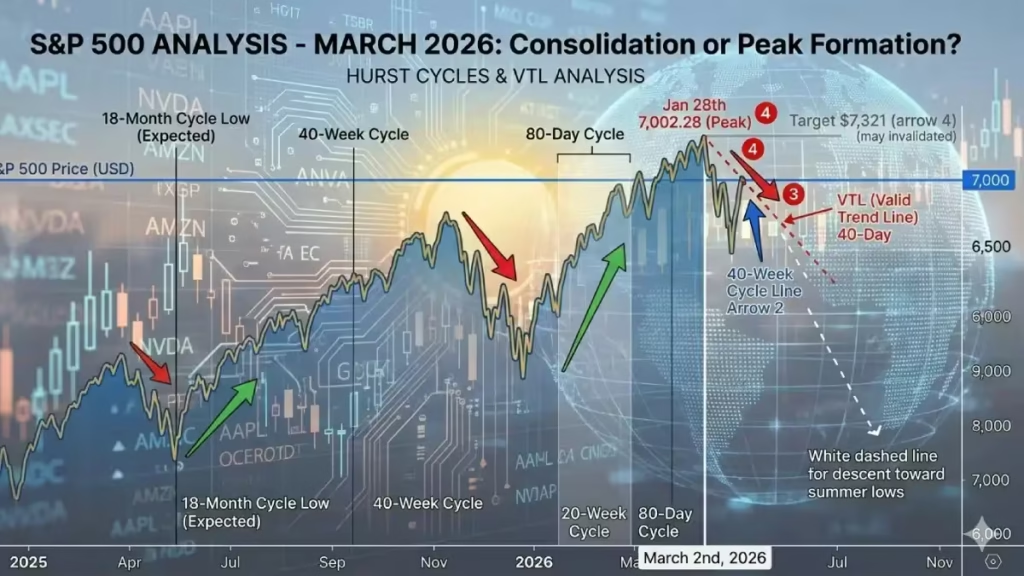
This week, we are diving deep into a critical S&P 500 analysis for March 2nd, 2026. Since hitting 7,002.28 on January 28th, the market has been grinding sideways. Is this a healthy consolidation, or are we witnessing a major peak formation? When the market moves laterally, identifying short cycles with absolute certainty is a challenge. Let’s dive into the data together to see if we can uncover the answer!”The 18-Month Cycle:
The 18 Month Cycle
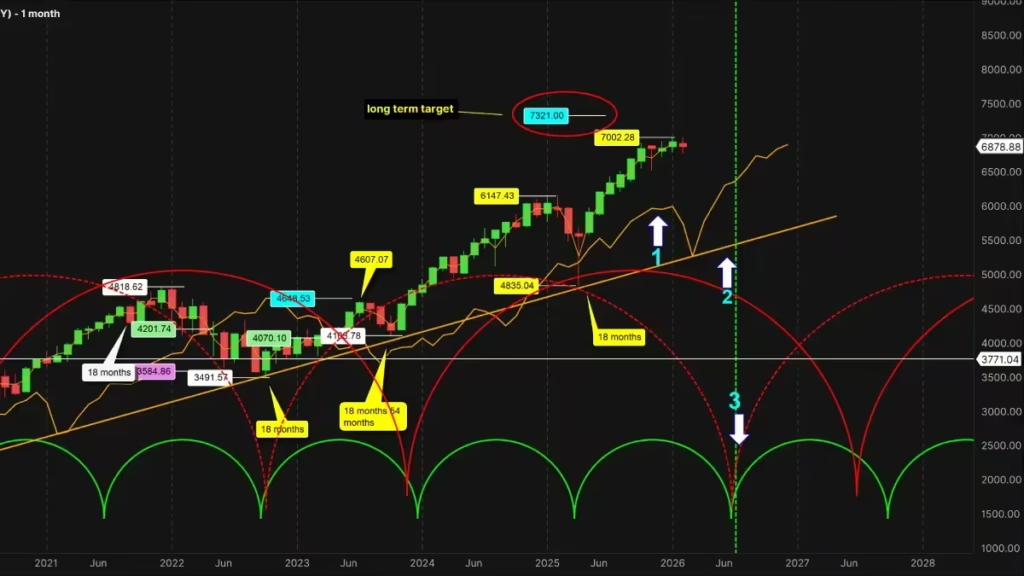
Since our last update in early February, the monthly chart hasn’t provided much new data.
Our 40-week cycle target of $7,321 remains valid, as the market is still trading above its cycle line ( arrow 1)and it’s Valid Trend Line (VTL) arrow 2. From a long-term perspective, the S&P 500 remains bullish. The first warning sign of a reversal will be a cross below the cycle line, followed by a crossing below the VTL to confirm a true bearish trend. We are still anticipating the next 18-month cycle low this summer( arrow 3).
The 40 week Cycle
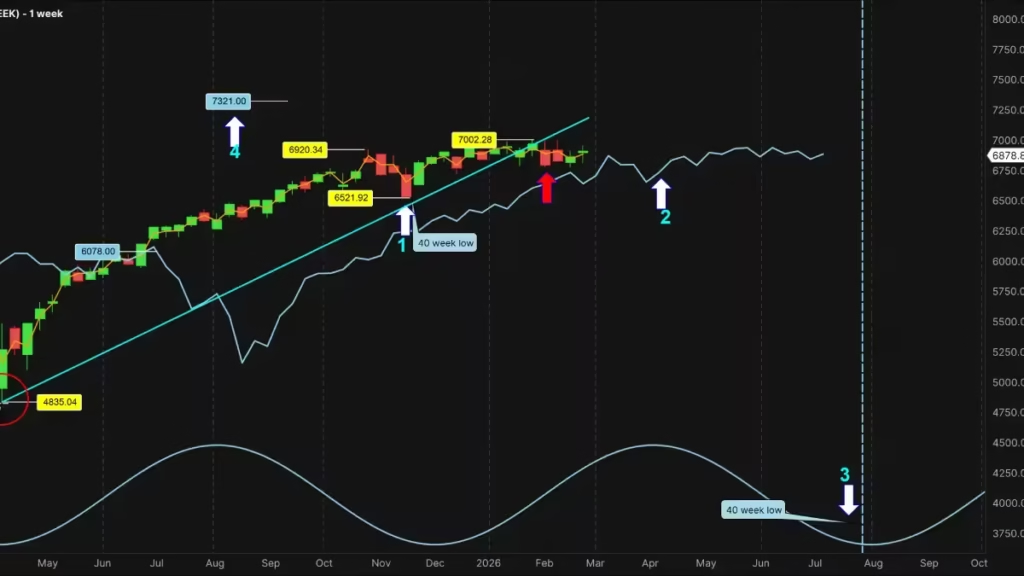
Moving to the 40-week cycle,I previously discussed two potential scenarios for the cycle low. The first was November 21st, and the second was late January. Based on recent price action, November 21st, 2025, remains the superior label for the 40-week low (arrow 1).
Recently, the S&P 500 dipped slightly below its VTL (red arrow). While a sharp move below this line is a major bearish signal, the current sideways drift makes the signal a bit murky. Technically, a VTL cross suggests the next longer cycle—the 18-month cycle—has peaked or is currently forming that peak. Is the 18-month peak already behind us? High probability suggests yes. We must monitor the 40-week cycle line (the blue FLD on your screen , arrow 2). A break below this would confirm both the 40-week and 18-month peaks, signaling a bearish trend until the next lows in July or August 2026 (arrow 3). The $7,321 target ( arrow 4) stands unless we cross the 40-week cycle line first.
The 20 week Cycle
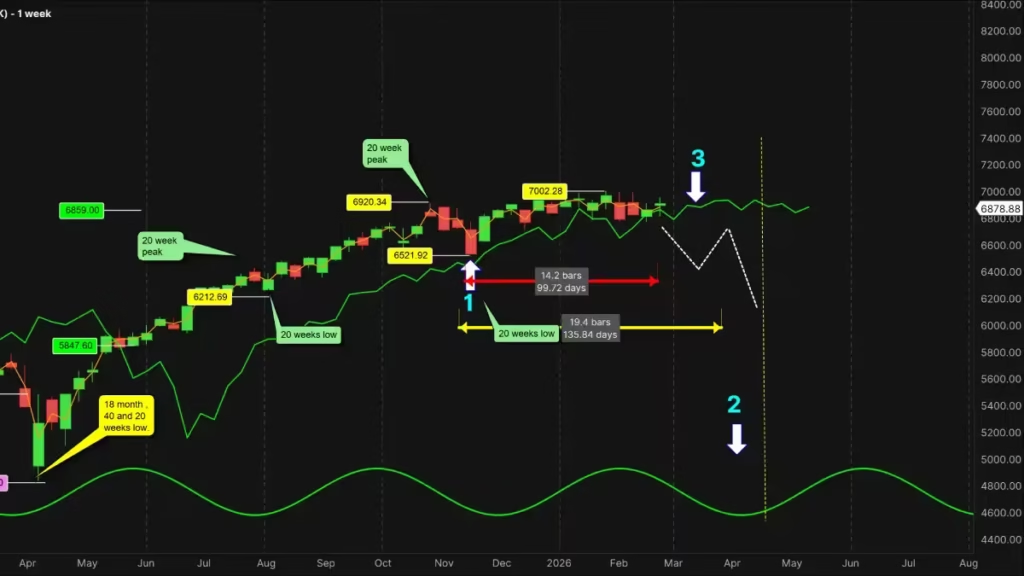
Per the Hurst Rule of Synchronicity,
the last 20-week low matched the 40-week low on November 21st ( arrow 1). We’ve traded near the cycle line for two weeks, with 14 weeks now elapsed( the red horizontale line) To hit the Hurst nominal average of 19.48 weeks, we need about 5.5 more weeks ( the yellow line), placing the next low in late March or early April( arrow 2). We expect the S&P 500 to cross below its cycle line shortly (arrow 3) and stay under until that low forms, eventually acting as resistance during the final descent toward the summer lows in July or August, the white dashed line.
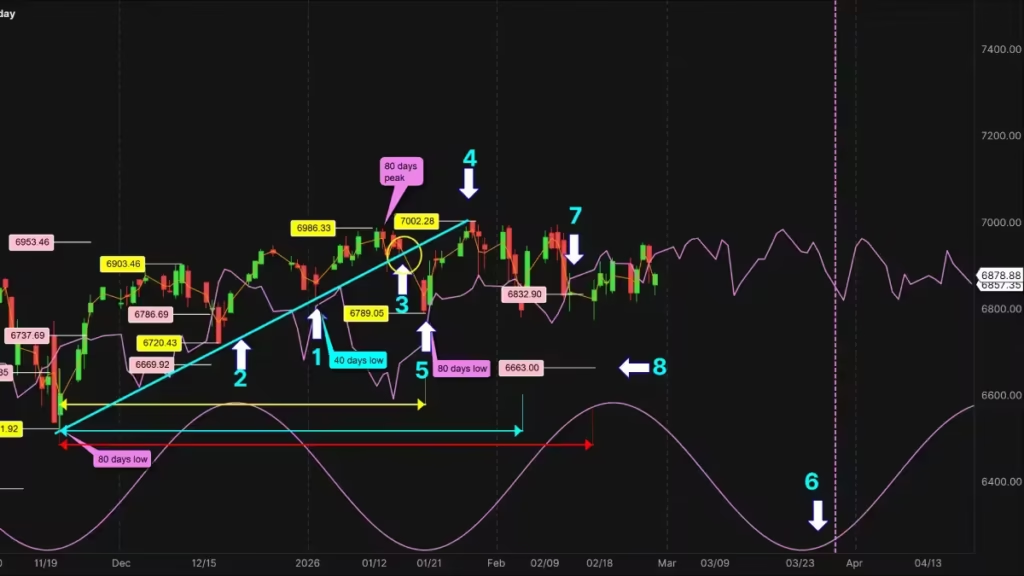
The 80 Day Cycle
The 80-Day Cycle:Let’s look at the 80-day cycle—a textbook case of resolving multiple low candidates.We had three dates: Jan 20th, the yellow horizontal line Feb 5th the blue line , and Feb 17th, the red line. By comparing these to the 68-day nominal average, we can mathematically eliminate Feb 17th (which is 29% too long).
So we still have two possible candidate.To find the 80 day low, first we have to find the 80 day peak, in the Hurst toolbox we have a very reliable tool which is the VTL or Valid Trend Line.According to the Hurst principles, when prices cross below the VTL, this confirm the peak of the longer cycle is formed or in formation.
The last 40day cycle was on January 2, arrow 1, by drawing a VTL(arrow 2) between the November 21st low and the January 2, the 40-day VTL provides the answer.On January 20th, the S&P 500 gapped sharply below this VTL (arrow 3), confirming the 80-day peak was in place. Since a new high of 7,002.28 formed on Jan 28th (arrow 4), the only logical label for the 80-day low is January 20th (arrow 5). We now expect the next low around March 30th (arrow 6). Notably, the Feb 13th cross below the cycle line at 6,832.90 (arrow 7) gives us a downside target of 6,663(arrow 8).
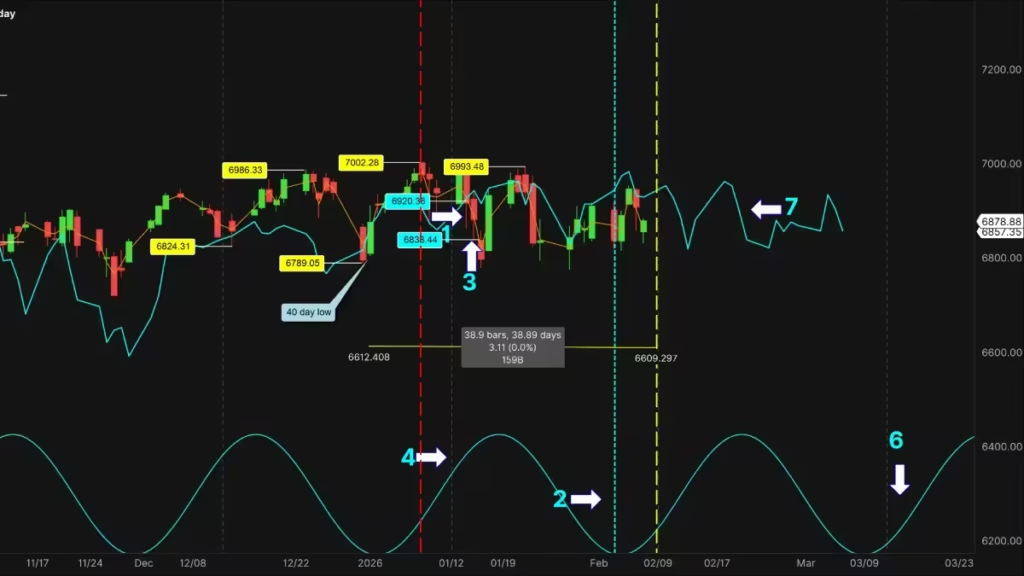
The 40 Day Cycle
During my last update, which was around Arrow 1, I was expecting the 40-day cycle low to form on February 23rd (Arrow 2), as shown on the chart with the blue dashed vertical line. However, it is possible that this 40-day cycle will form a few days later, indicated by the yellow vertical dashed line.
On February 4th (Arrow 3), the S&P 500 crossed below its cycle line at 6,920.36, providing a target of 6,838.44, which was rapidly met. The actual 40-day peak occurred on January 28th with a new all-time high of 7,002.28. This peak formed on the left part of the cycle (Arrow 4) and is represented by the red vertical dashed line, explaining the sideways market action that followed the peak.Marked by Arrow 5, we still have the 7,144.98 40-day target that was triggered at the beginning of December 2025. At the 7,002.28 new all-time high, the S&P 500 was only 142.70 points, or 2%, away from reaching this target.
However, because the S&P 500 crossed below its cycle line on February 4th without reaching that goal, this adds another signal that the S&P 500 market is losing steam and effectively invalidates that potential upside target. The next 40-day cycle low can be expected around the first week of April (Arrow 6). We now have to monitor the 40-day cycle line (Arrow 7); if the market continues trading below it during the next 40-day cycle, it will be a bearish signal for the short term.
Conclusion
To wrap things up, the S&P 500 is currently at a massive crossroads that will define the rest of 2026. While the long-term trend still shows some resilience above the VTL, the evidence from our shorter cycles—specifically the 80-day and 20-week analysis—is sounding the alarm. The sharp gap below the 40-day VTL on January 20th was a textbook signal that the peak is likely behind us. If the S&P 500 fails to bounce and instead breaks firmly below the 40-week FLD at our current levels, the $7,321 target will be officially off the table. In that scenario, we are looking at a sustained bearish trend leading us all the way into the summer months. We must remain disciplined and wait for the market to confirm which path it chooses: a final spike to the target or a long slide into the July/August lows.
Discover more from tradingmarketcycles
Subscribe to get the latest posts sent to your email.