

S&P 500 Peak Alert:
The February 2026 Cycle Roadmap
Introduction
The S&P 500 has pushed into new all-time high territory, but as we enter February 2026, the underlying Hurst cycles suggest we are approaching a major structural pivot.
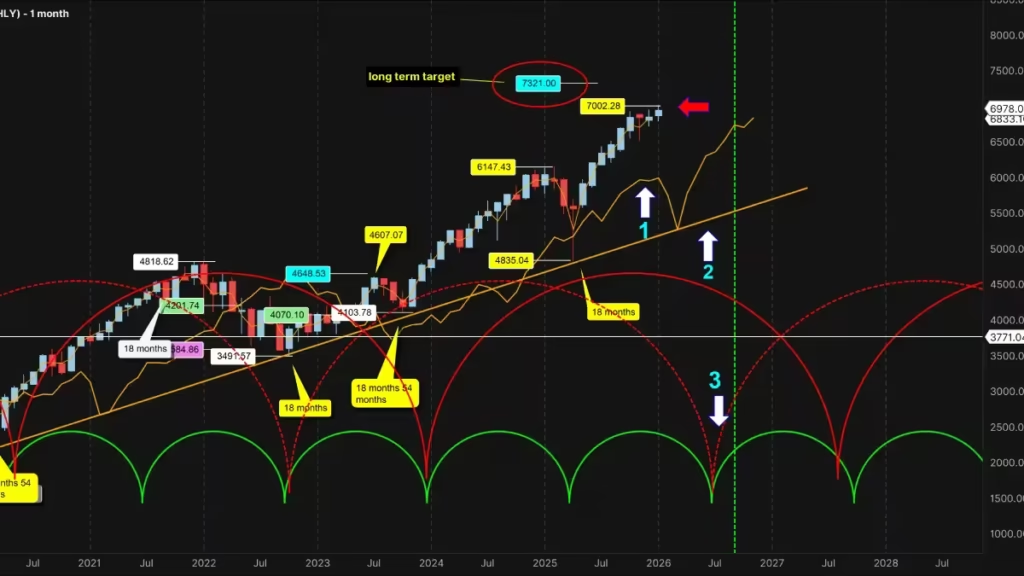
The 18-Month Cycle
Let’s start with the big picture: the 18-month cycle.
With last week’s new all-time high, show on the chart with red arrow, the S&P 500 seems determined to reach that long term 7,321 upside target.
Currently, the market is trading well above its cycle line arrow number 1 and, more importantly, its cycle trend line arrow number 2.
Looking at the long-term data, there is absolutely no sign of weakness yet. However, we must keep our eyes on the 18-month low expected later this year between September and October show by the arrow number 3.
For now, focus on the cycle line and the trend line, arrow 1 and 2.
a decisive cross below these levels will be our confirmation that the 18-month peak is finally in.
For those wanting a deeper dive into the 54-month macro cycles, be sure to check out my previous videos where I break those down in detail.
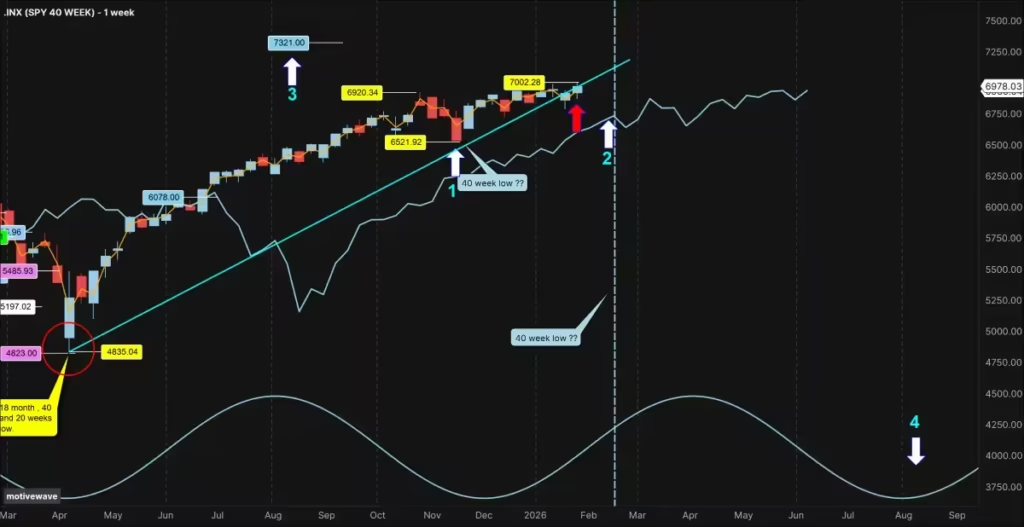
The 40-Week Cycle
Moving into the 40-week cycle, we have two distinct scenarios to navigate.
The first suggests the 40-week low occurred back in November 21st 2025, show with arrow number 1.
The second suggests that low is actually happening right now, in the final week of January the blue vertical dashed line and the arrow number 2.
To stay objective, let’s work with the November 21st, 2025, low as our primary scenario.
Interestingly, despite the new highs, the S&P 500 crossed slightly below the cycle trend line or VTL, during the week of January 20th and has remained there, to draw the VTL, I start from the April 2025 low circled in red, to the November 6521.92 low,
If we see a sharp move lower from here, it would be a major bearish signal, suggesting that the current high is indeed the 18-month peak.
In that case, we would likely miss the 7,321 target show on the cart by the arrow number 3,
leading to a deeper decline toward the cycle line.
Regardless of which scenario wins out, the next major low is synchronized for August to October 2026 (arrow number 4).
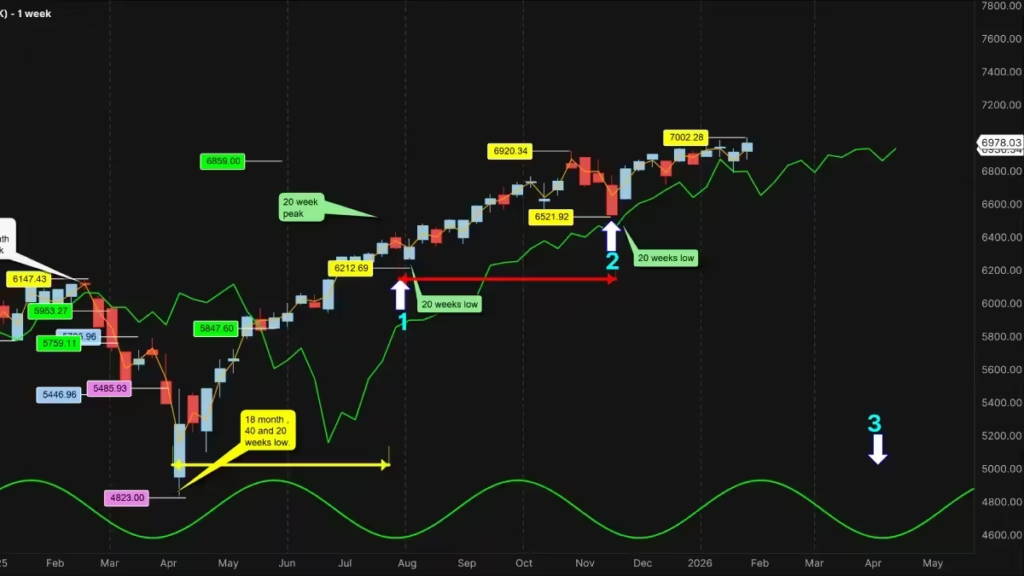
The 20-Week Cycle
Can the 20-week cycle help us clear up the uncertainty?
Following the Hurst Nominal Model, it makes perfect sense to place our first 20-week low in late July 2025 (arrow number 1).
That cycle lasted 16 weeks—roughly 112 days, show on the chart with 5he yellow horizontal line—which is a bit shorter than the 19.4-week average but confirmed by a very prominent bearish candle.
If we project another 16-week cycle forward, using the red horizontal line, it lands us exactly on the week of November 21st, 2025 (arrow number 2).
Thanks to the Principle of Synchronicity, this strongly reinforces the idea that November 21st was our 40-week low.
While having absolute precision on this date isn’t primordial for our immediate trading signals, it gives us much higher confidence in our roadmap.
Always keep the alternative scenario in mind, but the weight of the evidence points to November, but the next 20 week cycle low is expected for March 28th (arrow number 3).
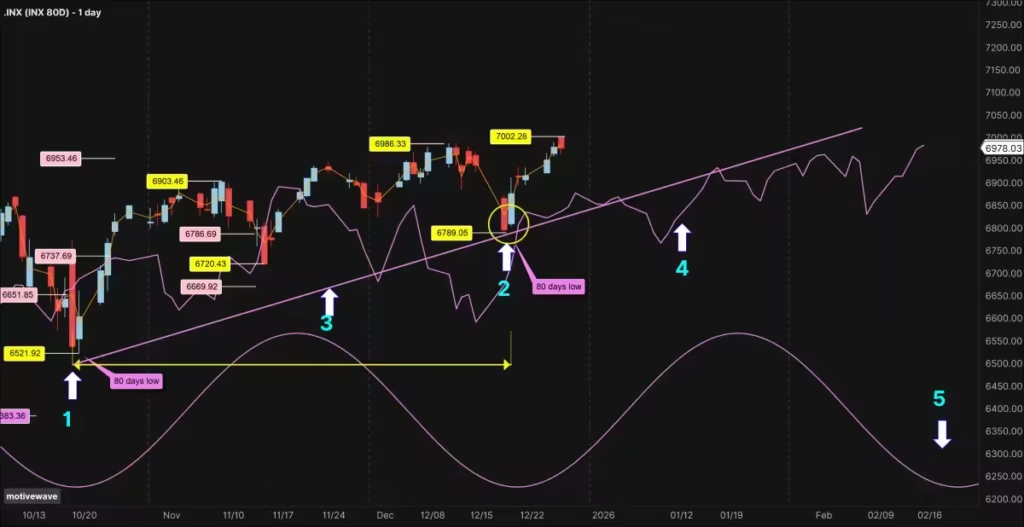
The 80-Day Cycle
Now, let’s look at the 80-day cycle.
Regardless of the larger scenario,
November 21st (arrow 1) was definitely an 80-day low.
Following a 61-day run, show with the yellow horizontal line, our next 80-day trough formed right on schedule on January 20th (arrow 2).
The fact that the S&P 500 found support, exactly on its cycle line (the yellow circle) on January 20, is a classic Hurst signal often seen after major lows. This further validates our November 40-week bottom.
We now have a fresh cycle trend line (the purple uptrend line, arrow 3) to help us identify the next 80-day and 20-week peaks. To draw this 80 day cycle trend line,
I start from the November 2025 low, up to the January 20 Low.
As we head toward the next 80-day low, we’ll be looking for a cross below the cycle line (arrow 4)to provide downside targets, with the best time window for that low falling around March 28th (arrow 5).
The 40-Day Cycle
Since the 80-day low landed on January 20th (arrow1), according to the Hurst principle of synchronicity, that date also marked our 40-day trough.
The next 40-day low is expected around February 23rd (arrow 2) show on the chart with the blue dashed vertical line.
This will be the first real test of how much ‘bullishness’ is actually left in this market.
It is critical to see the market find support and rebound off its cycle line here (arrow 3). Any sharp break below this line would be the first ‘canary in the coal mine’—an early sign of weakness that could signal an early formation of that major 18-month peak.”
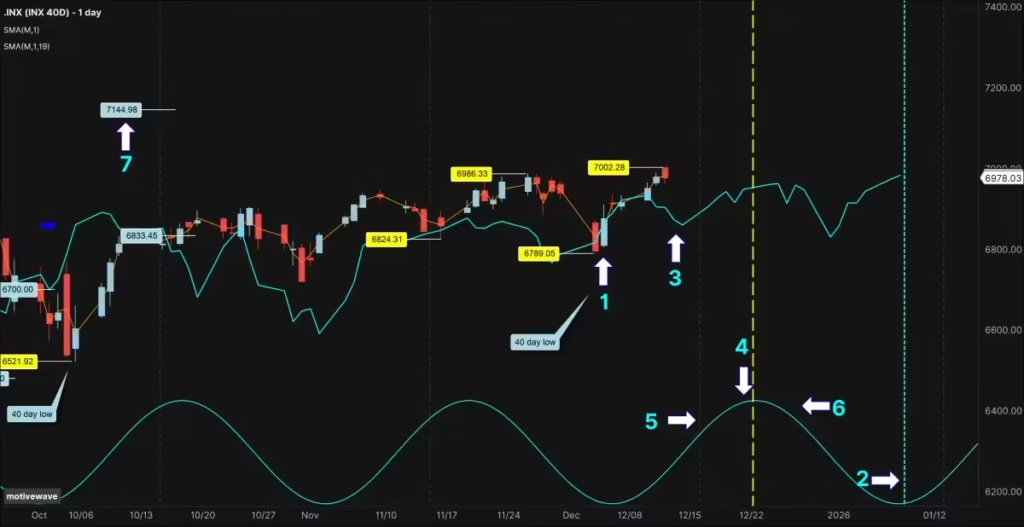
We also need to monitor where the S&P 500 will form its next 40-day peak. Technically, the cycle’s peak is expected right at the top of the cycle—in this case, on February 6, marked by the yellow dashed vertical line (arrow 4). However, Hurst’s peak translation principle applies here.
This principle helps identify the magnitude of the next correction based on where prices peak relative to the cycle’s peak. According to this rule, if prices peak before the cycle’s peak (on the left side) arrow 5, this is a bearish sign, and we can expect a sharp correction. Conversely, if prices peak after the cycle’s peak (arrow 6), we can expect a moderate correction. The size of the correction is proportional to the size of the cycle.
If, during the next 40-day peak formation, prices peak before February 6 and cross below the cycle line, this will be the first sign of weakness.
Marked by the arrow 7, we still have the 7144.98, 40 day target triggered at the beginning of December 2025,
With last week 7002.28 new all-time high, the S&P 500 is 142.70 points or 2% away from his target.
If the S&P 500 cross sharply below his cycle line without reaching his target, this add another signal of the S&P 500 market losing steam.
The 20-Day Cycle
Let’s conclude this week’s update with the 20-day cycle analysis.
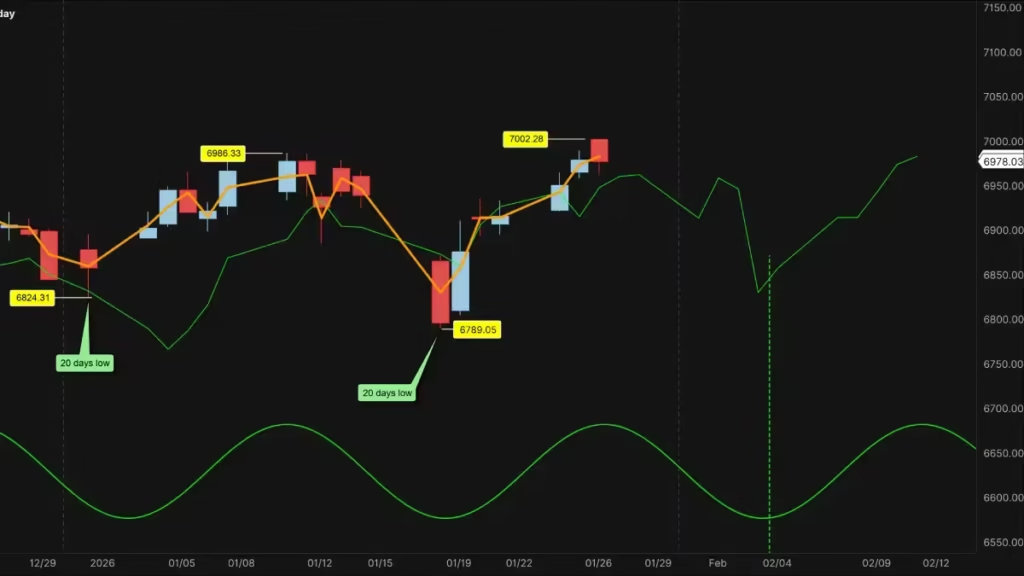
On January 20th, the S&P 500 formed its most recent 20-day cycle low. The next cycle low is projected for February 6th, indicated on the chart by the vertical green dashed line. It is crucial for the future trend that the S&P 500 remains above or forms its next low at this cycle line.
For the first 20-day cycle since the January 20th low—which, according to J.M. Hurst’s rule of synchronicity, also marked the 80-day cycle low—the behavior is particularly significant. In a bullish market, the first 20-day cycle should find support at its cycle line and then rebound toward its next 20-day cycle peak, which will coincide with the 40-day cycle peak.
Subsequently, as the S&P 500 moves toward forming its first 40-day cycle low since the last 80-day low on January 20th, it should cross below the 20-day cycle line. This will provide a downside target for the February 23rd low. The S&P 500 will then cross back above the 20-day cycle line, establishing a new upside target for the 80-day cycle peak.
Following the 80-day peak formation, the S&P 500 will cross below its cycle line for the final time in this cycle, providing a downside target for the 80-day low. However, before reaching the 80-day low on March 29th, the market should form an initial low shortly after crossing below the cycle line. It will then rebound toward the cycle line, using it as resistance, before resuming its decline through March 29th to complete the 80-day cycle low.
Conclusion
while the price action is hitting new highs, our cycle analysis is reaching a point of high tension. The next few weeks will tell us if the 7,321 target is a reality or if the 18-month peak is already behind us.
Discover more from tradingmarketcycles
Subscribe to get the latest posts sent to your email.