

“Complete S&P 500 Cycle Analysis Using Hurst Model: Long-Term Predictions through 2036”
Introduction:
Despite a robust 38% rally from April 2025’s major low, the S&P 500 remains below its key targets of 6,859 (20 week) and 7,321 (40 week). This performance signals the need to examine broader market dynamics through the lens of yearly cycles.
This analysis explores very long-term cycles using J.M. Hurst’s nominal model, which identifies recurring market patterns across timeframes from minutes to multiple years. Hurst’s methodology recognizes that cycle lengths are averages with natural variation, where bull markets typically shorten cycles while bear markets extend them. Understanding these patterns becomes crucial for anticipating future market turning points and major corrections.
The Nominal Model
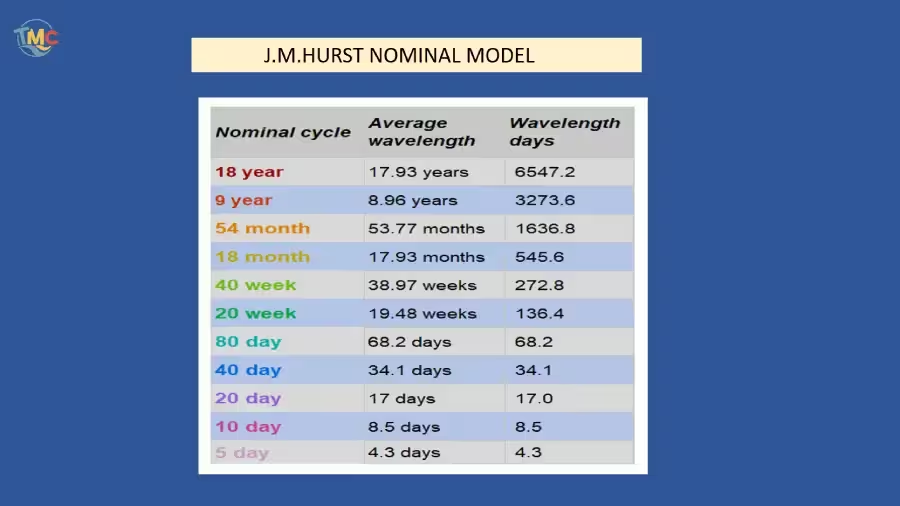
Let’s start with the Hurst nominal model,
J.M. Hurst created this model after discovering,
that stock markets repeat similar patterns regularly.
This model works for cycles ranging from minutes to multiple years.
Very important point: cycle lengths are averages.
Hurst has a “rule of variation” – sometimes an 18-year cycle can last 20 years, another might last 16 years.
What matters most is staying close to the Hurst nominal model average.
Also, in bull markets cycles usually run slightly shorter, and in bear markets they tend to extend longer.
The S&P 500 Cycle Analysis from 1932 to 1950 the Period:
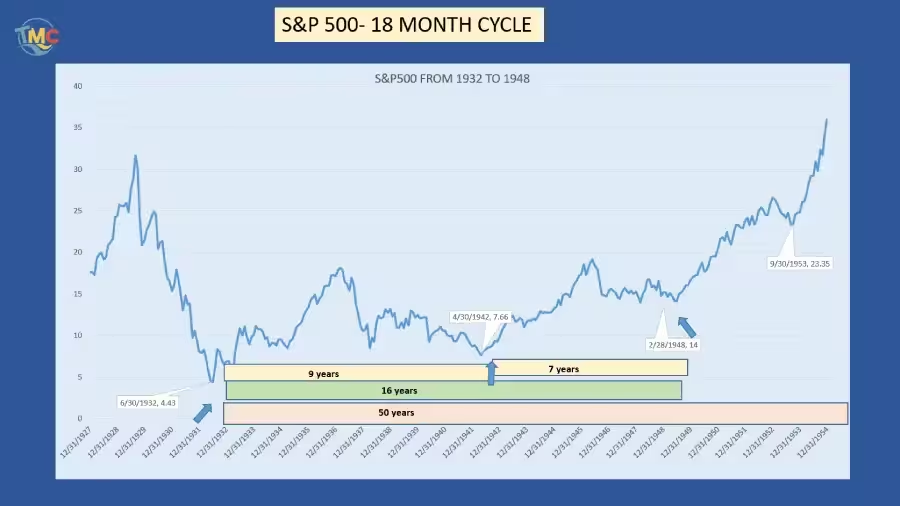
We’ll start our very long-term analysis, by going back to the main 20th century low in 1932, using closing prices chart for the S&P 500 index until 2020, where I switch to bar charts.
From the 1932 low point, we’ll use the 18-year cycle.
• Adding 18 years to the 1932 low gives us 1950 as a potential target for the next 18-year cycle.
Let’s see what happened by 1950.
During this first 18-year period, we had two 9-year cycles: the first forming a low in 1942 at 7.66, and the second in 1948 at 14.
1948 was the first 18 year cycle.
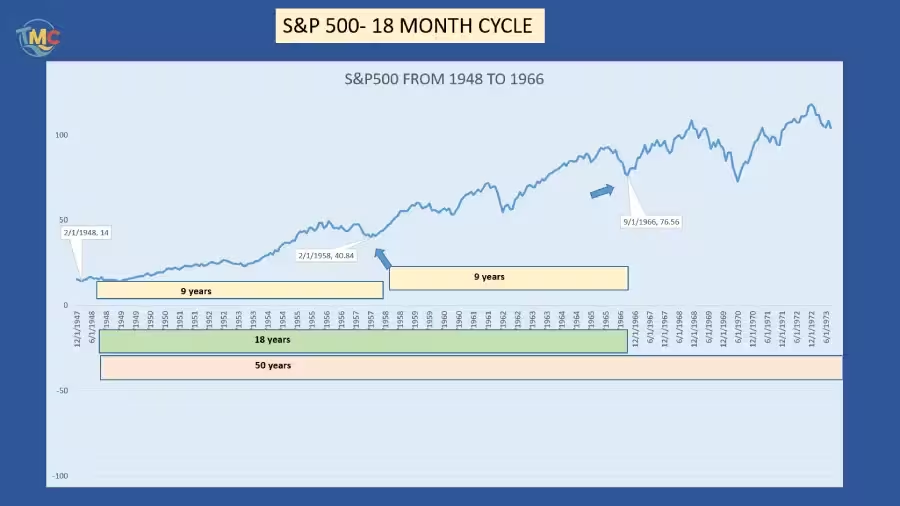
The 1948 to the 1966 Period:
• The second 18-year cycle formed a low around 1966. The first 9-year cycle hit 40.84 in 1958, and the second reached 76.56 in 1966.
This cycle was exactly 18 years long
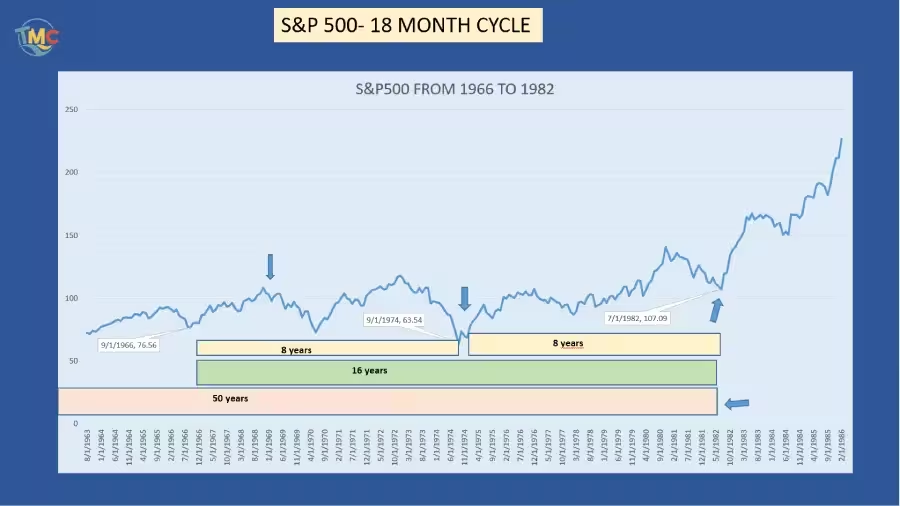
The S&P 500 Cycle Analysis from 1966 to the 1982 Period:
• The third 18-year cycle was expected in 1984. The first 9-year cycle should occur in 1974, and the second in 1983.
In 1974, the S&P 500 index formed a major low at 63.54. The second 9-year cycle had a major low in 1982 at 107.09. 1982 marked the beginning of the 1980s great bull market.
According to Hurst’s rule of synchronicity, this third 18-year cycle is also the 54-year cycle (see the nominal model). This 54-year cycle lasted 50 years, only 4 years shorter than the nominal model – just 8% shorter over 50 years, showing very good performance. We can confidently label 1982 as the 54-year cycle low.
This coincides with the sideways market from the 1960s. The correction from the previous bull market lasted 14 years. This first 54-year cycle ran from 1932 to 1982.
• Adding 54 years to the 1982 low gives us 2036. If this 54-year cycle follows Hurst’s nominal model, around 2036 (plus or minus a few years), we can expect the S&P 500 to form a major low around 2036, after a possible sharp decline.
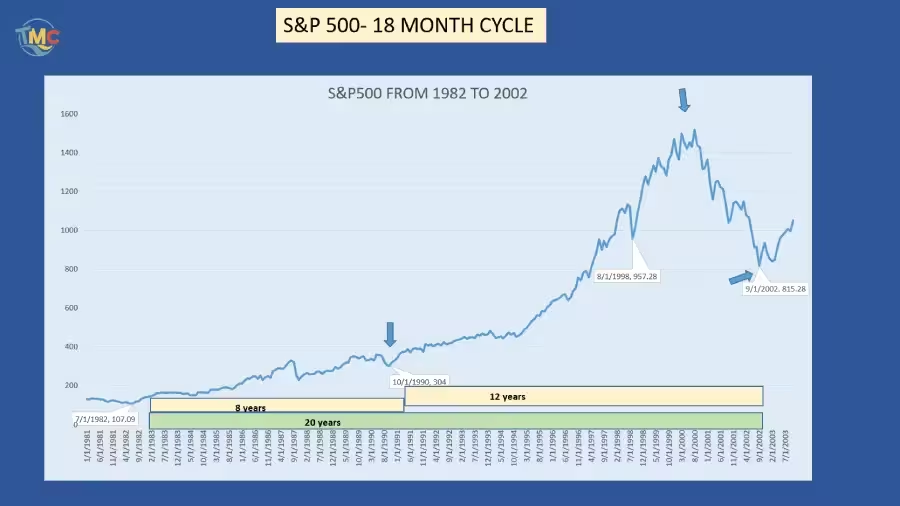
The 1982 to the 2002 Period:
• Let’s look at the next S&P 500 Cycle Analysis, 18-year cycle: 1982 + 18 years = 2000.
2000 was the dot-com bubble. The bubble peaked in March 2000 before a dramatic 34% crash, forming its low in October 2002.
From August 1982 to October 2002 is 20 years. To simplify calculations, I rounded to 20 years, though this 18-year cycle actually lasted exactly 17 years and 2 months.
Inside this 18-year cycle
the first 9-year cycle should form around 1991 and the second in 2000.
The first lasted 8 years, forming a low at 304 in 1990, and the second in October 2002, lasting 12 years.
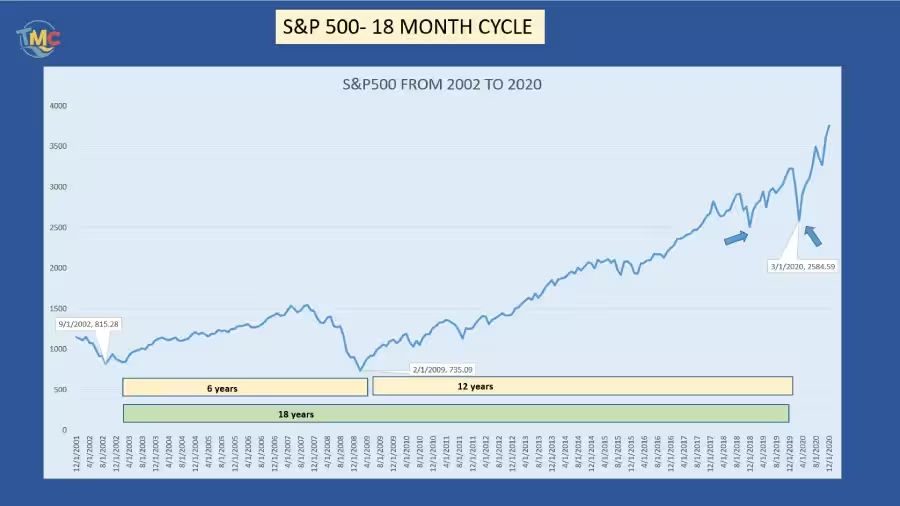
The 2002 to the 2020 Period.
- Projecting the next 18-year cycle from the October 2002 low gives us 2020,
the year of the big correction blamed on COVID.
In fact, we were already expecting an 18-year cycle low to form, COVID may have simply amplified the decline.This shows the power of cycles, no matter what happens, cycles never disappear. Depending on the cycle length we expect, corrections will be more or less significant.
Some analysts place this 18-year cycle in 2018, but I think that’s unlikely.
However, for analysis purposes, let’s keep this as a second scenario.
The 2020 to the 2038 Period.
• Projecting the next 18-year cycle from the 2020 low, gives us 2038 as the next time target, 2 years later than the 54-year projection of 2036.
Now let’s explore shorter-term cycles from the 2020 low.
The next short-term cycle in Hurst’s nominal model is 54 months, or 4.5 years.
The 2020 to the 2023 Period.
- Adding 54 months to the 2020 low, gives us between 2024 and 2025.
In April 2025, the S&P 500 made an important low right on the 18-month cycle trend line or VTL, the yellow trend line.From the March 2020 low to the April 2025 low is exactly 61 months,
7 months longer than the 53.77 Hurst nominal model.To identify the actual 54-month cycle low, we need to examine the next lower cycle, the 18-month cycle.
One 54-month cycle contains three 18-month cycles.
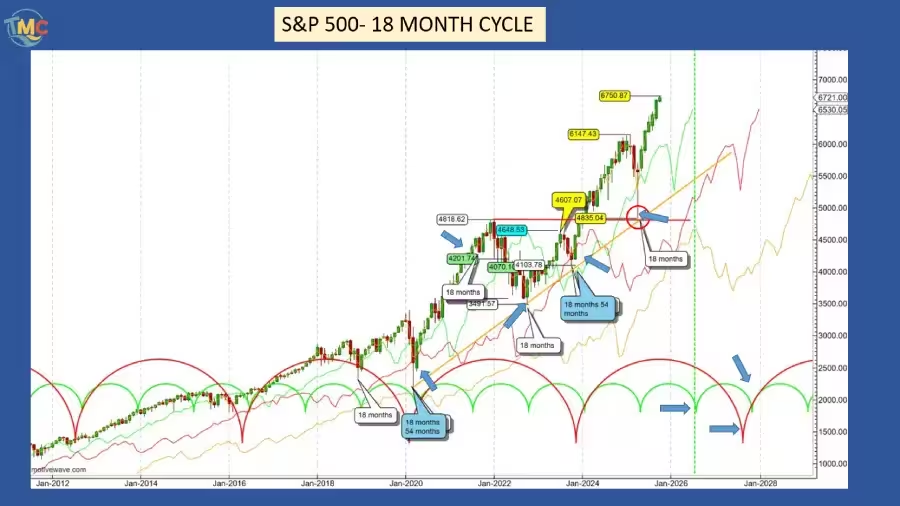
The first scenario for the S&P 500 Cycle Analysis.
With the 18-month cycle starting in March 2020,
• The S&P 500 had a very bullish first 18-month cycle, ending in September 2021, exactly 18 months long.
• The second 18-month cycle lasted 13 months, ending in October 2022.
• The third was even shorter, 11 months to October 2023.
Since the market was forming a long-term cycle bottom, this explains the huge rally following this correction.
With high degree of confidence, we can label October 2023 as the 54-month cycle low, not April 2025.
This 54-month cycle lasted 42 months, and the 18-month cycles within it averaged 14 months, which is common in bull markets with shorter lengths.
The 2023 to the 2028 Period.
Adding 54 months to the October 2023 low gives a time target of 2027-2028.
• The first 18-month cycle following the October 2023 low, formed a low in April 2025, (the green semi-circle), finding support on its VTL (the yellow trendline) and lasting exactly 18 months.
- We can expect the next one to form in October 2026, and the third in April 2028.
The October 2026 and 2028 lows are calculated using the 18-month average from Hurst’s nominal model.
Of course, these dates will be updated according to the actual lengths of the two 18-month cycles.This will also complete the second 54-month cycle since the 2023 low.
By Hurst’s synchronicity rule, this will also mark the end of the 9-year cycle.
Around that date, we may expect an important correction.
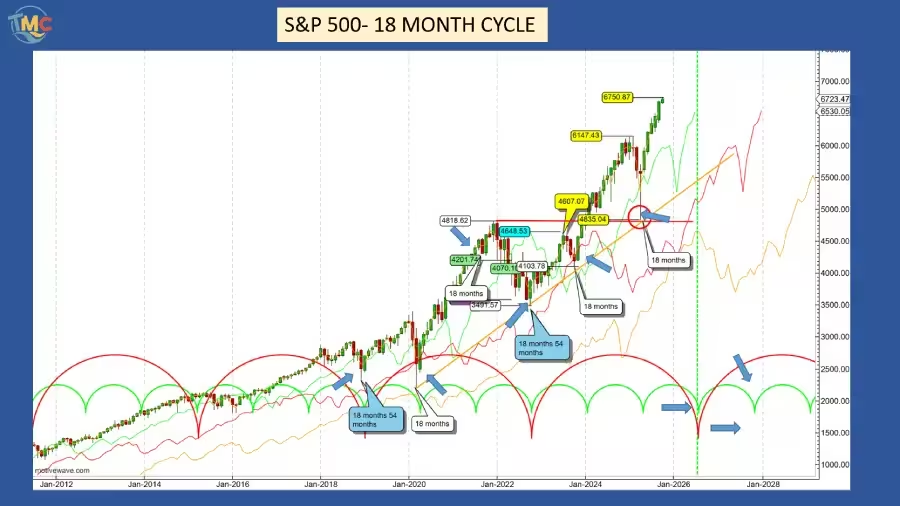
The Second Scenario:
Let’s examine the same analysis starting from the 2018 market low.
The 2018 to the 2022 Period
The market cycle from December 2018 to March 2020 lasted 15 months, which was 3 months shorter than the standard Hurst model prediction.
When we add 18 months to the March 2020 date, we get September 2021.
This cycle period was extremely bullish (rising strongly).
Typically, the second 18-month period within a 54-month cycle should be bullish to neutral, but this one was so strongly bullish that it became difficult to identify the actual low point.
This type of extreme bullishness usually occurs after a major market bottom, which is the first reason why this scenario is not my preferred interpretation.
The third and final 18-month cycle, from September 2021 to October 2022, was bearish (declining), which is expected behavior for a third 18-month cycle.
This cycle actually lasted 15 months.
The complete 54-month cycle had a length of 48 months, while the 18-month cycles averaged 16 months. In terms of duration, everything appears normal so far.
The main problem is that since the cycle low fell below the starting point, the first 18-month period became bearish. This might be due to COVID-19, which amplified the market decline.
The only factor supporting this scenario is that when we examine closing prices, the 2020 low at 2,584.59 sits slightly above the 2018 low at 2,506.85.
In this case, the entire 54-month cycle makes sense. The first period was neutral due to COVID (finishing slightly above where it started after a major decline), the second was very bullish, and the third was bearish, forming a low in October 2022.
Let’s label the 2022 low as the 54-month cycle bottom.
The 2022 to the 2027 Period
Adding the next 54-month cycle to the October 2022 low gives us 2027 as the potential date for the next 54-month low.
The first 18-month cycle of this new 54-month cycle lasted only 12 months. While very short, this isn’t impossible, this 18-month cycle formed its low in October 2023.
Adding 18 months to October 2023 gives us April 2025 as the next target date.
The S&P 500 index formed a low in April 2025 and found support on its VTL (the yellow uptrend line), which indicates a very bullish market.
Since the last 54-month cycle low, both 18-month cycles have been very bullish, technically, the third cycle should be bearish.
Adding 18 months to the April 2025 low gives us October 2026 for the next 54-month cycle low, which would also be the 9-year low.
This is the second reason why this scenario seems very unlikely.
If this analysis is correct, we should expect a very bearish third 18-month cycle. However, since the market has rallied 38% from the April 2025 low, there are no bearish signs yet.
To validate this scenario, the S&P 500 would need to start a sharp decline very soon.
During the next low formation, it should cross sharply below its yellow uptrend line (VTL).
We must watch carefully during the next correction to see how the market reacts when approaching its different cycle lines and VTL.
Quick Summary:
Scenario 1: The next 54-month and 9-year cycle should form in early 2028.
Scenario 2: The 54-month cycle and 9-year cycle are expected for October 2026.
Conclusion:
Two scenarios emerge from this cycle analysis. The first suggests major market lows in early 2028, while the second points to October 2026. The second scenario appears less likely due to the market’s strong 38% rally without bearish signals, requiring immediate sharp declines to validate the pattern.
Discover more from tradingmarketcycles
Subscribe to get the latest posts sent to your email.