

“GOLD $3,744 NEW HIGH! What’s Next?”
“The Gold Market Analysis September 2025: Record High Signals and Cycle Predictions”
Introduction
The Gold market has been on an incredible journey over the past two months, breaking records and surprising investors. After my last market analysis in July, we’ve seen dramatic price movements that have changed the landscape completely. Understanding what’s happening with gold cycles can help you make better investment decisions. Let’s break down the complex market patterns into simple terms so you can see what might happen next.
It’s been just over 2 months since I last analyzed the gold market on July 17, 2025.
Back then, gold was stuck trading in a triangle pattern between support and resistance levels. I predicted a major price drop in September, but also mentioned gold might hit new record highs first. Let’s see what we can expect in the coming months.
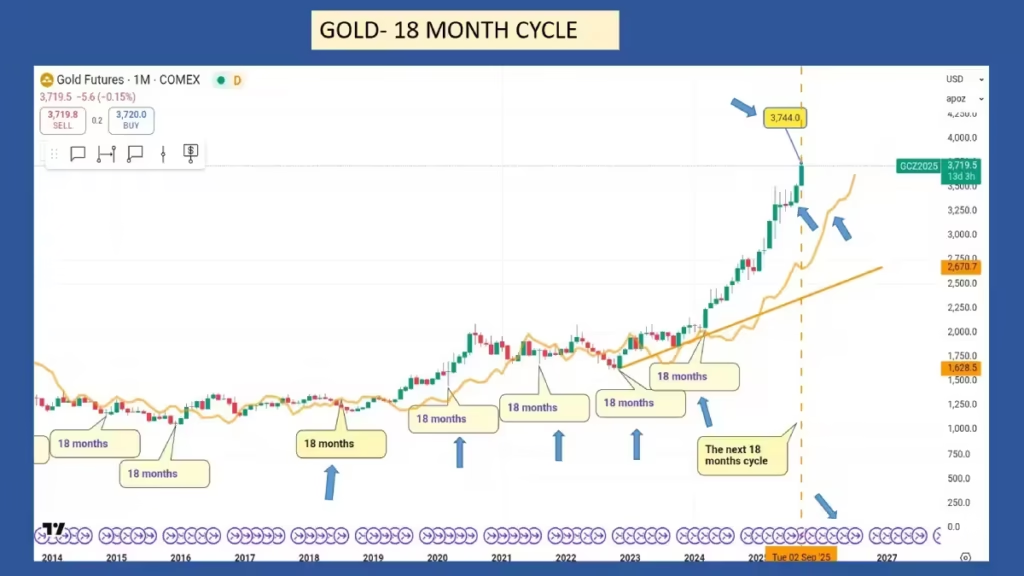
Let’s examine the 18-month cycle first.
As I mentioned before, as long as gold stays above its cycle line (the yellow line), the upward momentum continues strong.
We expect this 18-month cycle to bottom out this month. Since my last update, gold has surged dramatically, reaching a new record high of $3,744 on September 16. The big question is: was this the peak of the current cycle, or the start of a new one? Short-term cycle analysis will give us the answer.
In the main scenario, the 18-month cycle should complete by month’s end. If correct, we should see a sharp price drop back to at least the trend line. The alternative is that this cycle actually finished in August, a month earlier than expected. Given the explosive rally since August’s low, there’s a strong chance the cycle bottomed in August. The short-term patterns will confirm this.
Looking back to July 2018, we’ve had four 18-month cycles totaling 67 months, averaging 16.75 months each. The standard model suggests 17.93 months on average. If August was indeed the cycle low, the next upward trend should last until March 2026, with the following low expected in January 2027.
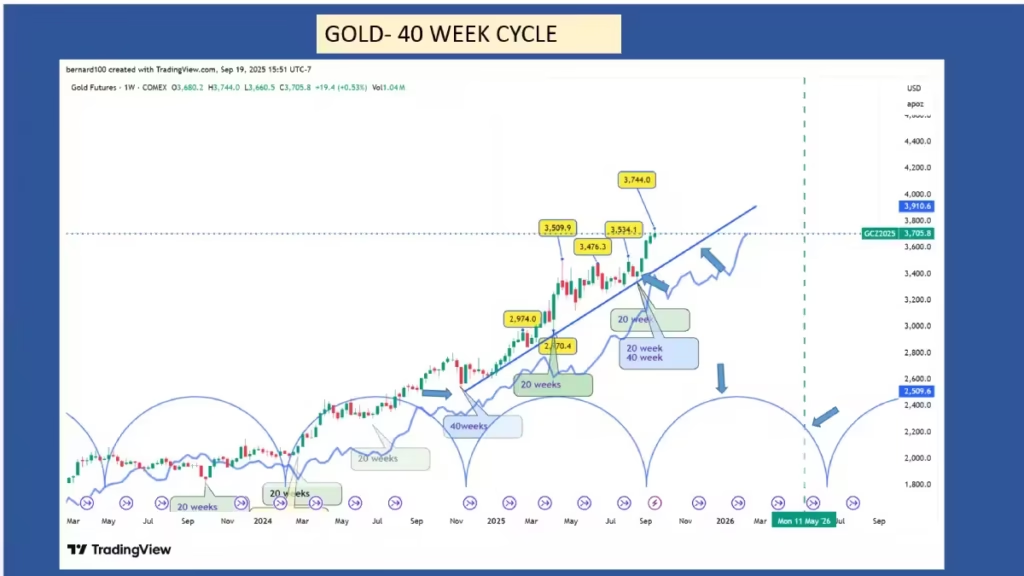
Now let’s examine the 40-week cycle.
Since the last low in November 2024, exactly 40 weeks have passed. The standard model shows an average of 38.97 weeks. This timing helps identify the 18-month cycle, since each 18-month cycle contains two 40-week cycles. This strongly suggests August was the 18-month low.
If August marked the 40-week low, the next peak should form in December 2025, followed by a low in May 2026 (marked by the blue dashed line). If this scenario plays out, the next 40-week low should find support at its trend line. Any sharp break below this line would signal trouble for gold.
In my last update, I mentioned a significant rally would follow once the 40-week low was established. I also said gold should drop below its trend line first. Actually, if August was the low, it stayed above the trend line – what does this mean? This confirms strong bullish sentiment in the gold market, explaining the 11% rally after August’s low.
Assuming August was the 40-week low, I’ve drawn the trend line. When gold breaks below it, this will confirm the previous high was at least an 18-month cycle peak, so we must watch this line closely.
The alternative scenario has both the 40-week and 18-month cycles still coming. This would mean a very sharp decline in the next few weeks. Since all cycles would be running long, this could be negative for gold. In bull markets, cycles tend to be shorter; in bear markets, they extend.
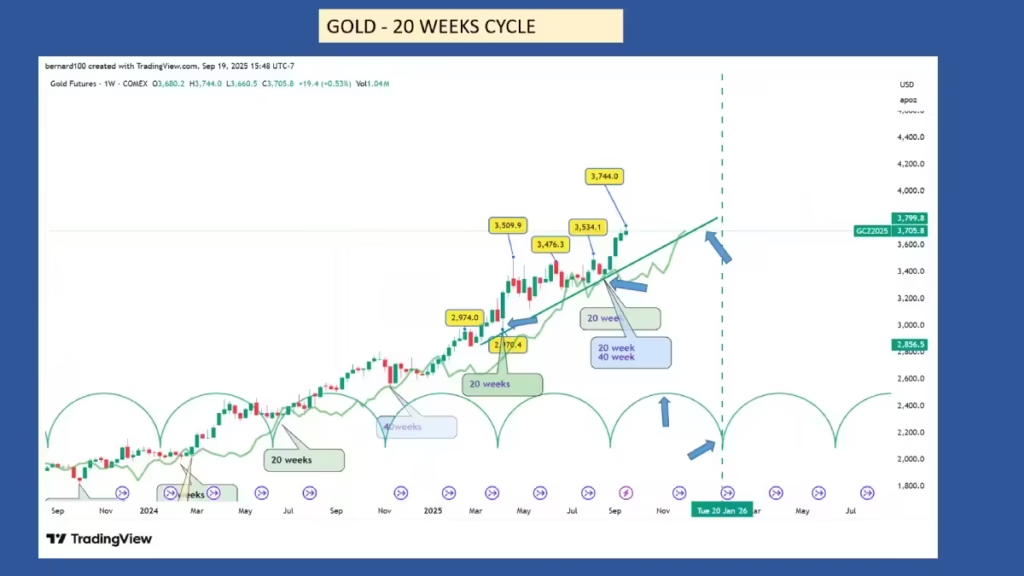
The 20-week cycle:
Everything points to August being the 20-week cycle low. Since the last low on April 6, 2025, 19 weeks have passed. The standard model shows 19.48 weeks on average. The strong rally confirms an important low occurred. We can confidently label August as the 20-week low.
During my last update, I expected this low around late August. The $3,353 low on August 20 was perfectly timed. The 20-week peak should occur around the third week of October, with the next low in mid-January 2026 (green dashed line). During the next low formation, gold should find support at its trend line. It’s too early to know exactly where this line will be.
It’s crucial to watch where the next 20-week peak occurs compared to the cycle peak, and how the market behaves at the trend line during low formation. Any sharp break below signals weakness. The green trend line marks the 20-week cycle boundary – any break below confirms the 40-week peak has formed.
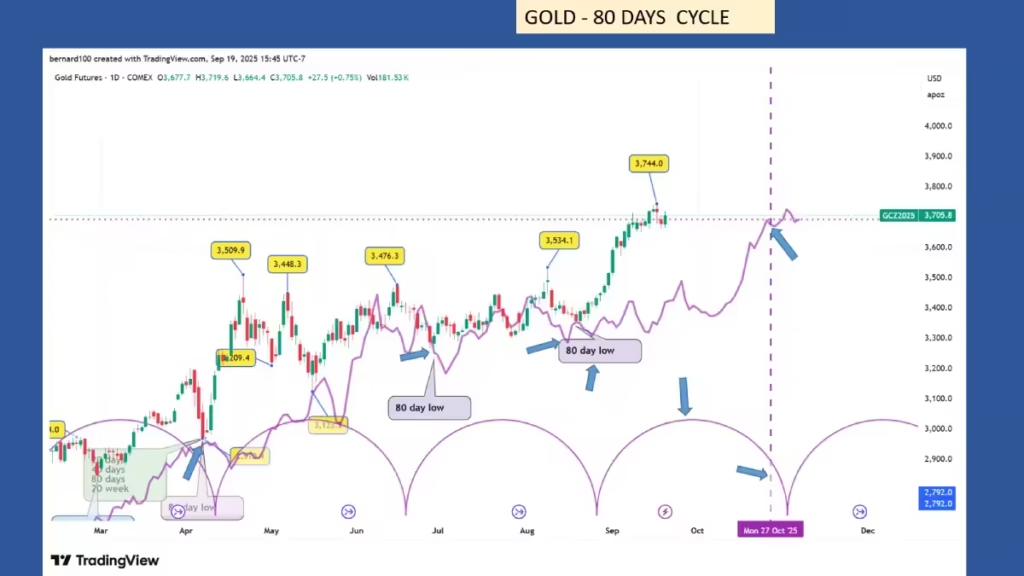
The 80-day cycle
If our analysis is correct, placing the 20-week, 40-week, and 18-month lows in August aligns with principle of synchronicity that suggest August was also the 80-day low.
From April’s low to June 30’s low, the first 80-day cycle lasted 81 days (13 days longer than the 68-day average). The last cycle from June 30 to August 20 was 51 days (17 days shorter). While 51 days seems short for an 80-day cycle, it’s common to have one longer and one shorter cycle. The average matters most.
Adding both cycles gives 131 days. Dividing by two equals 65.5 days, only 2.5 days shorter than average. We can confidently conclude August was the 20-week low. While the 80-day cycle could run longer, it’s very unlikely.
The next 80-day low is expected October 27 (purple dashed line), with a peak around September 23. During low formation, gold should find support around $3,670. The correction size depends on where the peak forms compared to September 23. If September 16 was the peak, expect a sharp correction. If it peaks after September 23, expect a mild correction. A sharp break below the trend line during the next low would signal weakness. This year, with one positive trading signal, the 80-day cycle has a 100% success rate.
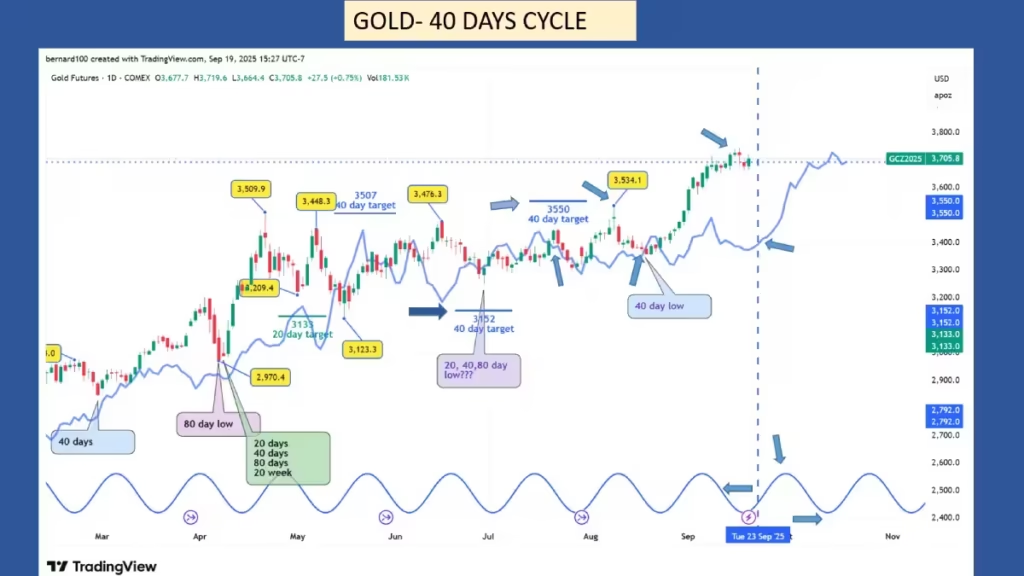
The 40-day cycle
In my last update, I expected the 40-day low on August 11. August 20 was when gold actually bottomed. My downside target was $3,152; gold missed this by $100, which is very bullish. On July 22, gold broke back above its trend line at $3,400 with strong momentum, providing a new high target of $3,550.
On August 8, 16 days later, gold hit $3,534, meeting the target for a $134 (4%) profit, then declined to form its low right at the trend line on August 20 – another bullish sign. Typically, 40-day lows form below the trend line.
Since forming this low, gold has continued rising, hitting a new record of $3,744 on September 17. This should be the current 40-day cycle peak. Since the peak occurred in the right part of the cycle, expect a moderate correction. After a major low, the first correction should find support at the trend line.
This low should form September 23, with the trend line around $3,410. Strong bullish sentiment suggests gold might stay above its trend line. If the current 40-day cycle completes on time September 23, the next one should peak October 10 and bottom October 27. During the next correction, gold should break below its trend line, providing a downside target near the 80-day trend line, which should also mark the 80-day low.
Short Term Trading Corner
Since this part of the update has been very popular, today we will go deeper into the analysis. We will see how to trade a full cycle, using the 20-day chart with the 20-day FLD.
Since the beginning of the year up to today, we have 10 trading signals: 8 positive and 2 negative, giving a very high 80% success rate.
In the last update, we had the July 11 trading signal with an upside target of 3429.50, representing $89 potential profit.
On July 22, the gold market formed a 3447.50 high, meeting the target.
On August 19, the gold market crossed below its cycle line at 3379, providing a downside target at 3224 for a potential $155 or 4.58% profit.
Even though during a bull run like the one we are witnessing, it is not recommended to take short positions, it is very tempting to take the trade.
Let’s pretend that for any personal reason, a trader wants to take a position on the downside.
We first need to establish which longer cycle this 20-day cycle is part of.
The last major cycle low was the 80-day cycle on June 30.
The $3224 target is the fourth 20-day cycle since June 30.
Due to the rule of synchronicity, we know this 80-day cycle will also be an important low on the longer timeframe all the way up to the 18-month cycle.
It makes sense to try to trade this last 20-day cycle.
Let’s see how we can deal with this situation.
If we enter the trade at the opening of the next trading session, we short the market at $3359.
The potential profit is $135.
Knowing the rule of synchronicity, the next time the gold market crosses above its 10-day cycle line (FLD), we place the stop above the 10-day FLD, the black line.
As soon as the median price crosses above the 10-day FLD, the trader will exit his position.
On August 20, the 10-day FLD is at $3400; on Aug 21 at $3408; on Aug 22 at $3400; on Aug 23 at $3386.
On Aug 25, the median price crosses above its cycle line, so the trader should exit on the next bar at the opening price of $3410.
The trader has a $51 loss. Instead of putting the stop at $3534 for the traditional stop, if using the traditional stop, the trader would have to exit on Sept 2 for a loss of $175.
Using Hurst cycle trading is very powerful.
For the trader who uses the 20-day FLD as a stop, he will exit on August 28 at $3452 for a loss of $93, still 50% less than the traditional stop loss.
This technique can be used with any cycle length.
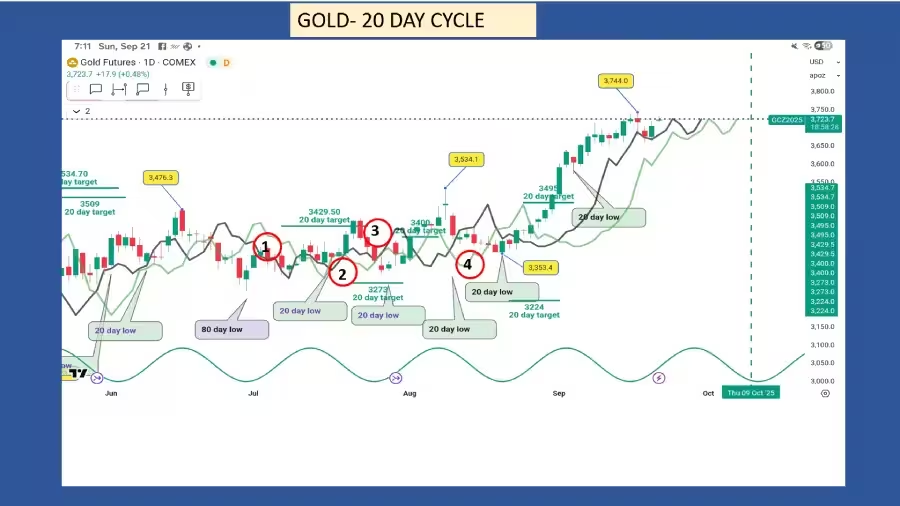
Now let’s take the last 80-day cycle and apply the same technique.
To trade the last 80-day cycle from June 30, 2025, we will use the 20-day FLD.
Before we start, I would like to specify that the entire period is within a triangle trading range; in other words, it’s a sideways market. Technically, with regular technical analysis, it is very complicated to trade, but trading with cycles is easier.
- The first signal was on July 11; the 3340 crossing gave a 3429.50 upside target.
On July 22, 11 days later, the gold market reached a 3447.50 high, meeting its target.
Exit the next day at the opening price of 3376.50 for a $53 profit.
- The second trading signal was on the downside on July 28, when the gold market crossed below $3360 for a $3273 downside target.
The stop will be placed above the 20-day cycle line because it is the closer one to the price.
We will exit the position on August 1 at $3370 for a $10 loss.
- The third signal was on the same day, August 1, for a $3400 target. On August 7, the gold market made a $3483 high. This high was reached 10 days after the market formed its 40-day cycle; 10 days is the peak of the cycle, time to exit with $113 profit.
- The fourth one was the one mentioned above.
Result of this 80-day cycle: $64 profit, but if the trader didn’t enter downside trading signals, as recommended, the trader would have $166 profit.
We have to remember the market was trading sideways. In trending markets, the profits will be much more significant. The amount of profit also depends on whether the trader trades gold futures or the options market and how many contracts.
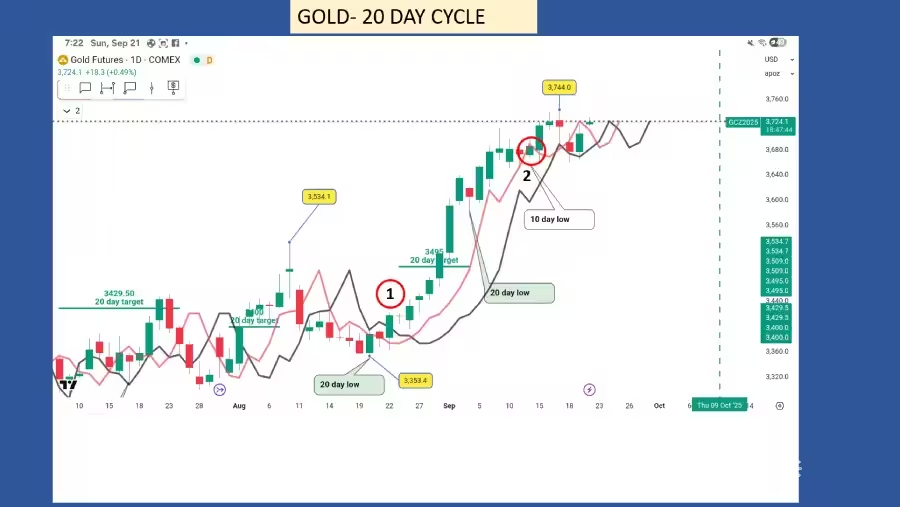
Let’s now start to trade the actual 80-day cycle. This cycle starts on August 20.
- We have the first signal on August 27 when the gold market crosses above its cycle line at $3429 for an upside target at $3495 or $66 potential profit.
The stop loss will be below its 10-day cycle line, the black line.
Since the August low is certainly the 18-month cycle low, we can expect the gold market will exceed the target. The next 20-day low is expected on September 7 and technically should find support on its cycle line. The 20-day cycle occurred on September 4, 3 days early, and well above its cycle line (the green line), and also well above its 10-day cycle line (the black line), meaning there is a lot of bullishness in the gold market, so we keep the position. To protect the potential profit and since the prices are far away from both cycle lines, we will use the 5-day cycle line for the stop loss, the red line.
- On September 12, at the time of the 10-day cycle low formation, the gold market crossed below the 5-day cycle line (the red line). This is the sell signal; exit the position the next trading day, September 15, at the opening price of $3680 for a $251 profit.
The first trading signal for this 80-day cycle is positive. What’s next? At the time of the 40-day cycle formation, technically the market should cross below its 20-day cycle line (the green line), but since the market is very bullish, there is the possibility the market will only find support on it and not cross below.
What will be the next trade?
Technically, after forming its 40-day cycle low below its cycle line, the market should cross back above its cycle line, triggering an upside target.
What if the market forms its 40-day low on or above its cycle line? How can we enter the next trading opportunity?
We can enter the next trade when the market crosses above the 10-day cycle line and use the 5-day cycle line as stop loss. This will be the last upside trading signal before the 80-day cycle peak. If during the 40-day low the market crosses below its 20-day cycle line, we will wait until it crosses back above its cycle line and use the 10-day cycle line as stop loss.
All this analysis is not trading advice; it is just to show the different trading opportunities using the Hurst cycle principles. As a reminder, all past performance will not necessarily reflect future performance.
Conclusion:
Gold’s recent performance shows incredible strength, with multiple cycles potentially aligning in August to create a major buying opportunity. The key levels to watch are the various trend lines, as breaks below them will signal important changes in market direction. While short-term corrections are expected, the overall bullish momentum suggests higher prices ahead through early 2026. Smart investors should monitor these cycle patterns closely to time their entries and exits effectively.
Discover more from tradingmarketcycles
Subscribe to get the latest posts sent to your email.