

S&P 500 Index Cycles Analysis – Trading Targets & Technical Forecasts. Aug 11 2025
Introduction
In my previous analysis, I discussed how the 7,321 price target remains technically valid, primarily because the S&P 500 index continues to trade above its critical 40-week cycle line.
Today, I will provide you with a detailed examination of what has transpired since my last comprehensive update and present my analytical expectations for the upcoming trading weeks.
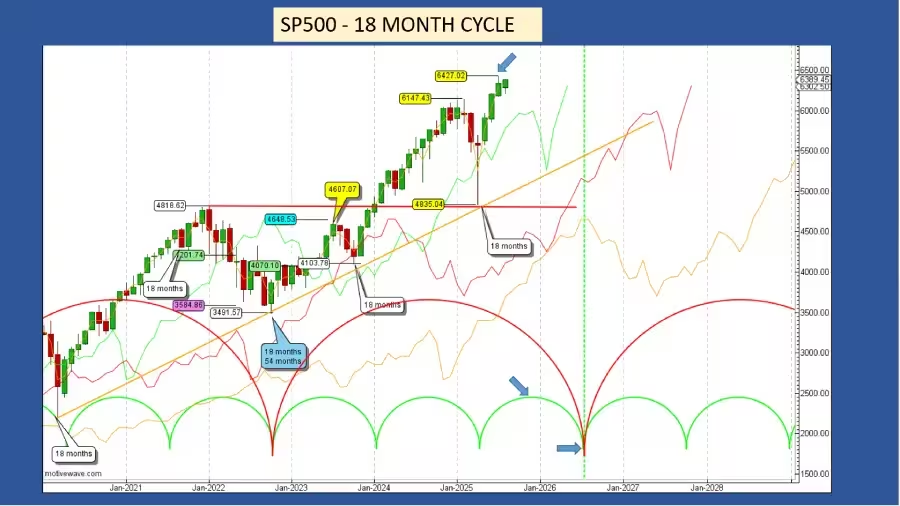
Let’s begin our analysis with the 18-month cycle framework.
The singular notable development since my previous S&P 500 index assessment is that the index achieved a new all-time high during the final trading session of July.
I continue to anticipate that the peak formation for this current 18-month cycle will materialize around January 2026, with the corresponding cyclical low scheduled to emerge between September and October 2026.
For comprehensive details regarding the 18-month cycle analysis, I recommend to read my previous article.
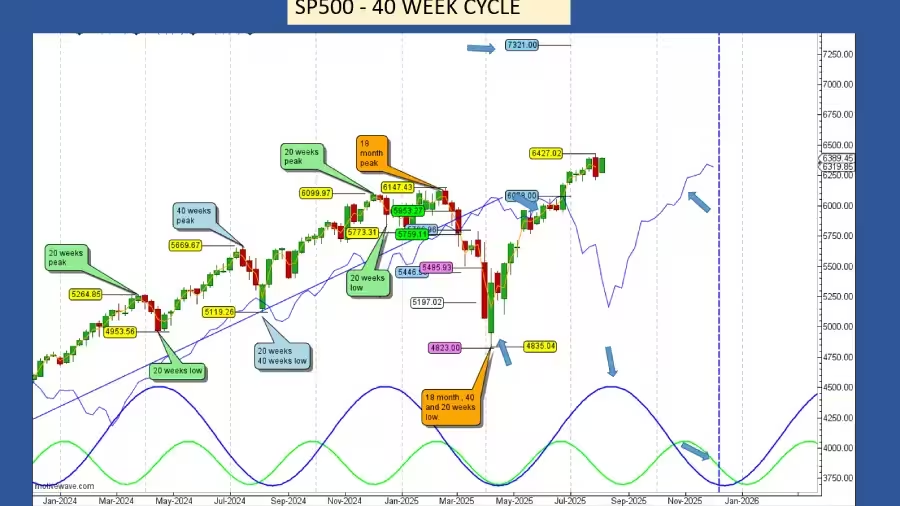
Now let’s examine the 40-week cycle in detail.
The 40-week cycle maintains its upside target of 7,321 points. Should the S&P 500 index successfully reach this target from the 6,078 crossing point, this would generate a substantial profit of 1,223 points, representing approximately 20% gains.
Any decisive crossing below the 40-week cycle line will confirm that the previous high before the crossing represents at least a 40-week cycle peak.
However, the most critical analytical question remains: when will the S&P 500 index cross below its cycle line – before or after achieving its target?
If the index crosses below before reaching the target, not only will the target become invalid, but it will also signal a bearish trend for the market, with high probability for the S&P 500 index to transition into a bearish scenario.
This development will also trigger a trading signal with potential downside target implications.
The last 40-week cycle low coincided with the last 18-month cycle low in April, and the next occurrence is scheduled for December, marked by the blue vertical dashed line. This will represent the first 40-week cycle low since the last 18-month cycle. At the time of the next 40-week cycle low formation, technically,
I expect the S&P 500 index to find support on its cycle line, represented by the blue solid line. We will determine in two weeks where the cycle line will be positioned at the time of low formation in December. This will provide us with valuable insight about the magnitude of the correction.
Given that there are two 40-week cycles within an 18-month cycle, we might reach the 7,321 target during the formation of the second 40-week cycle peak. The next 40-week cycle peak is still anticipated by the end of August, with the low expected by late December 2025, as indicated by the blue dashed line.
Once the next 40-week cycle low is confirmed, I will draw the trend line, the V.T.L.. When the market crosses below it, we can identify the next 18-month cycle peak and anticipate the upcoming correction. If the peak occurs before August and the market dips below its cycle line during the low formation, the 7,321 target may be at risk.
So far, with only one trading signal this year, the 40-week cycle maintains a success rate of 100%. The second signal and the target remain valid.
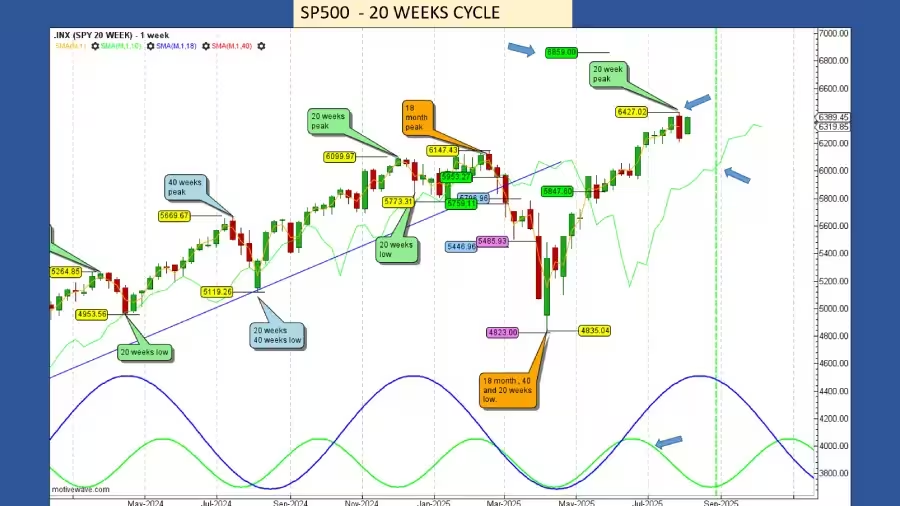
The 20-Week Cycle:
With a 6,427 new all-time high, achieved during the last week of July, there is very high probability that the S&P 500 index formed its 20-week cycle peak on July 31. We will obtain confirmation of this 20-week cycle peak by analyzing the next lower timeframe, the 80-day cycle. For now, let’s maintain focus on this 20-week cycle.
If the July peak is confirmed, then it occurred on the right part of the cycle, which is positive for the overall trend. Technically, we can expect a moderate correction, and this correction should form on its cycle line, which at the time of the cycle low formation will be around 6,050 at the end of August.
This 20-week peak at 6,427 was 462 points or 6.73% below its 6,859 upside target. Since my last update, the S&P 500 index rallied 143 points. Is the 6,859 target still valid? Unless the market crosses below its cycle line before meeting its target, yes, the target remains valid. If the S&P 500 index crosses sharply below its cycle line before meeting its target, this will be the first sign of bearishness entering the American Stock Market. However, for now, I don’t expect this scenario.
When the 20-week cycle low is confirmed, I will draw the 20-week V.T.L.
.Crossing below its 20-week V.T.L. will help identify the next 40-week cycle peak.
Since the beginning of the year, the 20-week cycle maintains a success rate of 100%.
Let’s proceed to the next lower timeframe,
the 80-day cycle to determine if we have confirmation of the 20-week cycle peak formation.
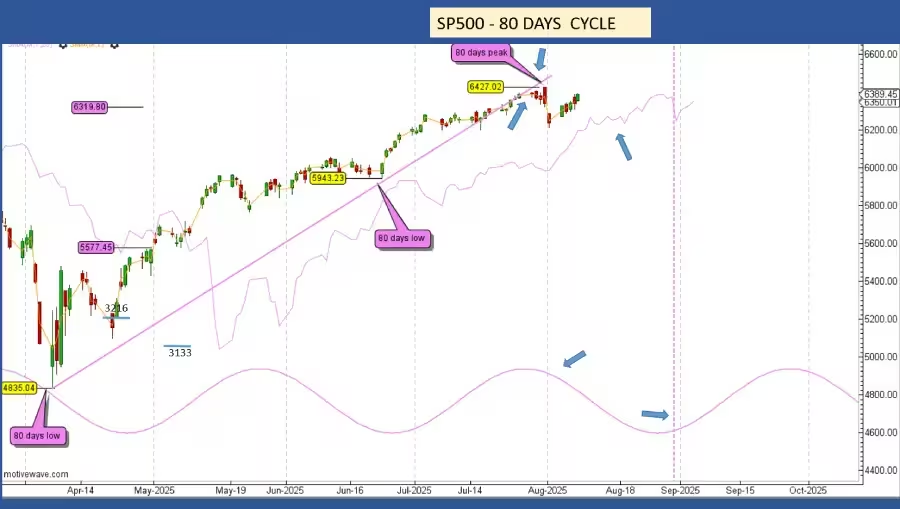
Regarding the 80-Day Cycle:
On July 31, not only did the S&P 500 index make a 6,427 new all-time high, but it also crossed below its 80-day V.T.L., the solid purple uptrend line.
This crossing provides us with very important information. According to the Hurst rule, when the market crosses below its V.T.L., this confirms that the peak of the next higher timeframe cycle has formed or is in formation.
In this case, we deal with the 80-day cycle, and the next higher timeframe is the 20-week cycle. Then, with a very high degree of confidence, we can label the July 31 high as the 20-week cycle peak. Since the peak of this second 80-day cycle occurred on the right part of the cycle, we can expect a moderate correction.
However, this correction will also be the 20-week cycle low. For this reason, The S&P 500 index should cross below its cycle line, providing a potential downside target.
In my last update, I was expecting the 80-day cycle peak to form on July 27. The peak formed on July 31, only 4 days later. We can consider the peak was on time.
The low is scheduled for August 30, marked by the vertical purple dashed line. By the Hurst rule of synchronicity, this low will also be the 20-week low.
With five trading signals since the start of the year and four successful trades, the success rate for the 80-day cycle is 80%.
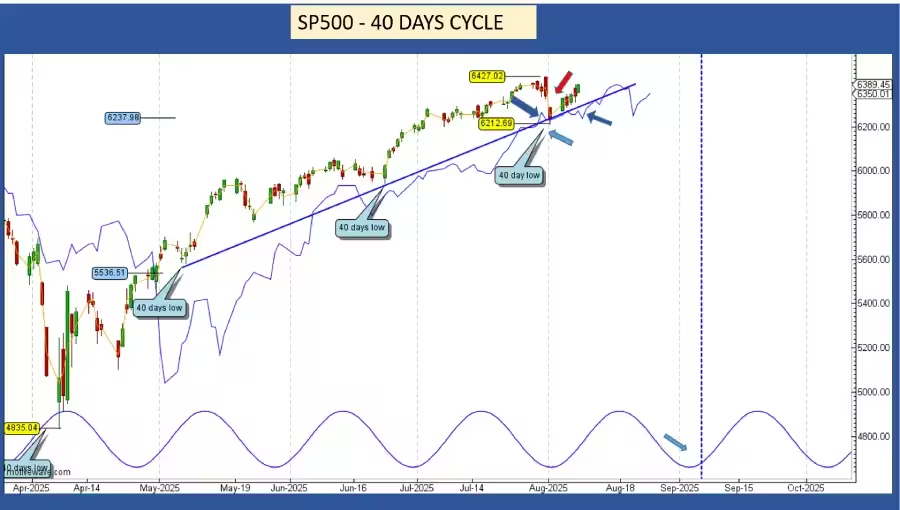
Let’s see the 40-day cycle:
The August 1 low marked the 40-day cycle low. This low found support on its cycle line and its cycle trend line, the V.T.L., which is a positive sign, since both lines provided very strong support. However, since the longer cycles, up to the 20-week cycle, are in the downside phase, the S&P 500 index should cross below its cycle line, providing a downside target for the next 40-day low.
After crossing below its cycle line, the S&P 500 index should rally toward its cycle line, using it as resistance without crossing above, then resume its decline to form its fourth and last 40-day cycle low of this 20-week cycle.
The last 40-day cycle lasted 39 days, respecting the Hurst nominal model average length of 38 days.
If the actual 40-day cycle follows the Hurst nominal model, we can expect a low formation on September 8, marked by the vertical blue dashed line.
The August downside gap has been attributed to Trump’s tariffs deadline. As I mentioned in some previous updates, news doesn’t make the market; they just add volatility to the market and may sometimes displace the low or peak by a few chart bars.
Around that date, a 40-day cycle low was expected, exactly on July 27. Since the 27th was Sunday, we moved to the next day, the 28th. The low occurred 5 days later, so we can say the expected low was on time. Instead of forming a smooth correction, the August 1 tariffs deadline news, added volatility and provided the gap, but a low was expected.
That’s the beauty of trading the cycles: at a low formation, we can expect news happening at the same time as a low formation. Depending on the degree of the cycle, the news will be more or less important. It can be any news, like unemployment numbers, interest rates, financial news, or even in this case, Trump’s tariffs deadline. The Trump’s tariffs news happened at the peak of the 20-week cycle.
Since the beginning of the year, the 40-day cycle has provided three successful signals out of three, resulting in a 100% success rate.
Short Term Trader Corner
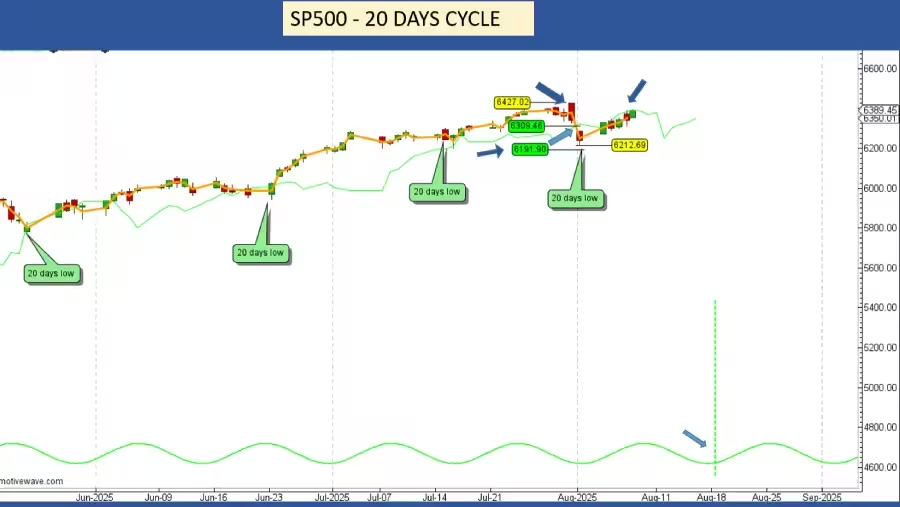
The 20-Day Cycle
Since my comprehensive update on July 7th, the 20-day cycle has generated only one downside trading signal by executing a decisive crossing below its cycle line at the 6,309.46 level, thereby providing a calculated downside target of 6,191.90 points. On the identical trading day, the S&P 500 index established a significant low at 6,212.69, positioning itself merely 21 points above the projected target. Since this low formation falls within the 1% margin of error tolerance, the target is considered successfully achieved.
Following the formation of this cyclical low, the S&P 500 index has initiated a rally progression toward its cycle line without executing a crossing above this critical technical level. From a technical analysis perspective at this current stage, the S&P 500 index should theoretically cross above the cycle line and provide a corresponding upside target.
However, given that the longer-term cycles are currently positioned in their downward phases, there exists a high probability that the market will not cross above this resistance level.
Should the upward crossing materialize against expectations, the resulting target should be established between 6,528 and 6,550 maximum before the index resumes its declining trajectory toward the next 20-day cycle low, which is expected to form on August 19th, as indicated by the green dashed vertical line.
Subsequently, the S&P 500 should rally toward its cycle line, utilizing this level as dynamic resistance, then resume its downward movement to establish the next cyclical low on September 6th.**
After completing the low formation around September 6th, the S&P 500 index will cross above its cycle line, providing a new upside target for market participants. Since the beginning of the year, with eight successful trading signals executed,
the 20-day cycle maintains a perfect 100% success rate.
conclusion
In conclusion, this comprehensive S&P 500 cycle analysis reveals a market positioned at a critical juncture with multiple timeframes converging toward significant decision points. The overarching 18-month cycle continues its bullish trajectory, with the anticipated peak still projected for January 2026, providing a long-term framework for market expectations.
The most immediate focus remains on the 40-week cycle’s 7,321 target, which maintains its validity as long as the index trades above its cycle line. This target represents a substantial 20% gain potential from the 6,078 crossing point, making it a crucial benchmark for market participants. However, any decisive break below the 40-week cycle line would not only invalidate this target but also signal a potential shift toward bearish market conditions.
Looking ahead, the next critical period will be the formation of the 40-week cycle low in December, which will provide essential guidance for the market’s direction into 2026. Traders should monitor cycle line crossings closely, as these will determine whether bullish targets remain valid or if defensive positioning becomes necessary. The convergence of multiple cycle timeframes makes the coming weeks particularly important for establishing market direction through the remainder of 2025.
Discover more from tradingmarketcycles
Subscribe to get the latest posts sent to your email.