

S&P500 Weekly Update: March 17, 2025
Introduction
In my precedent update on March 3, I noted that the S&P500 is approaching its 18-month cycle low.
I also anticipated that the S&P500 would drop below its 40-week cycle line.
Let’s review what has transpired since then and, more importantly, what we can expect in the near future.
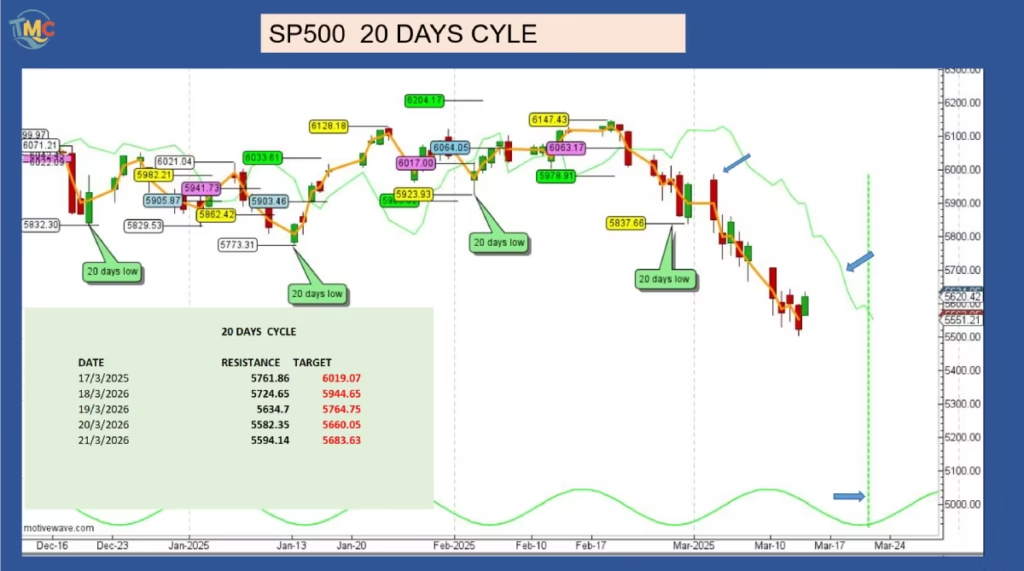
Let’s begin with the 20-day cycle.
In the March 3 update, we predicted that the next 20-day low would occur on March 17.
The bearish trend continues as expected with this cycle.
The S&P500 is exhibiting strong bearish behavior, making it challenging to identify the peak of the 20-day cycle.
We can label the peak as occurring on March 3, which is six days earlier than anticipated, confirming the market’s bearish momentum.
We can expect the next low of this 20-day cycle to form on March 20, the green vertical dashed line.
Following that, the SP500 should rally toward its cycle line.
Technically, the S&P500 is expected to cross above this line, which would provide an upside target; however, due to the prevailing bearish sentiment in the market, it is possible that the S&P500 may treat its cycle line as resistance.
In the table, you will find the cycle lines and their potential upside targets if the S&P500 crosses above them.
With five successful signals out of six, the success rate for the 20-day cycle currently stands at 83.33%.
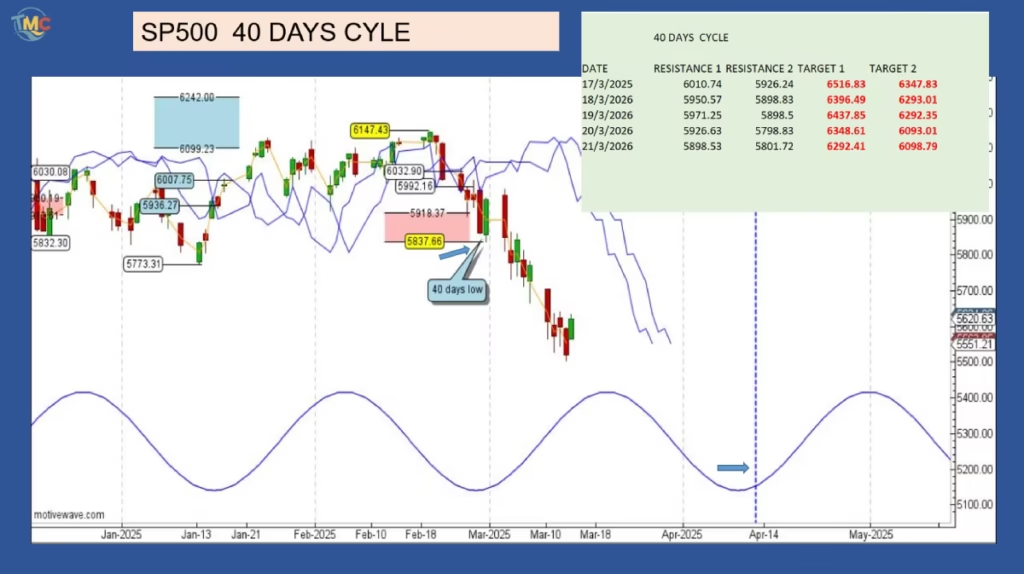
Next, let’s discuss the 40-day cycle.
There are no new developments with the 40-day cycle since my last update.
The next 40-day low is projected to occur on April 13, as indicated by the blue vertical dashed line.
This week, the S&P500 is expected to initiate a rally toward its cycle lines. The last low in the 40-day cycle was on February 28, and with two trading signals that both proved to be successful, the success rate for the 40-day cycle since the start of the year is currently 100%.
Here are the cycle lines for this week along with their potential upside targets if the S&P500 manages to cross above them.
Now, let’s take a look at the 80-day cycle.
The S&P500 has met and exceeded its potential downside target zone, confirming that the high on February 19 was significant.
We still anticipate the next 80-day cycle to form around March 22, as indicated by the purple vertical dashed line.
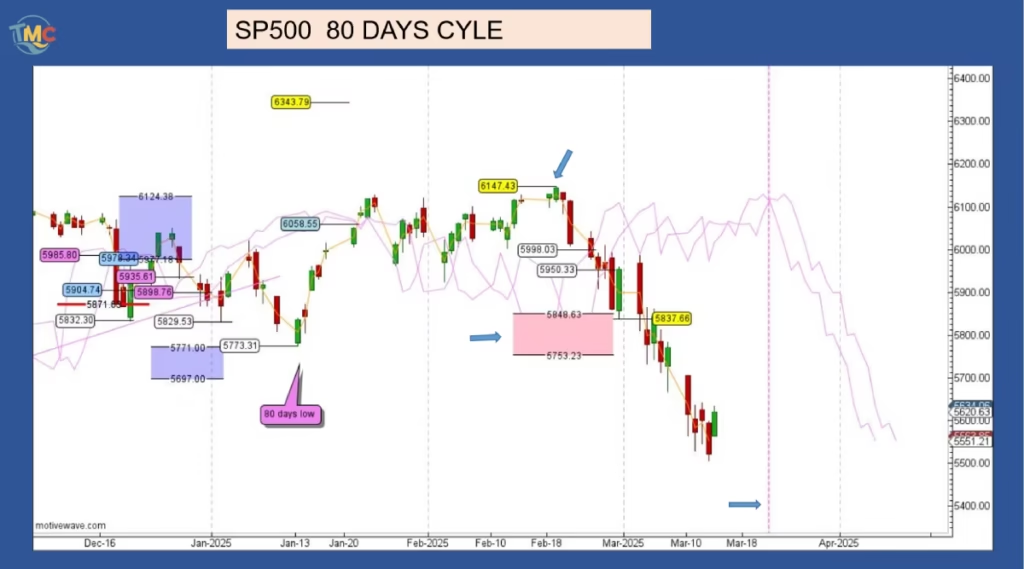
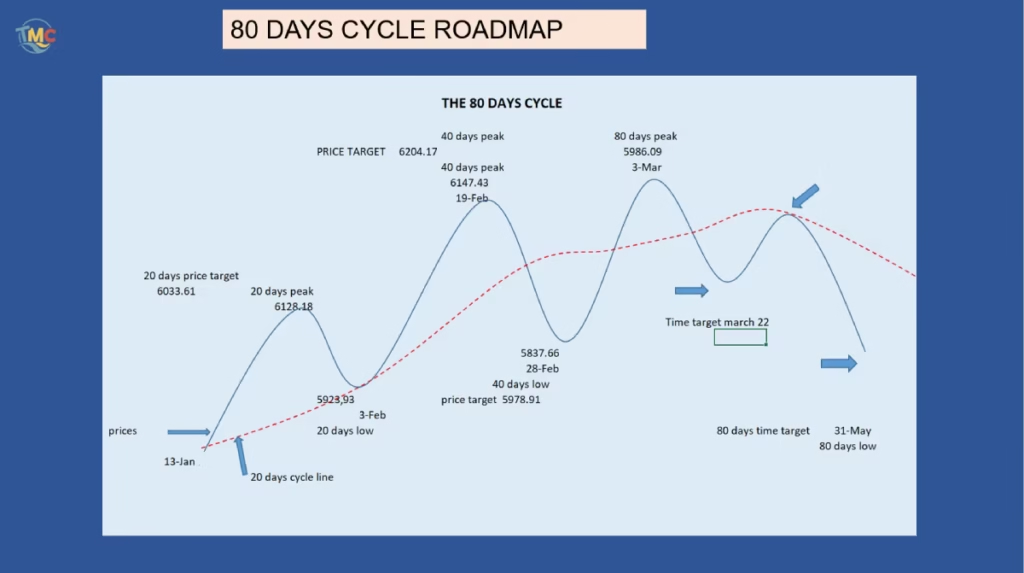
Let’s check the roadmap to understand what to expect in the coming weeks. After creating a low around March 22, the blue arrows, the S&P500 is likely to embark on a rally toward its cycle line, where it may encounter resistance before resuming its decline toward the next low at the end of May.
With two trading signals—one negative and one positive—this year’s success rate is currently at 50%.
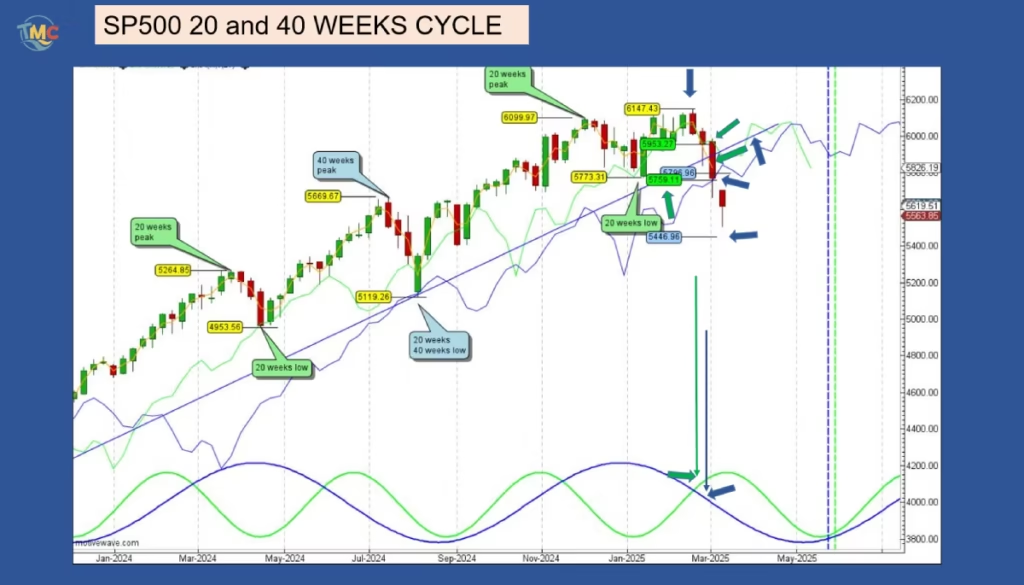
Now, let’s examine the 20 and the 40-week cycle.
As expected during my last S&P500 weekly update, the confirmation of the crossing below the cycle line has occurred. This crossing happened at 5,953.27, leading to a target of 5,759.11, the green arrows.
This target was achieved the week following the signal trigger.
Because the peak of this 20-week cycle occurred on the left side of the cycle, it explains the sharp decline since the all-time high.
With one successful signal, the 20-week cycle currently maintains a 100% success rate.
By crossing below its 40-week cycle trend line, the S&P500 confirms that the high of February 19 at 6,147.43 (the blue arrows), was at least the peak of the 40-week cycle.
According to Hurst’s rule, when the market crosses below its cycle trend line (or VTL), it also confirms that the peak of the next higher degree cycle has formed or is in formation.
Given that the VTL was the 40-week VTL, the next higher degree cycle is the 18-month cycle. We can confidently label the February 19 peak as the 18-month cycle high.
We also anticipated the S&P500 to drop below its cycle line, establishing a target for the next 40-week low and definitively for the 18-month cycle low.
The crossing happened at 5,796.96, setting a target of 5,446.96—a potential profit of 350 points, or 6%.
This target aligns closely with the 18-month cycle line. Since the peak of the 40-week cycle occurred on the right side of the cycle, (the blue vertical arrow), known as right translation in Hurst’s terminology,
we can expect a moderate correction in the 40-week cycle.
.
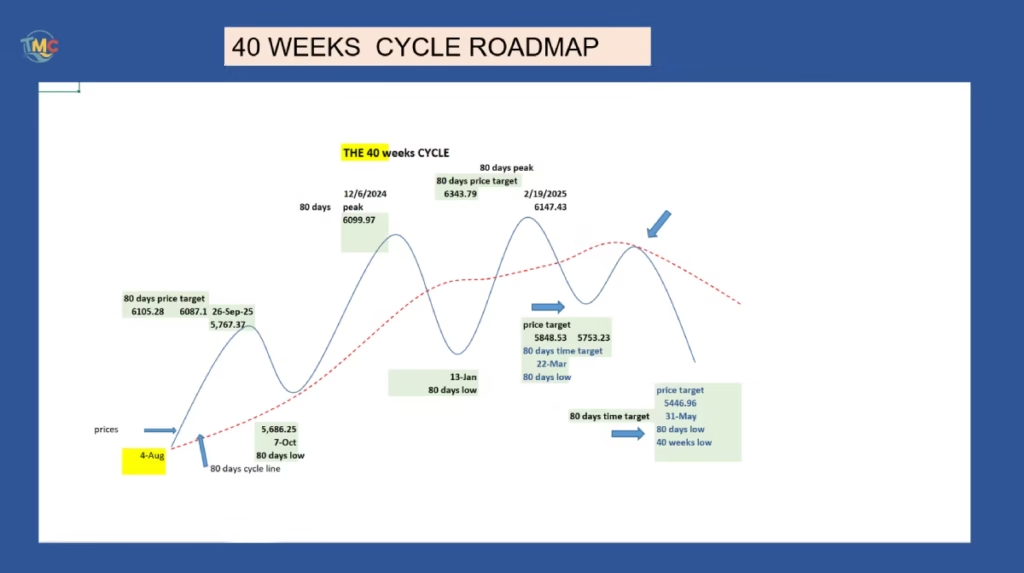
Below is the 40-week cycle roadmap.
Since this is a 40-week roadmap, we are using the 80-day cycle line to analyze market interactions.
Within one 40-week cycle, there are four 80-day cycles.
This 40-week cycle begins in August 2024.
The S&P500 rallies to reach the September high, forming its first 80-day peak. As expected during the first 80-day cycle, the S&P500 finds support around its cycle low in October 2024.
It then rebounds, heading toward its second 80-day cycle peak in January 2025.
On its way to the second 80-day low, the S&P500 falls below its target, as expected. During this phase of the second 80-day cycle, the market is expected to cross below its cycle line.
The S&P500 then rallies back above its cycle line, providing a target.
However, this target is invalidated since the S&P500 crosses back below its cycle line without reaching the target.
The third 80-day cycle is scheduled for March 22 (marked by the first blue arrow). During this phase, the market is expected to cross below the cycle line again. Subsequently, it should rally to form its fourth and final 80-day peak (marked by the second blue arrow). This peak is expected to form at the cycle line without crossing above it.
The S&P500 is then projected to resume its decline, reaching its fourth and final 80-day low around May 31. This marks the end of the 40-week cycle. Since this is the second 40-week cycle following the last 18-month low, it will also signify the 18-month cycle low.
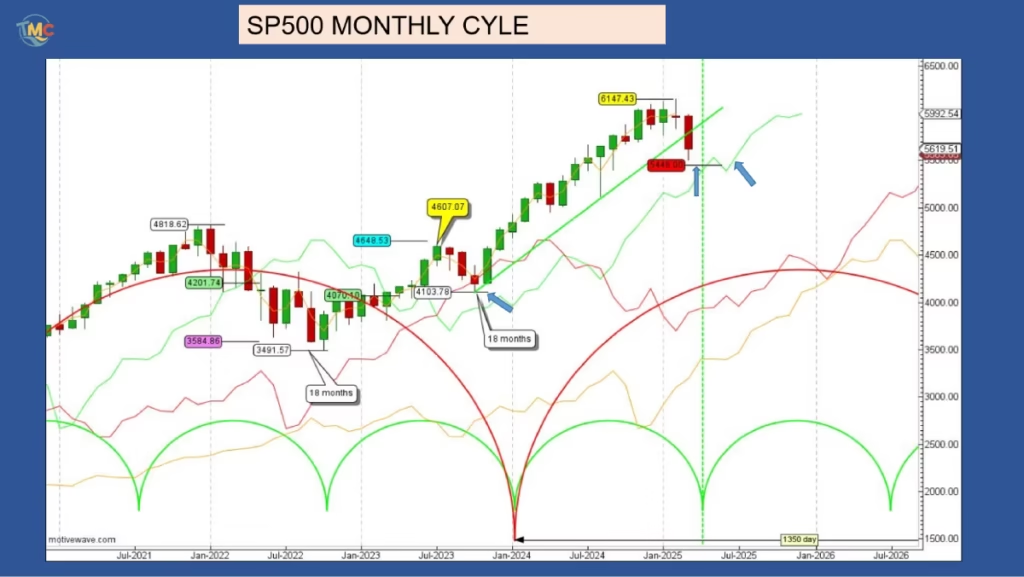
The 18-Month Cycle Analysis.
When examining the monthly chart patterns, I have specifically highlighted in red the critical 40-week cycle target.
Cyclical analysis suggests that during the formation of the upcoming 18-month cycle low, the S&P500 index is anticipated to establish significant support along its primary cycle line.
From a short-term perspective, market indicators point to a potential decline of approximately 11%.
However, it’s crucial to view this movement within the broader context of the 18-month cycle, where this correction would only constitute a 34% retracement.
For a long-term cycle of this magnitude, such a retracement level is considered well within normal parameters and shouldn’t cause undue concern among long-term investors.
It’s worth noting that since establishing its last 18-month cycle low in October 2023, the S&P500 has demonstrated remarkable strength, advancing by 2,044 points, representing an impressive 50% gain. However, market participants should remain vigilant,
If the index decisively breaks below its established cycle line, this could signal a need to reassess our current positioning within the larger 54-month cycle framework.
Such a breakdown might indicate that more substantial declines could be on the horizon.
Conclusion:
The S&P500 index appears to be entering a crucial phase as it progresses toward forming its next 18-month cycle low. Based on cyclical patterns, current market indicators suggest that the index is likely to experience a corrective phase in the coming months.
Our primary downside target is established at 5,446.96, a level that aligns with both technical support zones and historical cycle patterns. This projected level represents a significant technical junction where multiple factors converge, including previous support levels, cycle line intersections, and key retracement levels.
The 18-Month Cycle Analysis indicates that this anticipated movement is part of a larger cyclical structure.
While reaching this target would represent a notable decline from current levels, it’s important to understand that such movements are integral to healthy market dynamics and often provide opportunities for longer-term positioning.
Investors and traders should monitor key technical levels and market behavior around this target area, as it could provide valuable insights into the strength and sustainability of the broader market trend. The manner in which the market approaches and reacts to this level could offer important clues about the next major market phase.
Remember that while cycle analysis provides valuable framework for understanding market movements, it should be used in conjunction with other technical or fundamental analysis tools for comprehensive market assessment.
Discover more from tradingmarketcycles
Subscribe to get the latest posts sent to your email.