

S&P500 January 13, 2025 Market Update – Trading Signals & Hurst Cycles
Table of ContentsToggle Table of ContentToggle
Introduction.
Stock Market: What Happens Next?
On the first article of January 2025, I published 2 tables, those tables are the success rate table for the year 2023 and 2024.
Analyzing both tables show the accuracy of the trading signal, to provide consistent return by trading the Hurst cycles technique.
Using the tables, help the trader or the investor to choose which cycle in which market to trade, in order to generate extra revenues on regular basis.
For this year 2025, I made a little change about the margin of error, even if the usually average of error is 1%, to try to be more precise, as a test I changed the % of margin of error from 1% to 0.5%.
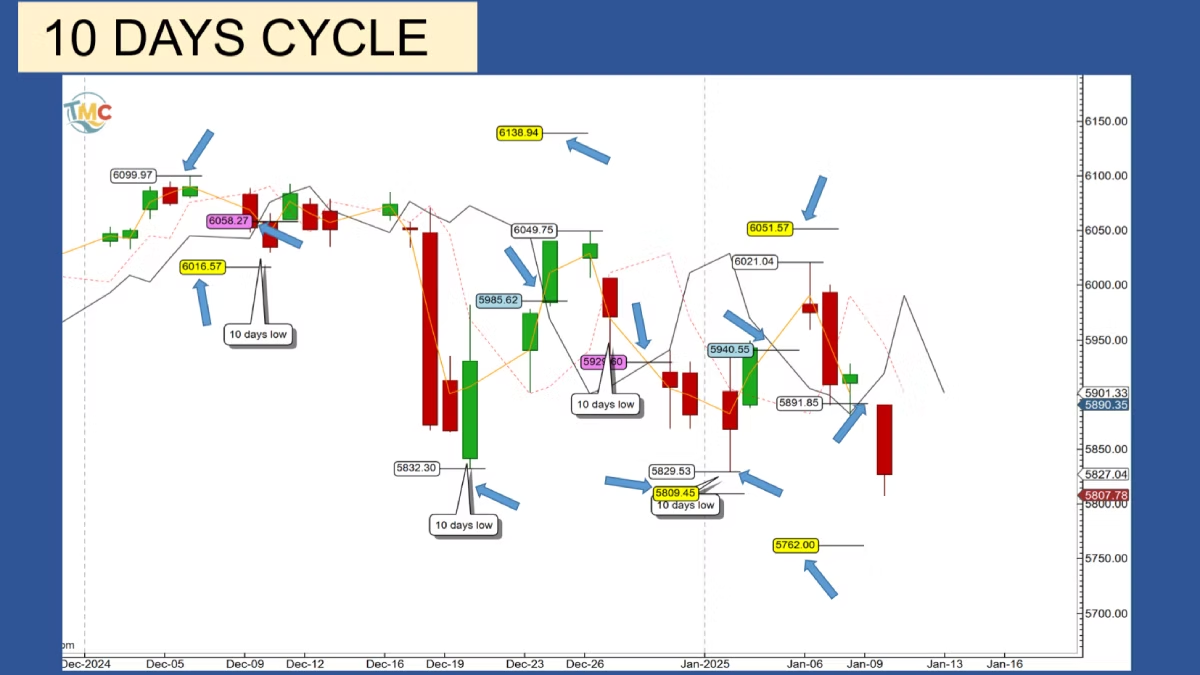
Let ‘start this weekly analysis by the 10 days cycle.
Since the December 6 2024 all-time high, the S&P500 index provide 5 trading signals.
The first one, was on the downside when the S&P500 crossed below his cycle line or FLD, on December 10 at 6,058, for a 6,016 potential downside target.
The same day, the S&P500 made a low at 6,029, but the market continue to decline, until forming a low at the next 10 days cycle low formation, on December 20 at 5,832.30.
On December 24, the S&P500 crossed back above his cycle line at 5,985,
providing a new all-time high target at 6,138, but due to the market weakness, the S&P500 missed his target and instead provide a downside target at 5,809 on December 30.
On January 2 2025, the S&P500 made a low at 5,829, missing his target by only 20 points or 0.34%, but since the low was within the 0.50% of the margin of error, the target is considerate meet.
The fourth was on January 3 2025, when the S&P500 crossed above his cycle line at 5,940 to give an upside target at 6,051, 111 points or 1.86% of potential profits. On January 6, the target has been meet.
The fifth and last trading signal was on Friday December 10, when the S&P500 crossed below his cycle line at 5,891, for a potential downside target at 5,762.
The crossing occurred after the S&P500, missed his last target by only 31points, or 0.50% just at the limit of the margin of error, the target is considered meet.
For the first two signals of the year, the market meet his target, for a success rate of 100%.
The next 10 days cycle is expected to form a low on January 10 and January 18.
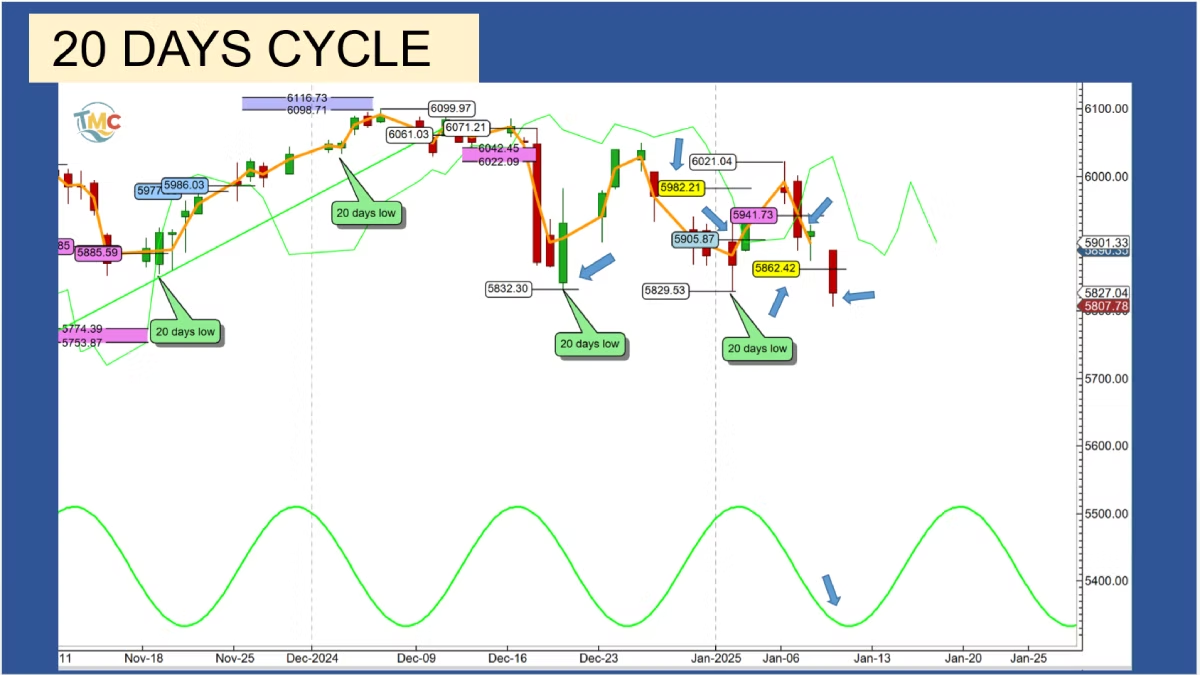
The 20 days cycle In stock market.
The last 20 days cycle formed on December 20th 2024 at 5,832.30.
The next low was expected on January 7th 2025.
From the December 20th low and the January 2 lows, the S&P500 provide 1 trading signal,
The crossing above his cycle line happened on January 3thd, at 5,905.87 giving an upside target at 5,982, which was meet 3 days later on the January 6th, 2025.
The first trading signal of the year was meet, giving a 100% success rate for the 20 days cycle.
The crossing confirm the December 20 or the January 2nd is at least a 20 days cycle low.
Everything is in favor to label the last 20 days low on December 20 2024.
Technically, at the time of the next 20 days cycle low, following a major low, the S&P500 should find support on his cycle line.
If the S&P500, do not find support, on his cycle line, then we can start to considerate the bearish scenario.
Even if the previous 20 days low was on January 2nd 2025, the S&P500 should find support on his cycle line by the January 20th.
On last Thursday January 9th, the S&P500 crossed below his cycle line at 5,941, for a potential target at 5,862, the next day, Friday 10th, the S&P500 meet his target, the second signal of the year has also been successful, keeping the success rate at 100%.
The next 20 days low was expected for the January 7th, but the last Friday decline could be the 20 days cycle low expected on January 7, in this case the 20 days cycle will be 21 days long, 3 days longer then the Hurst nominal model which is 18 days,
This will make sense, since, in the stock market, the bear trend usually the cycle are longer than the nominal model, and in the bull trend the cycle have a tendency to be shorter.
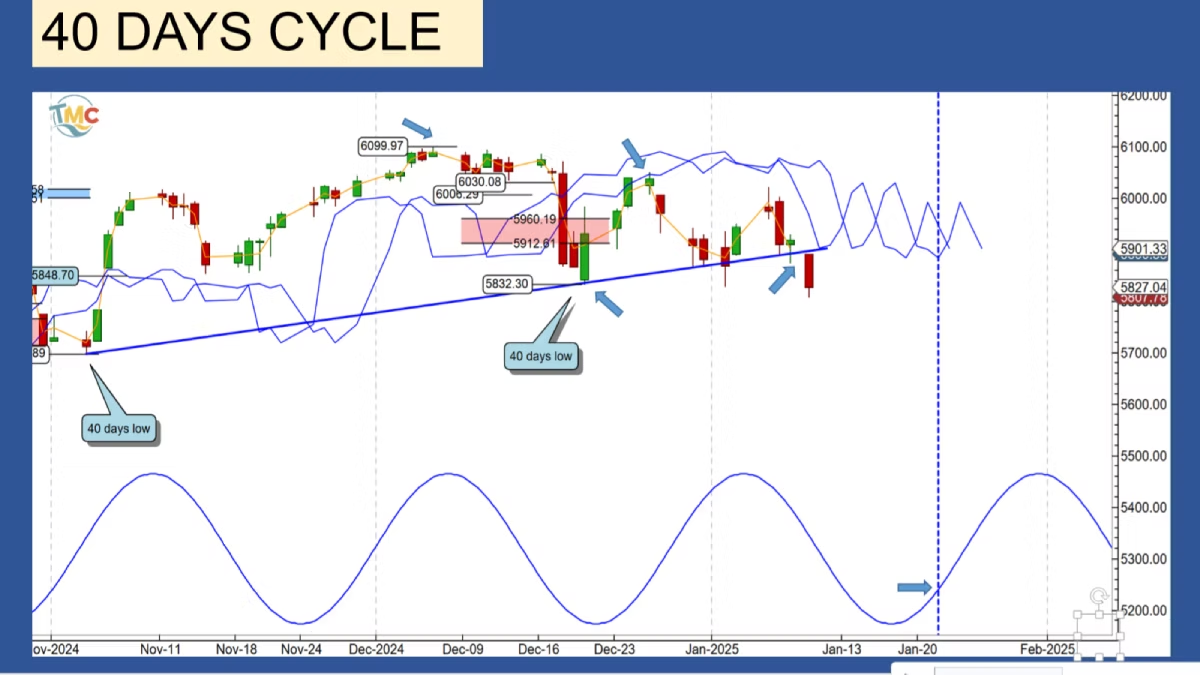
The 40 days cycle In stock market.
My favorite analysis is the December 20th 2024 low was the 20 weeks cycle low, then according to the Hurst principle of synchronicity, is also the 80, 40, 20, 10 days low.
Let’s assume the last 40 days cycle low formed on December 20th, 2024,
The next low for this 40 days low is expected on January 23thd 2025.
But we have to keep in mind the low may occurred on January 2nd, 2025, but for the rest of the analysis, knowing where the last 40 days formed, is for now, not very important,
It just change the time of the next 40 days low will form.
In case of the December 20th, the low is expected on January 23td, otherwise if the low is on January 2nd is expected on February 5th 2025.
Only 13 days difference, so we can expected a low forming during this time window.
Since the previous low, the S&P500 rally toward his cycle line,
For the S&P500 bull trend to continue, it is very important the S&P500 cross above his cycle lines, this will confirm the possibility of the longer cycle peaks, the 20, 40 weeks and 18 months cycles are not formed yet.
If the S&P500 failed to cross above his cycle line, then there is a very high probability the December 6th 2024 was a major high.
If the market cross above his cycle line, it should find support on his cycle line during the January 23thd or February 5 low formation, then rebound sharply on his way to form the 80 days peak.
The 40 days cycle peak, is expected between the January 6th and January 19th, depending where we place the last 40 days low.
When the next 20 days low will be confirm, I will draw the 20 days cycle trend, the VTL a crossing below the 20 days cycle trend or VTL, will confirm the 40 days cycle peak.
When the S&P500 40 days cycle peak will be identified, it will be very important to see where the peak has formed compare to the peak of the cycle, knowing if we have a left or right time translation, will give an idea about the future trend of the market.
To know more about time translation in the stock market and the consequences, I recommend to watch my video, secrets behind the cycles and read my articles about time translation, it is a very important concept to help to anticipate the volatility of the market trend.
During the last Friday decline, the market crossed below his cycle trend line, confirming the December 6th 6,099.97 all-time high is the 80 days and at least 20 weeks cycle peak.
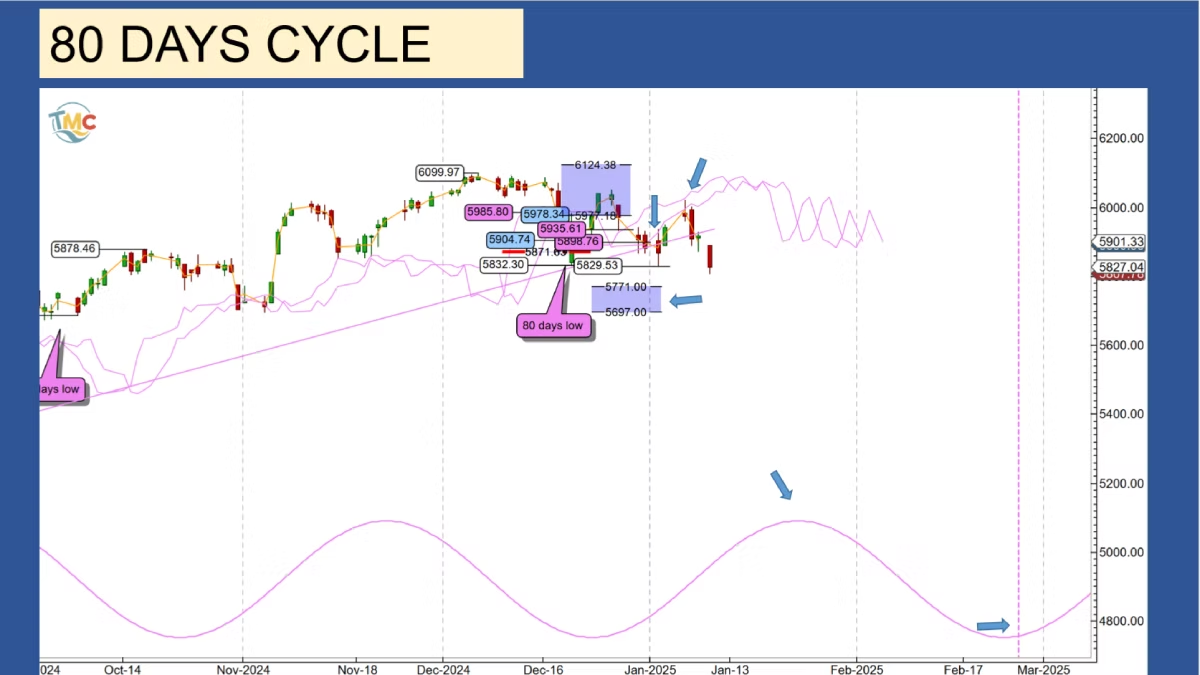
The 80 days cycle In stock market.
During the January 2nd low formation, the S&P500 crossed below his cycle line providing a downside target,
The crossing happened at 5,935 and 5,898 for a target zone between 5,771 and 5,697.
After forming his 5,829 low, the S&P500 rebound and found resistance on his cycle line,
Since that day the market resumed his decline, this is another sign of the December 6th high could be a major top.
After forming his low on January 2nd, the S&P500 supposed to cross above his cycle line, since it didn’t happened this could be a bearish sign.
But we need confirmation to officially label the December 20th or the January 2nd low, as the last 80 days low.
The next 80 days low cycle is expected on February 23thd.
The last upside target for the year 2024 between 6,124 and 5,797, was perfectly meet with an all-time high at 6,099.97 (see the 20 days chart).
The peak for the next 80 days cycle is expected on January 23thd, but there is a possibility the January 6th peak could be the 80 days peak,
In this case this is bearish for the market and we can expect further decline.
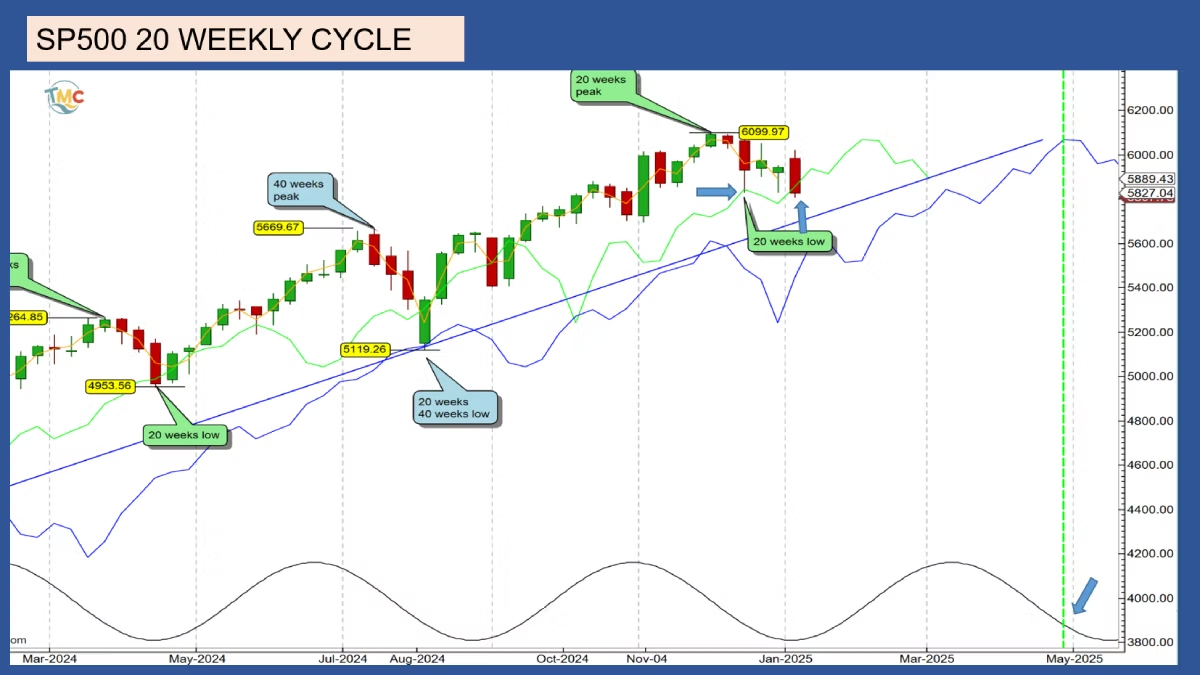
The 20 weeks cycle In stock market.
At the time I am writing this post, the S&P500 is trading on his cycle line, but the median price didn’t crossed yet below his cycle line,
As a reminder to get a valid signal, is the median price have to cross below his cycle line,
If next week the market continue his decline and the S&P500 cross below his cycle line, then we will have a potential downside target, to at least at 5,609.
But before we take this target seriously, we need confirmation of the crossing.
Like mentioned on the previous update, the last 20 weeks cycle low found support on December 20th 2024, right on his cycle line like expected.
The next 20 weeks cycle is expected on the April 26th week.
Due to the principle of synchronicity, this low will also be the 40 weeks and the 18 months cycle low.
Technically, this week we should have the confirmation of the crossing.
Conclusion
The 20, 40 weeks and 18 months cycle of the American stock market, are in down phase,
We can expect more decline for the American stock market until mid-April 2025, when the next 18 months cycle low is expected to form.
We can expect the prices find support, at least on the 40 weeks cycle line, but there is also the probability, the market will cross below the 40 weeks cycle line providing a lower target.
Discover more from tradingmarketcycles
Subscribe to get the latest posts sent to your email.