

S&P500 December/16/2024 Update
Trading the S&P500: Mastering Market Cycles
Understanding Market Cycles for Successful Trading
In this article, we’ll explore how to effectively use market cycles to trade the S&P500. Specifically, we’ll focus on the 10-day cycle, which can help you capitalize on a full 40-day cycle.
The Importance of Combining Tools
While trading cycles can be insightful, it’s always beneficial to pair them with other technical tools, such as the VTL (Valid Trend Line). Remember, this content is for educational purposes and not trading advice.
Example of Cycle Trading
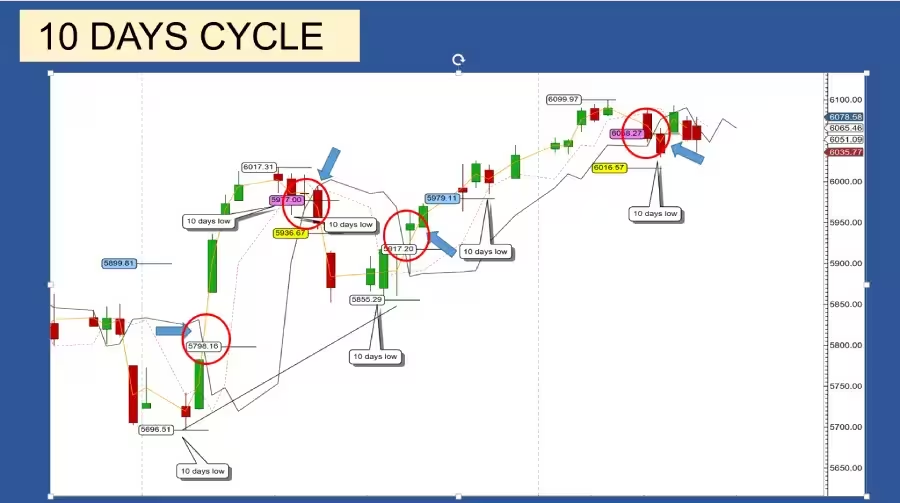
Let’s begin with a practical example using the last major low on November 4, which initiated the S&P500-40-day cycle.
Knowing the last 40 days cycle formed a low on November 4, we expected the next ow for the December 8.
- First Signal:
On November 6, the S&P500 crossed above the cycle line at 5798, aiming for a target of 5899. This target was hit the same day, with the index rising to an all-time high of 6017.31 by November 11.
- Exit Strategy:
On November 14, the S&P500 dipped below the cycle line at 5977, targeting 5936. The S&P500 reached a low of 5855 on November 19. Entering the market at 5864 and exiting at 5977 would yield a profit of $133 in just 8 days.
- Bull Market Strategy:
Given the strong bull market, I recommend avoiding downside signals, even if the S&P500 is technically expected to decline to the 20-day cycle line, currently around 5900.
- Second Trading Signal:
A bullish crossing occurred on November 21 at 5917, targeting 5979. If you entered at 5944 and exited at 6029 on December 10, that would result in an $85 profit.
In total, these two trades could yield $198 in profits within a month.
Applying This Strategy across Markets
This cycle trading strategy applies not only to futures but also to mini or micro futures, options, and ETFs.
Current Market Status
Let’ see where we are now since my last December 9 update,
During this update, I mentioned the S&P500 is certainly on his way to form his 20 weeks cycle peak.
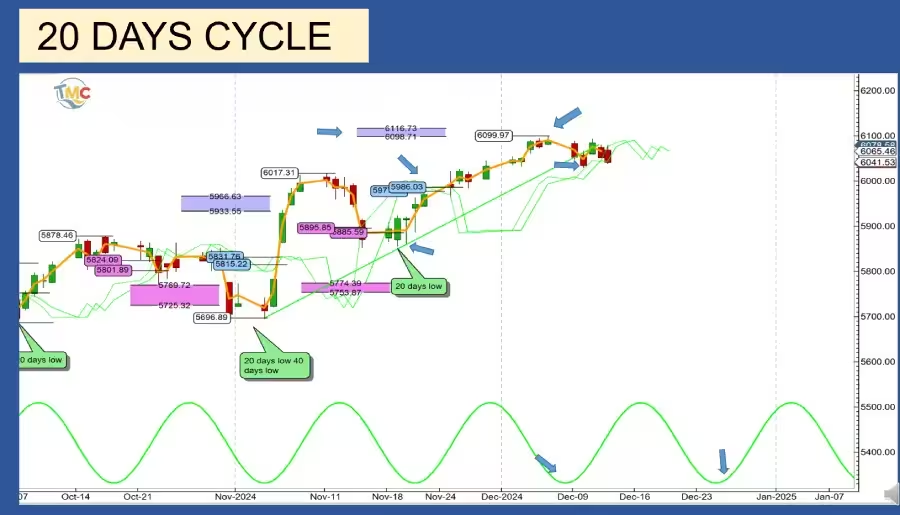
Let’s start by the 20 days cycle.
On December 6, the S&P500 made a new all-time high at 6,099, meeting perfectly his target zone which was between 6,116 and 6,098.
This target has been triggered, on November 26 when the S&P500 market crossed above his cycle lines at 5,977 and 5,986,
providing an upside target zone between , 6,098 and 6,116.
Respectively 121 and 130 points, or between 2.02 and 2.17% of potential profits.
The last 20 days low for the S&P 500, was on November 19 low at 5,855.
The next one was expected on December 7, the S&P500 made a low on December 10 at 6,029, just 3 days later than expected.
This 20 days cycle is 21 days long, the 20 days cycle length according to the Hurst nominal model is 18 days.
The S&P500 found support on his cycle line on December 10.
Since it’s the second 20 days cycle since the November 4 low,
technically the market supposed to cross below the cycle lines and provide a downside target.
Especially we are expecting the 20 weeks cycle low forming in December.
The next S&P500 20 days low is expected on December 28.
What’s next?
If the S&P500 rebound sharply and make a new all-time high,
then we can considerate the alternative analysis for the 80 days cycle.
But the potential new high will be very close to be the 20 weeks cycle peak.
We will see later the different options.
No matter the option, we start a new 20 days cycle.
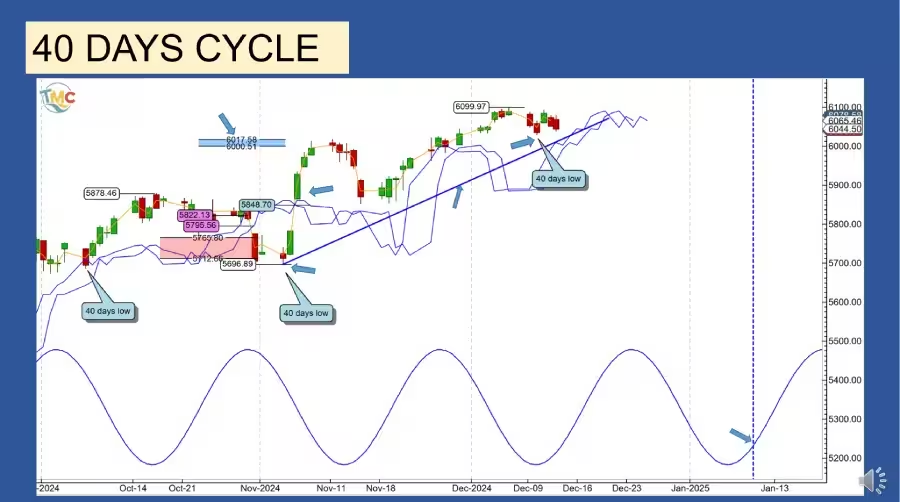
The 40 days cycle.
With a low at 5,696, the S&P 500 formed his last 40 days low on November 4,
After the 40 days low formation, on November 6, the S&P500 market crossed back above his cycle lines at 5,848, providing an upside target zone between 6,000 and 6,017, for 152 points or 2.59% of potential profits.
The target has been meet 4 days later on November 8, the next 40 days was expected on December 8,
On December 10, the S&P500 made a low at 6,029, this low could be the 40 days low.
Since we are expecting the 80 days and the 20 weeks cycles low for mid- December, the S&P500 supposed to cross below his cycle line, if the market do not cross below his cycle line, then there is an anomaly in the market.
Maybe this is due to the formation of the last 80 days low, which can be on the November 4 instead of October 7.
For the 40 days cycle traders, nothing change because in any case we start a new 40 days cycle, the only difference is the strength of the next cycle, if the last 80 days was on November 4, we may see a sharp and short rebound making a new high, then later the market will cross below his cycle lines, on his way to the next 40,80 days and 20 weeks low.
Otherwise the market should cross below his cycle lines this week and will provide a downside target zone.
The next 40 days low is expected around January 11 or 13, the blue vertical dashed line.
Assuming the December 10 was the 40 days low, I draw the 40 days cycle trend line, the blue line on the chart, with this trend line we will be able to identify when the next 80 days peak will form, when the S&P500 will cross below.
Since we expect the 20 weeks low soon, when this will happen we can expect a sharp decline.
The success rate trading the 40 days cycle is 90%.
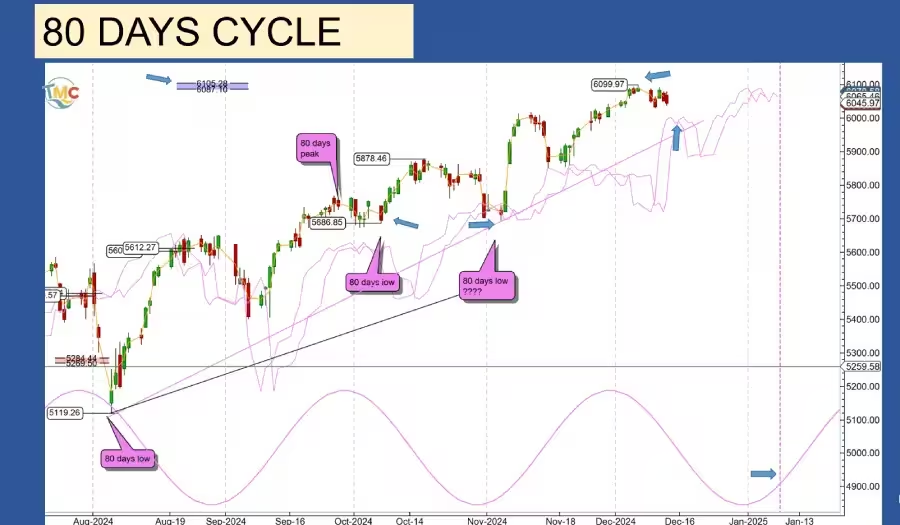
The 80 days Cycle.
With this cycle we may have 2 options, the first one is like I mentioned on my last analysis, and the 80 days low was on October 7,
Since we expect the next longer cycle forming a low, , the 20 weeks and the 80 days cycle, to valid this option, the S&P500 supposed to cross below his cycle line,
The problem with this option, is the S&P500 is still above his cycle line and the low is expected on December 14, Mondays the date for the low will be overdue, is this option is valid, we should have a sharp decline this week to form the 80 days cycle, unless the cycle is longer than expected, the low will occur little bit later.
The second option which is the most likely to happen,
is the last 80 days low was on November 4, in this case we can expect the next 80 days low on January 11 2025.
Is this scenario is the right one, the last 80 days cycle was 90 days long,
Which is very long for an 80 days cycle, usually the average length is 68 days on the Hurst nominal model, but is not impossible due to the political context, with the U.S, Presidential election.
Then we can have a short rally to form the 80 days peak, and a decline on his way to the next 80 days low.
Why this anomaly?
This certainly due to the American Presidential election.
When the market expect a news or event, the cycles have tendency to get shorter or extend slightly.
But the cycle low will form in a time window within the expecting time.
With the December 6 high at 6,099, the S&P500 meet his target zone 6105-6087
The success rate for trading the 80 days cycle is 100%, meaning all the trading signal are profitable.
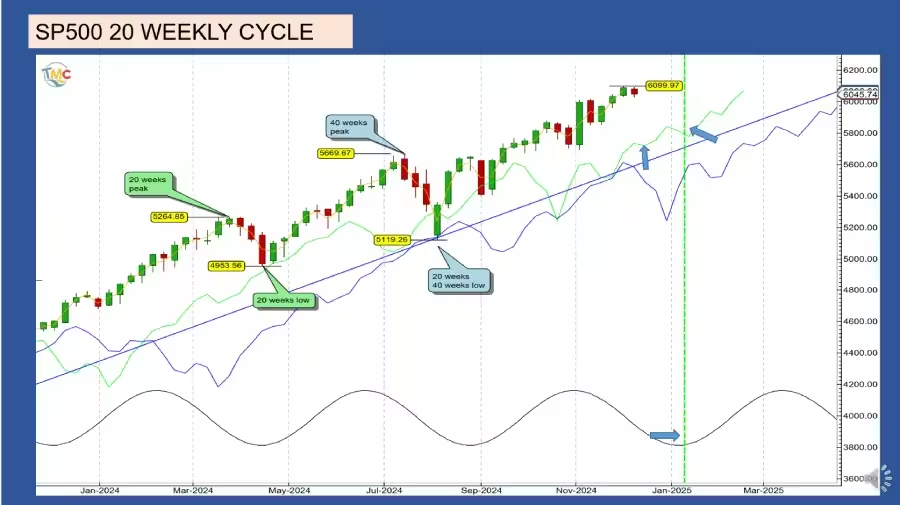
The 20 weeks cycle
We still expected the 20 weeks cycle low formation, which should occur very soon.
During the formation of this 20 weeks cycle low, the S&P500 market should find support on his cycle line, which will be around 5,840 on the December 14.
If the second scenario for the 80 days cycle is the valid one, then the 20 weeks cycle low should form around January 11 2025, the vertical green dashed line on the chart.
At that date the cycle line will be around 5,935.
But due to the amount of bullishness in the S&P500 market, there is a possibility the market will not even reach his cycle line.
In conclusion.
The SP500 index is still in a bullish phase but the 20 weeks peak should form very soon.
We can expect the 20-week cycle low to form between 5,935 and 5,840.
After this low is established, we can expect a rally toward the peak of the 18-month cycle.
Discover more from tradingmarketcycles
Subscribe to get the latest posts sent to your email.