
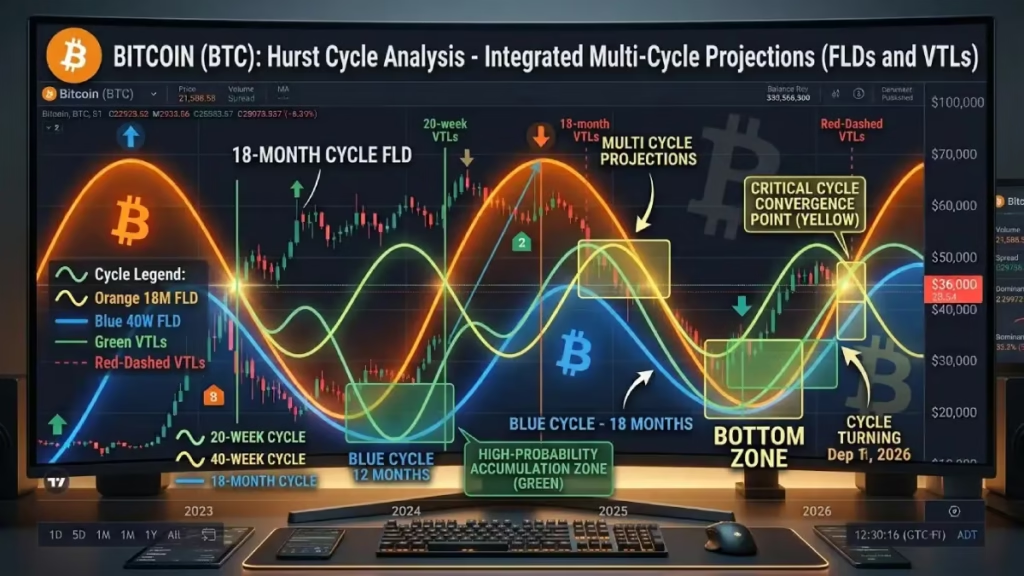
Bitcoin Cycle Analysis: Key Targets & Potential Lows for 2026–2027
Introduction
Welcome back to our comprehensive technical market updates after my four-week vacation. In this edition, we provide an in-depth Bitcoin cycle analysis using Hurst cycle principles to evaluate long-term, medium-term, and short-term price movements.
By examining the 18-month, 40-week, 20-week, 80-day and 40-day cycles, we break down current upside targets, critical support levels, and key low expectations to help you navigate upcoming market trends effectively.
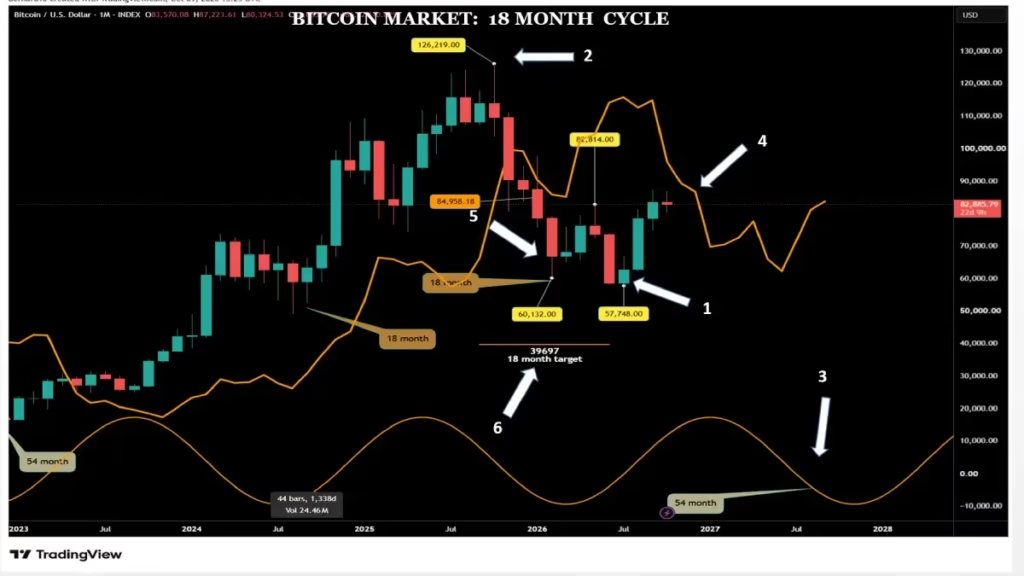
The 18 Month Cycle.
The last Bitcoin update was published on June 29, 2026. (arrow1)
Let us start with the 18-month cycle.
The October 2025 high of $126,219 (arrow 2) marked the peak of the 18-month cycle.
The low for this 18-month cycle is expected around the same time as the next 40-week cycle low, currently projected for August 2027(arrow 3) (with intermediary 40-week projections approaching November).
We will receive confirmation of the 18-month cycle low formation when Bitcoin crosses sharply and clearly above its FLD. (arrow 4)
For a valid signal, the median price must cross above its FLD, not merely the high of the month. An eventual cross above its FLD will not only confirm the potential 18-month low formation, but will also establish a potential upside target for the upcoming 18-month cycle.
In the meantime, however, the Bitcoin market should continue trading below its FLD.
The previous 18-month cycle formed in February 2026 (arrow 5) and lasted exactly 18 months. The $39,697 target (arrow 6) remains valid until the Bitcoin market crosses back above its FLD.
Due to the recent rally in the Bitcoin market, there is a possibility that the 18-month cycle dynamics may shift, occurring in July 2026. If that analysis is correct, the last 18 month cycle is 23 month long, 5 month longer than the Hurst nominal model, 5 month is little bit long but not impossible.
The 40 week Cycle.
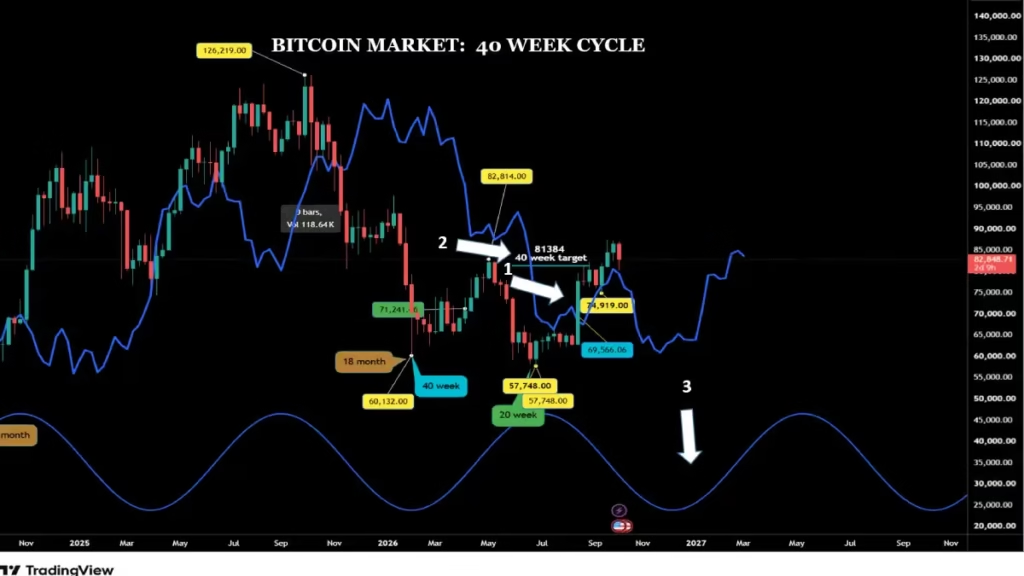
During the week of August 17, (arrow 1) the Bitcoin market crossed above its FLD. This crossing confirmed that the previous 40-week cycle had formed and provided a potential upside target of $81,384, (arrow 2) which was reached rapidly—a clear sign of short-term bullishness in the Bitcoin market.
The low for the current 40-week cycle is still expected during the first week of November (arrow 3).
The 20 week Cycle.
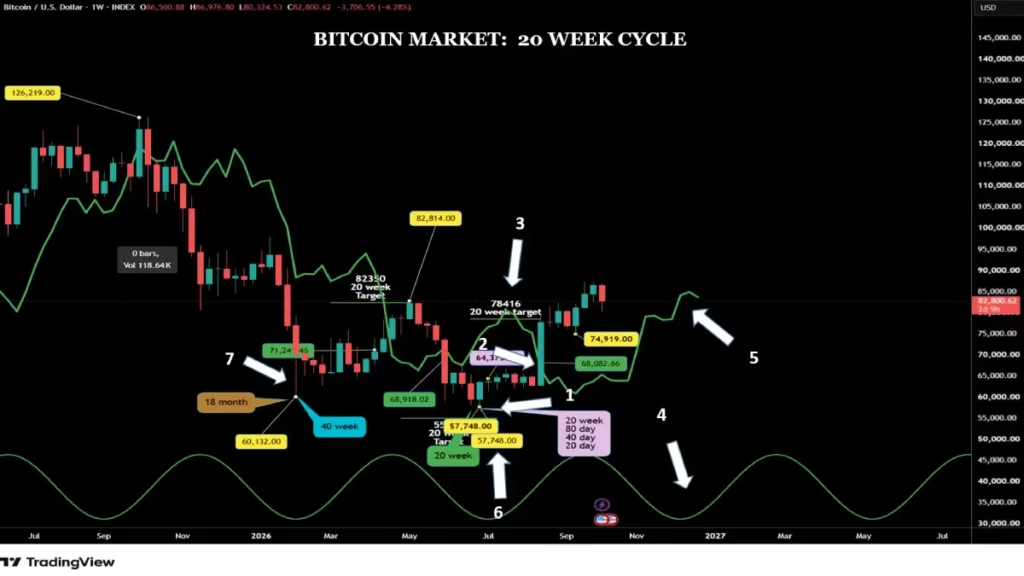
The July 1 low of $57,748 (arrow 1) was confirmed as a 20-week cycle low when price crossed above its cycle line at $68,082 (arrow 2). This crossing also generated a potential upside target of $78,416 (arrow 3), which was met the following week.
When a target is achieved shortly after a signal, it indicates a healthy amount of bullish momentum in the market.
What can we expect for the next 20-week cycle?
Its low is scheduled for the first week of November (arrow 4). Depending on where this low forms relative to its FLD (arrow 5), we will obtain confirmation regarding the exact placement of the 40-week cycle and, by Hurst’s rule of synchronicity, the 18-month cycle low.
Currently, there is an ongoing debate on where to anchor the 40-week cycle, given that the July 1 low (arrow 6) is lower than the February low (arrow 7).
Indeed, if Bitcoin forms its next low in November below its FLD, there is a very high probability that the February low represents the actual 18-month low.
Conversely, if Bitcoin forms its low on its cycle line and rebounds, then July 1, 2026, becomes the primary candidate for both the 40-week and 18-month cycle lows.
If this second scenario is confirmed, we can anticipate a bullish trend over the next few months.
The 80 Day Cycle.
Not knowing with complete certainty where the 40-week and 18-month cycles originated is not overly critical when it comes to daily trading.
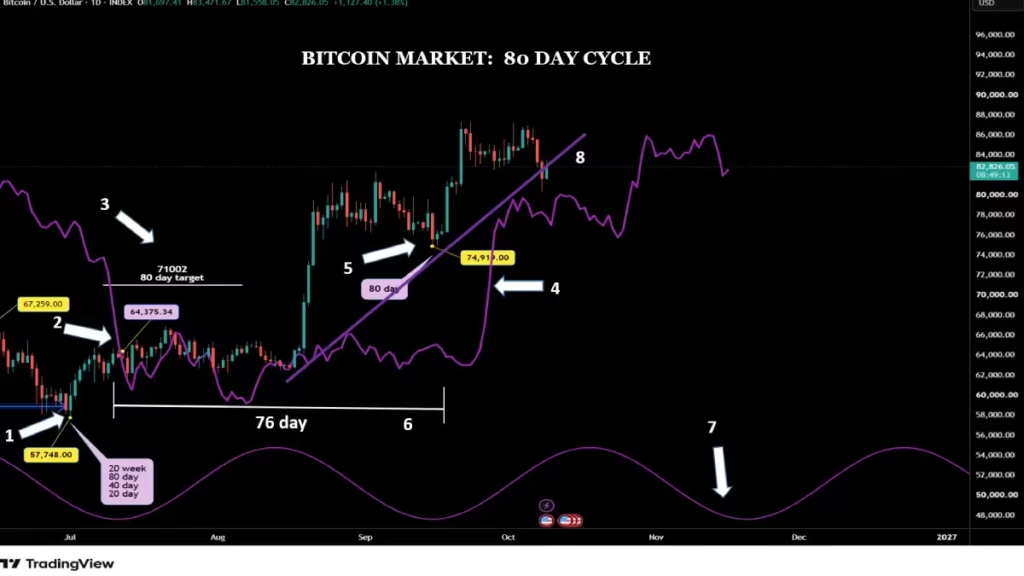
Following Hurst’s Synchronicity Rule, since the July 1 low (arrow 1) is at least a 20-week cycle low, it also serves as the low for the 80-day, 40-day, 20-day and 10-day cycles.
In fact, utilizing the 80-day cycle helps clarify where the 40-week cycle low occurred. After printing its 80-day low on July 1, Bitcoin crossed above its FLD (arrow 2) at $64,375, projecting a potential upside target of $71,002(arrow 3) (a gain of $6,627 or 10.29%). This target was reached on August 20, 2026, with a daily high of $73,386.
Technically, after forming a 20-week cycle low, the first subsequent 80-day cycle low should form on its FLD (arrow 4). With a low of $74,919 recorded on September 15 (arrow 5), Bitcoin formed its trough well above its FLD, which is typically a bullish indicator.
From the July 1 low to the September 15 low (arrow 6), this 80-day cycle lasted 76 days, compared to the standard average of 68 days under the Hurst Nominal Model.
The next 80-day cycle low is projected to form around November 12 (arrow 7), and we can expect Bitcoin to form this low below its cycle line or FLD, establishing a temporary downside target.
Once the September 15 low was confirmed, I drew the 80-day VTL (arrow 8); this Hurst tool is vital for confirming cycle trend changes.
The 40 Day Cycle.
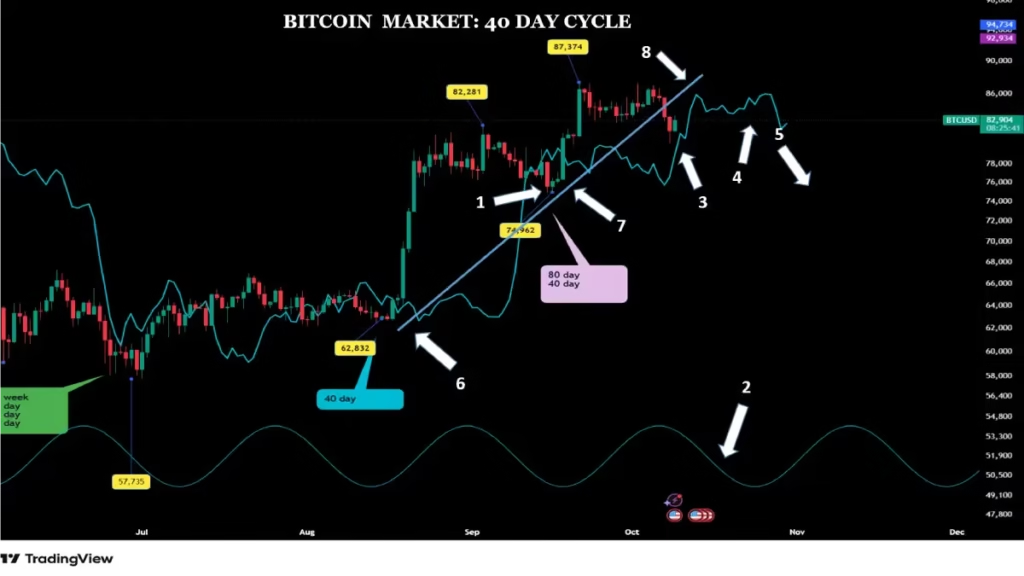
The last 40-day cycle low formed on September 15 (arrow 1).
Since this low, 24 days have elapsed. To form the next 40-day cycle low, we need approximately 10 more days, which gives us October 19 (arrow 2) as the potential date for the next 40-day cycle low.
During the formation of the next 40-day cycle low, we can expect the Bitcoin market to cross below its FLD (arrow 3), providing a short-term downside target.
After meeting its target, Bitcoin should rebound toward its cycle line (FLD) (arrow 4), using it as resistance without crossing above, before resuming its decline to form the last 40-day cycle low for this move (arrow 5).
From the August 14 low (arrow 6) to the recent 40-day cycle low on September 15 (arrow 7), I have drawn the 40-day cycle VTL (arrow 8).
This VTL will provide us with crucial information: when Bitcoin crosses below it, this will confirm that not only has the 40-day cycle peak formed, but the 80-day cycle peak has also formed or is currently in formation.
Conclusion
Understanding how overlapping cycles interact is critical for navigating Bitcoin’s market structure. As we approach key inflection points projected for November 2026 and August 2027, tracking price interaction with FLD levels and VTL trend lines will provide the definitive signals needed to confirm major trend direction. Stay tuned for our upcoming updates as these critical cycle lows develop.
Discover more from tradingmarketcycles
Subscribe to get the latest posts sent to your email.