
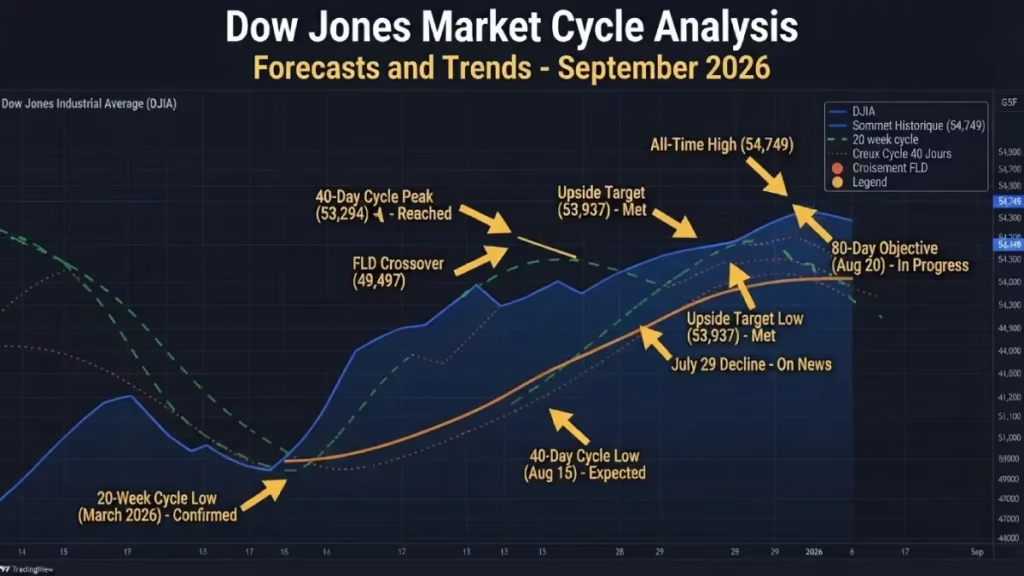
Dow Jones Industrial Average Cycle Analysis: August 24, 2026 Outlook
Introduction
Welcome to this week’s comprehensive financial market breakdown. As we navigate the complexities of current market trends, this week I will start with the Weekly Cycles. If you need more information about the longer Cycles, I strongly recommend consulting my previous update to fully grasp the broader macroeconomic and structural picture.
Market cycles provide traders with a reliable roadmap, helping us anticipate major shifts before they happen. Today, we will examine the intricate behaviors of practical market data through the lens of Hurst’s nominal model, analyzing critical timeframes ranging from multi-month cycles down to short-term fluctuations.
By understanding these underlying rhythms, traders can better position themselves for upcoming market moves, manage risk effectively, and identify high-probability trading zones. Let us dive deep into the data and uncover what the current cycle alignments mean for your portfolio this week.
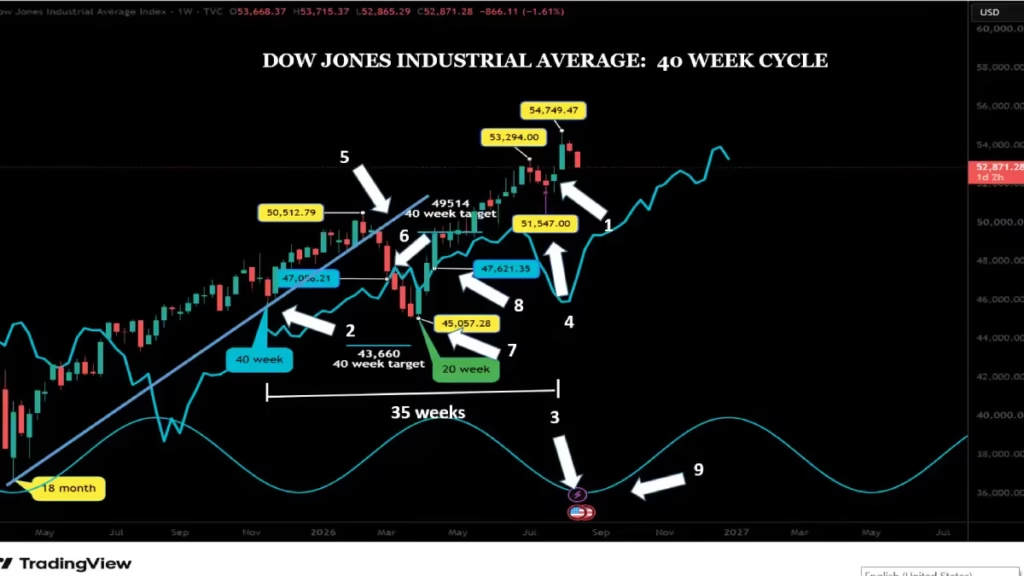
The 40-week cycle.
My last update was right here on the week of August 3, 2026 (arrow 1). During this update, I mentioned that if the last 40-week cycle low truly formed during the third week of November 2025,(arrow 2) then we have an expectation for the next 40-week cycle low to form in the middle of August (arrow 3). On July 29 (arrow 4), the Dow Jones Industrial Average formed a 51,547 low; this low occurred 35 weeks after the November 2025 low.
Is July low the expected 40-week cycle low? A 35-week duration since the last 40 week cycle, for a 40-week cycle is only 4.5 weeks shorter than the standard 40-week length on the Hurst nominal model. Indeed. Since a low occurred after crossing below the 40-week VTL (arrow 5) and FLD (arrow 6), there is a very high probability the March low (arrow 7) was indeed the 40-week low. Crossing back above its cycle line (arrow 8) during the first week of April usually confirms that the previous low was at least a 40-week cycle low. If this analysis is correct, this low will also serve as the 18-month low expected between August and September.
During the same update, I mentioned the possibility of a misplacement of the first 40-week cycle low since the major April 2025 low. Instead of being in November 2025, the most probable alternative date was in March 2026, which would project the next low into November 2026 (arrow 9).
This possibility remains valid, but it is very unlikely because it would make the 40-week cycle 51 weeks long, which is exceptionally long, though not entirely impossible. For now, my primary scenario—stating that the 40-week cycle low has already formed—remains my favorite and most probable outlook. For short-term traders, knowing whether the 40-week cycle has formed or is still to come is not primordial since we use FLD crossovers to enter or exit trades. However, knowing where the 40-week cycle formed provides vital insight into the strength of the next move.
The 20-week cycle.
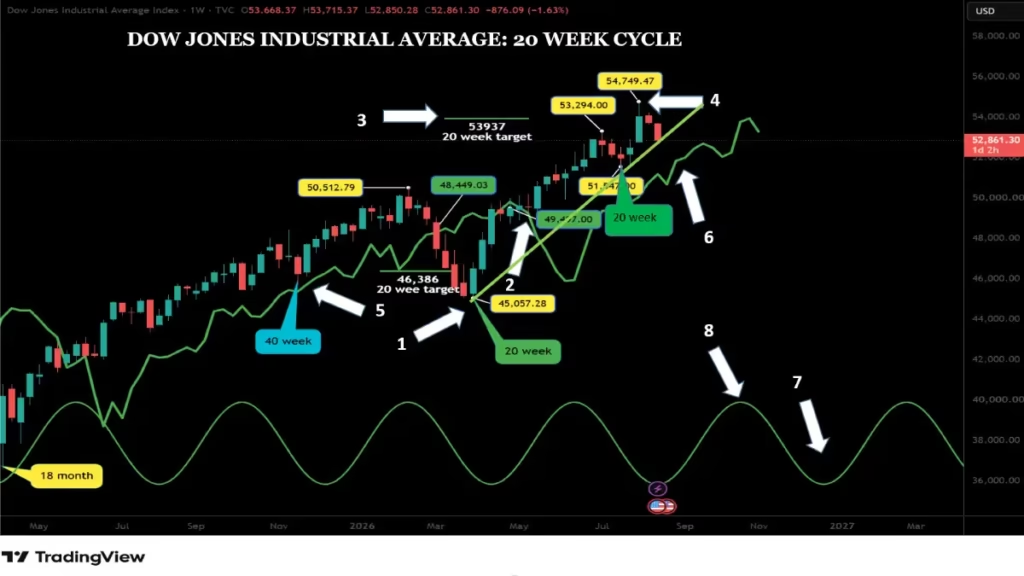
During the same update, the 20-week cycle clarified the situation. Indeed, by using the Hurst synchronicity rule, we were able to identify with certitude the 20-week cycle low position in March 2026 (arrow 1). We obtained a second confirmation of this low formation when the Dow Jones Industrial Average crossed above its cycle line, or FLD, at 49,497(arrow 2), providing 53,937 (arrow 3) as a potential upside target.
With a new all-time high of 54,749 (arrow 4), the Dow Jones Industrial Average met and exceeded this target. At the time of the last publication, the high was off by 643 points below the target. Since the last 20-week low in November 2026 (arrow 5), exactly 18 weeks have passed—just 1.5 weeks shorter than the 19.5-week average length on the Hurst nominal model. Thus, with a very high degree of confidence, we can label the March 2026 low as a 20-week cycle.
What is next for the 20-week cycle? We have to monitor the Dow Jones Industrial Average’s reaction when it approaches its FLD (arrow 6) during the formation of the next 20-week low. In a balanced market, the Dow Jones should cross below its FLD, providing a downside target. This will be the second 20-week cycle since the March low, and per the rule of synchronicity, it will also coincide with a 40-week cycle low.
In this case, we can expect the Dow Jones Industrial Average, after crossing below its 20-week FLD, to decline and find support on its 40-week FLD. In the event that the 18-month cycle low is still ahead of us, the Dow Jones must also cross below its 20-week FLD; therefore, in both scenarios, we can expect a correction.
To trade the current 20-week cycle of the Dow Jones Industrial Average, traders should build a roadmap using the 40-day FLD. Since the Dow Jones crossed above its FLD, we know the market should trend upward for a few weeks. The next 20-week cycle low is expected during the second week of November (arrow 7), and the peak can be expected between the third and last week of September (arrow 8). When the 20-week cycle low was confirmed, I drew the 20-week VTL from the March low to the July low (the green trend-line). This VTL is a very important tool, as it will give us an early signal when the potential 40-week cycle peak has formed or is forming.
Now let’s examine the 80-day cycle.
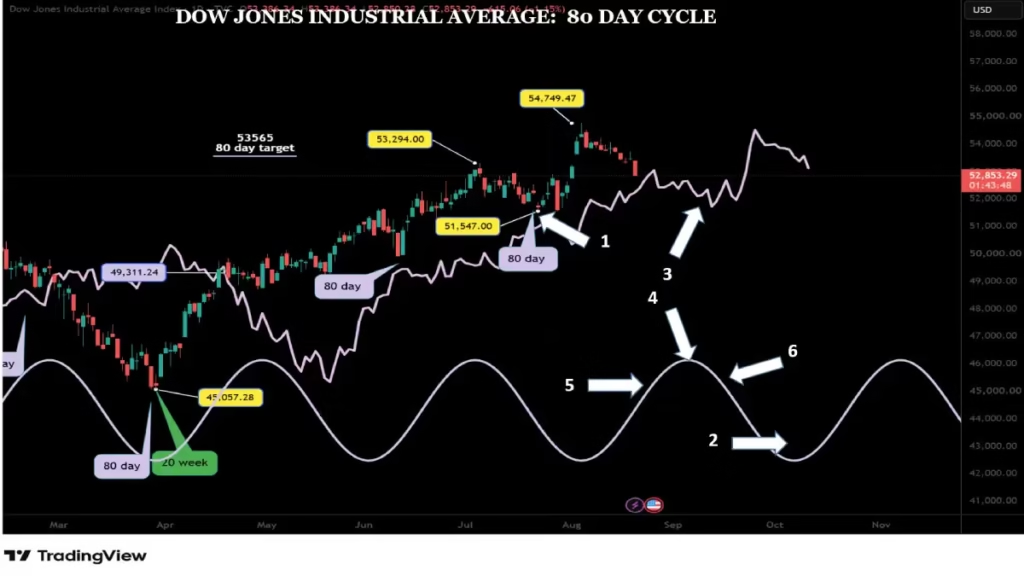
If the July 29 low (arrow 1) was a 20-week low, and according to the Hurst rule of synchronicity, this low was also an 80-day low. Using the Hurst 80-day cycle average length from the nominal model, which is 68 days, we can expect the next cycle low to form on October 5, 2026 (arrow 2). The next 80-day low should form below its 80-day FLD (arrow 3), providing a potential downside target. The peak can be expected around September 1 (arrow 4).
The July 29th 80-day cycle lasted 49 days, which is very short for an 80-day cycle. Lately, it seems the cycles are running shorter, which is typical in a bull market. Remember the 80-day average length on the Hurst nominal model is 68 days. How do we find out if the 80-day low is already in place or still to come by the end of this month? We have to build a roadmap with a 20-day FLD. I will cover that during the 20-day cycle analysis.
When the next 80-day cycle low has formed and confirmed, I will draw the 80-day cycle VTL (Valid Trend Line). When the Dow Jones Industrial Average crosses below it, according to Hurst’s rules, this will confirm that the 80-day peak has formed, and more importantly, that the next 20-week cycle peak is established.
This information will be vital to gauge the severity of the next correction. Furthermore, where the peak of the next 80-day cycle forms relative to the crest of the cycle is extremely important. Hurst calls this time translation: if we have a left-hand time translation—meaning the peak occurs on the left side of the cycle (arrow 5)—we can expect a sharp correction. Conversely, if we have a right translation, where the peak occurs on the right side of the cycle after the crest, (arrow 6) we can anticipate a moderate correction. This will be invaluable information.
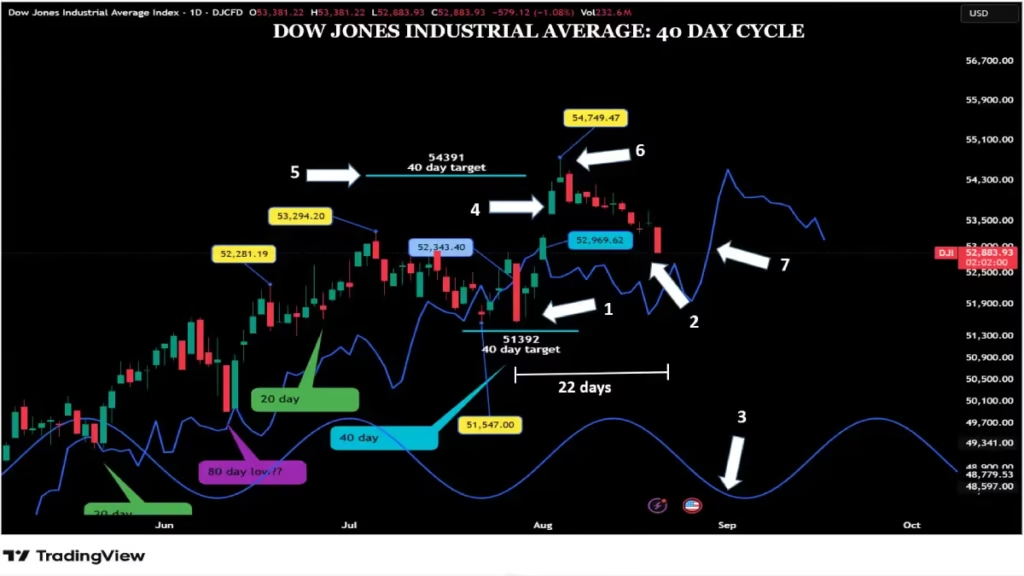
The 40-day cycle.
From the July 29 low (arrow 1) up to Thursday, August 20 ( arrow 2), only 22 days have elapsed. We need about 12 more days to complete this 40-day cycle, which is expected to form on September 1st (arrow 3). The last trading signal for the 40-day cycle occurred on August 4 when the Dow Jones Industrial Average crossed above its FLD at 52,969 (arrow 4), providing a 54,391 (arrow 5) potential upside target.
The next day, (arrow 6) the Dow Jones Industrial Average reached a new all-time high of 54,749, meeting and slightly exceeding its upside target. Since making this all-time high, the Dow Jones has started its correction on its way to his 40-day cycle low. If this is the first 40-day cycle since the July 20-week cycle, then we can expect the Dow Jones to find support on its FLD (arrow 7), which will be around 52,000 to 53,000. If the Dow Jones drops sharply and decisively below its cycle line, this could be bearish for the ensuing trend and elevate the possibility that the 18-month cycle low is still ahead of us. Remember, originally, the 18-month cycle low was expected to form between August and September.
The 20 Day Cycle.
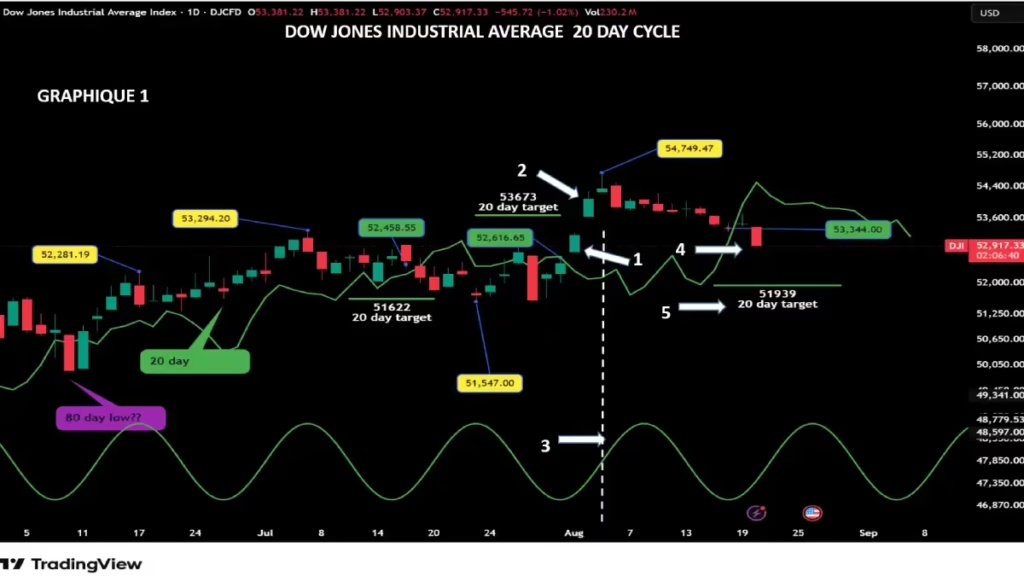
Graphique 1:
On August 3 (arrow 1)the 20 day cycle provided a potential upside target at 53,673 or 1063 points. The next day (arrow 2) the Dow Jones met his target with a 54,278 daily high before making 54,749 new all-time high. This was the 20 day peak, the peak formed on the left part of the cycle crest (arrow 3), Hurst call that a left time translation.
What are the implication for the Dow Jones industrial? usually when we have a left time translation this is mean the market losing steam, and we can expect a sharp correction of course the correction size is relative to the degree of the cycle. On Thursday (arrow 4) the Dow Jones Industrial Average closed below his cycle line at 53,344 providing a 51,939 downside target (arrow 5) or 1405 point decline. Why our very short term is not very bullish? it is because after a formation of at least an 80 day cycle, the first 20 day low should find support on his FLD. And this 20 day low was expected to form on August 15.
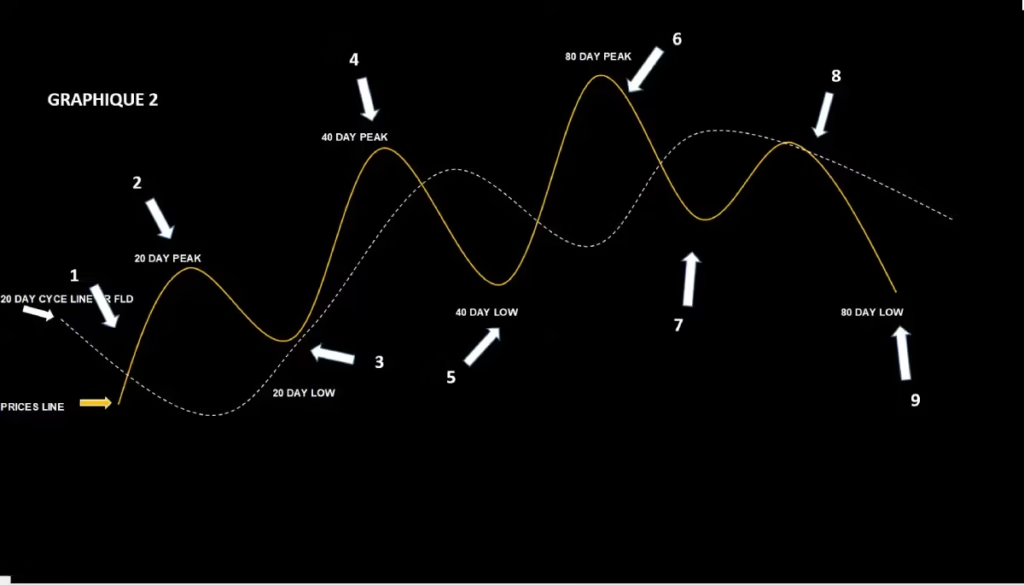
Graghique 2
its the roadmap for the 80 day cycle, as reminder for the 80 day cycle we have to use the 20 day FLD, this week I would like to show how the roadmap can be use directly on the chart.
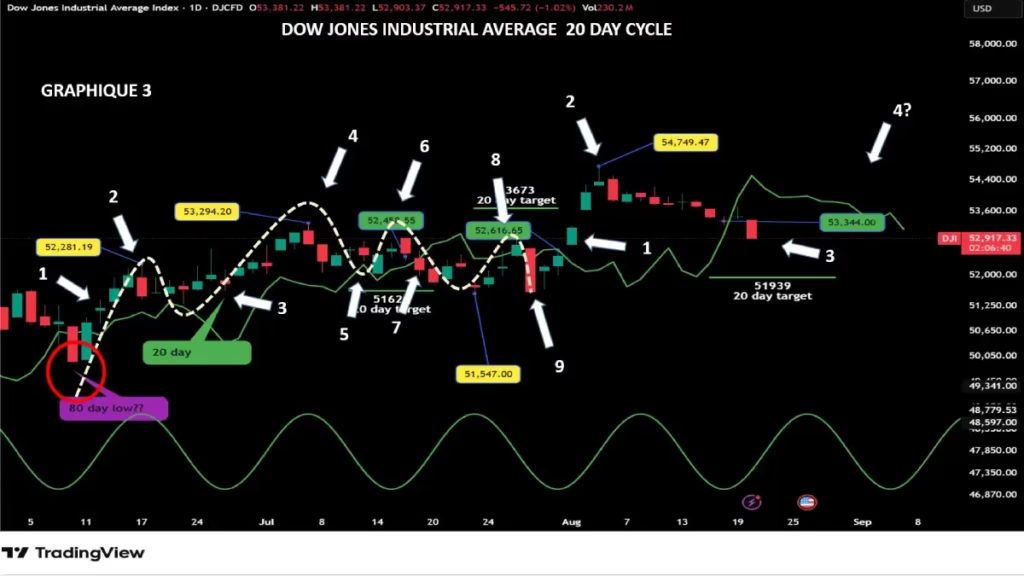
Let move to graphique 3, I placed the roadmap on the top of the Dow Jones Industrial Average chart, and we are going through the sequence together.
Graphique 3
I am going to do the Devil’s advocate
let’s say as a trader, I am uncertain about where to place the second 80 day low since the March 26 low, is it on July 29 ? Which will also be the 20 week cycle low or the second 80 day is still to come.
Let go back to the low of the June, the last 80 day’s low, the red dashed circle on graphique 3 and let use the roadmap as guideline. After an 80 day low the market should cross above his cycle line providing an upside target.
As expected the the Dow Jones Industrial Average crossed above his FLD at 50,650 for a 51,387 target,
After forming its 20-day peak at 52,281, (arrow 2) the Dow Jones Industrial Average corrected on its way to its 20-day low, which was expected to form on June 27. On June 28, the market formed its low well above its cycle line (arrow 3), which usually is a bullish sign. This 20-day cycle was 16 days long.
From there, we expect the market to rebound on its way to form its 40-day cycle peak (arrow 4), on July 7 with a 53,294 high, the market made its 40-day peak; note that the peak occurred right on the crest of the cycle.
Following our roadmap, after the 40-day peak, we expect the market to cross below its FLD, providing a downside target and forming its 40-day low on July 14.
On July 14, the market was so strong that it formed its 40-day cycle low on its cycle line at 52,508. The market formed its low right on the expected date (arrow 5). This 40-day cycle was exactly 34 days long, following the Hurst nominal model perfectly.
After forming its 40-day low, the market rebounded to form the 80-day peak (arrow 6). There, it crossed below its FLD as expected (arrow 7), then as usual rebounded and used its FLD or cycle line as resistance (arrow 8), before heading to its 80-day low on July 29 (arrow 9).
The only problem with this analysis is that the 80-day cycle was 49 days long—19 days shorter than the 68-day average on the Hurst nominal model. If July 29 is the 20-week low, it is very possible, since the 20-week is a major cycle.
Is there an alternative analysis to fit the Hurst nominal model? Yes, 68 days from June 10 is August 17
.
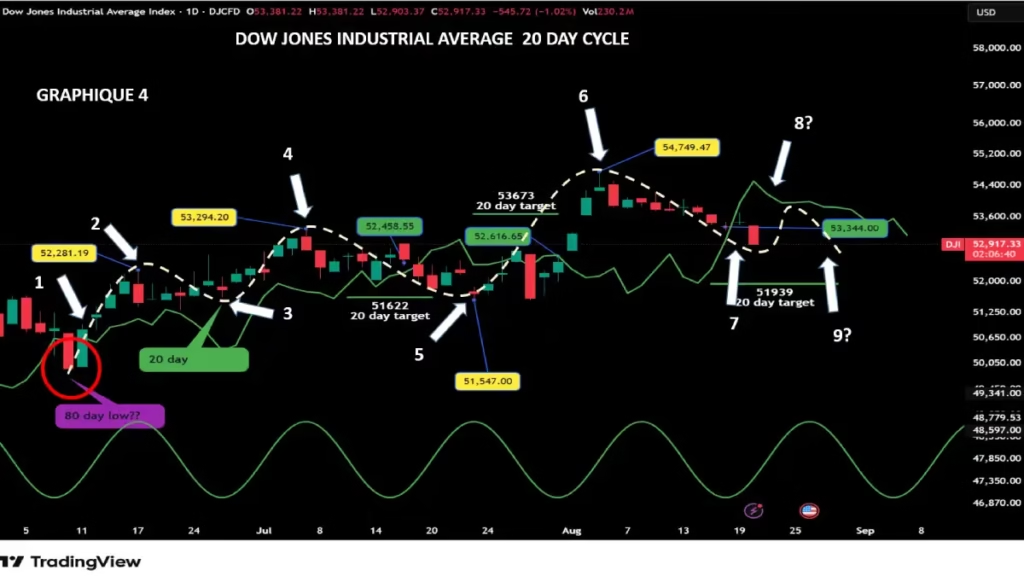
On Graph 4,
There is an alternative analysis, still using the roadmap until the peak of the 40-day cycle the analysis remains the same up to that point; where the analysis changes is where the 40-day cycle low forms, which in this analysis will be on July 22 (arrow 5) after crossing below its cycle line .
After forming the 40-day low, the market should rebound and cross above its FLD (arrow 6), providing an upside target, which is exactly what happened on August 3.
What about the July 29 decline? It was certainly due to some news.
After meeting its target and forming a new all-time high of 54,749, the the Dow Jones Industrial Average crossed back below its cycle line (arrow 7), providing a downside target to the 80-day cycle low. Until Thursday, August 20, the 80-day cycle is exactly 71 days long, which fits better with the Hurst nominal model.
How do we know which analysis is the correct one?
If this week the Dow Jones Industrial Average rebounds sharply and crosses clearly above its FLD, then we will prefer the second analysis, which places the 80-day and 20-week cycle low on August 20.
If the market continues to decline without crossing above its FLD at the beginning of the week, then there is a very high probability that the first analysis is the correct one, and this will raise the possibility that the 18-month cycle is still to come, bringing possibly more decline ahead.
Conclusion
As we wrap up this week’s technical market analysis, it is clear that the Dow Jones Industrial Average is at a critical juncture across multiple cycle degrees. The alignment between the 40-week, 20-week, 80-day, and 40-day cycles demands heightened vigilance from all traders operating in the current financial environment.
While the overall macro trend remains robust, approaching cycle lows and potential corrections mean risk management must remain your top priority. By closely monitoring the interaction between price action and future lines of demarcation, such as the 40-day and 20-week FLDs, you can successfully navigate upcoming market volatility rather than react to it emotionally.
Keep a close eye on the key dates and price targets discussed in this report as we approach the beginning of September. Stay disciplined, follow your established trading roadmap, and prepare for high-probability setups as the market unfolds its next major cyclical phase.
Discover more from tradingmarketcycles
Subscribe to get the latest posts sent to your email.