

Weekly Market Cycle Analysis: S&P 500, Gold, and Bitcoin Targets
Introduction
Welcome back to our comprehensive weekly market briefing.
In this detailed update for June 29, 2026, we will provide an in-depth cycle analysis for the S&P 500, Gold, and Bitcoin markets.
By utilizing the proven principles of the Hurst nominal model, we break down complex market movements into actionable data points for retail and professional traders alike.
Our analysis tracks key tracking metrics, including the Future Line of Demarcation (FLD) interactions, to uncover high-probability setups across multiple timeframes. This week, we examine how the major indices are behaving relative to their historical cyclical patterns, helping you stay ahead of impending trend reversals and major support or resistance zones.
Whether you are monitoring the resilient equity indexes or navigating the highly volatile cryptocurrency spaces, understanding these synchronized structural waves provides a significant edge in your trading strategy. Let us begin our deep dive into the charts.
The S&P 500 Market Analysis
Let us start with the S&P 500.
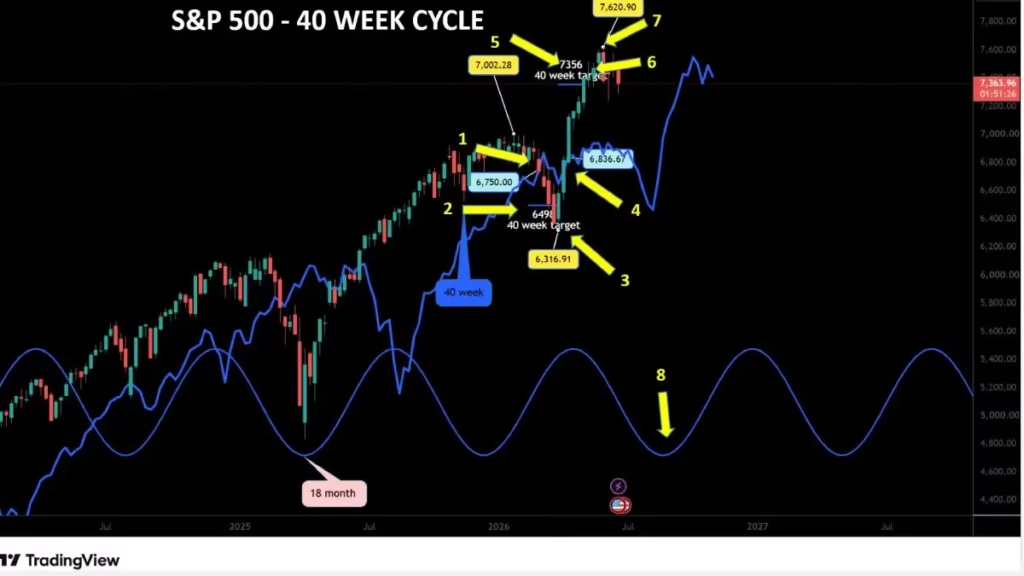
We will begin this S&P 500 analysis by looking at the 40-week cycle. During my last update on March 16, the S&P 500 crossed its cycle line at 6,750, (arrow 1) providing a potential downside target of 6,498 (arrow 2) for the 40-week cycle.
On March 30, the S&P 500 formed a low at 6,316 (arrow 3), meeting and even exceeding this target. After forming this low during the first week of April, the market crossed back above its cycle line at 6,836 (arrow 4), providing a potential upside target of 7,356 (arrow 5).
This represented 520 points, or a 7.60% potential profit. During the first week of May (arrow 6), just a month later, the market met its target and kept moving up until forming a new all-time high at 7,620.90 on June 2(arrow 7).
The next 40-week cycle low is expected in mid-August (arrow 8).
Since the beginning of the year, with two positive signals out of two, the 40-week cycle maintains a 100% success rate.
The 20-Week Cycle
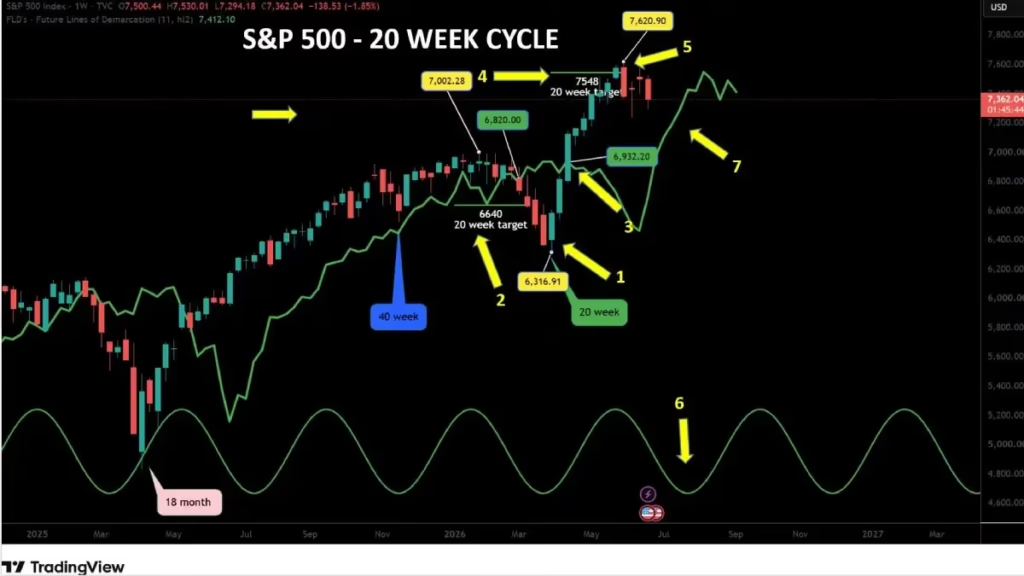
The March low of 6,316.91 (arrow 1) marked the conclusion of the last 20-week cycle.
During my previous update, I expected the market to continue its decline until the last week of March or the first week of April, where the next 20-week cycle low should form. Indeed, the S&P 500 formed its low exactly on March 30, showcasing perfect timing, and the index even exceeded its 6,640 target (arrow 2).
After forming this low, the S&P 500 rebounded and crossed back above its cycle line at 6,932 in mid-April (arrow 3), establishing a potential upside target of 7,548 (arrow 4). This move offered 616 points, or almost a 9% potential profit. With a new all-time high of 7,620.90 achieved on June 2 (arrow 5), the S&P 500 met and exceeded its target.
What is next for the 20-week cycle?
We can expect the next 20-week cycle to form its low during the second week of August (arrow 6). Due to the Hurst rule of synchronicity, this will also coincide with at least a 40-week cycle low.
During the formation of this upcoming low, the S&P 500 should cross below its cycle line (arrow 7), which will provide a new potential downside target.
With two positive trading signals out of two, the S&P 500 holds a 100% success rate.
The 80-Day Cycle
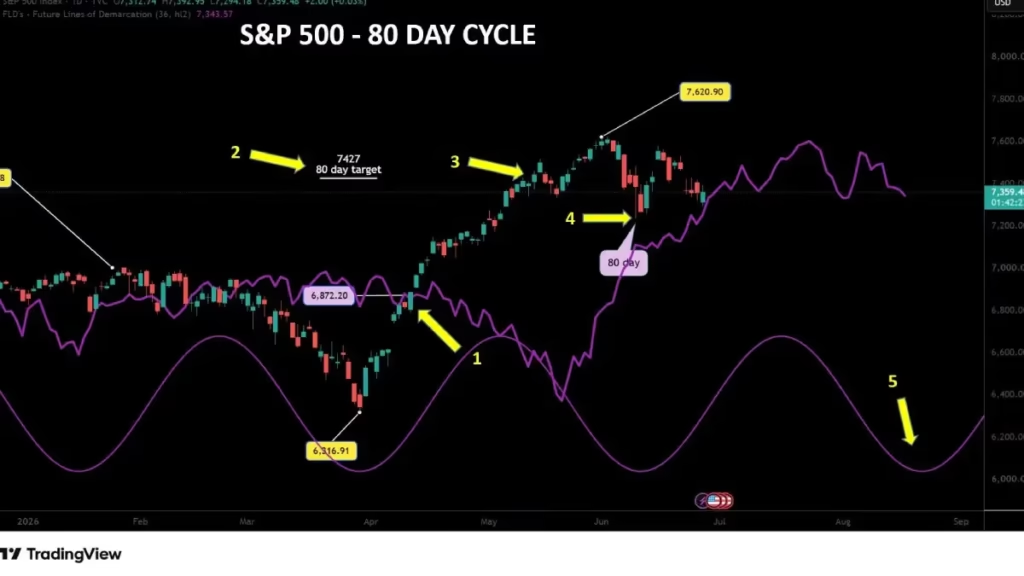
In March, I was expecting the S&P 500 to climb back above its cycle line after its low formation to provide a new upside target. On April 14, the S&P 500 crossed above its cycle line at 6,872, (arrow 1) offering a 7,427 upside target (arrow 2), which translated to 555 points or an 8% potential profit. This target was met on May 11(arrow 3), about one month later, locking in that 8% profit.
Then, after 71 days, the S&P 500 formed its 80-day low on June 9 (arrow 4). As a reminder, the average length in the Hurst nominal model is 68 days.
During the next 80-day low formation expected around August 16 (arrow 5), the market should cross below its cycle line, providing a new downside target.
Since January, the 80-day cycle has provided two positive trading signals out of two, maintaining its 100% success rate.
The 40-Day Cycle
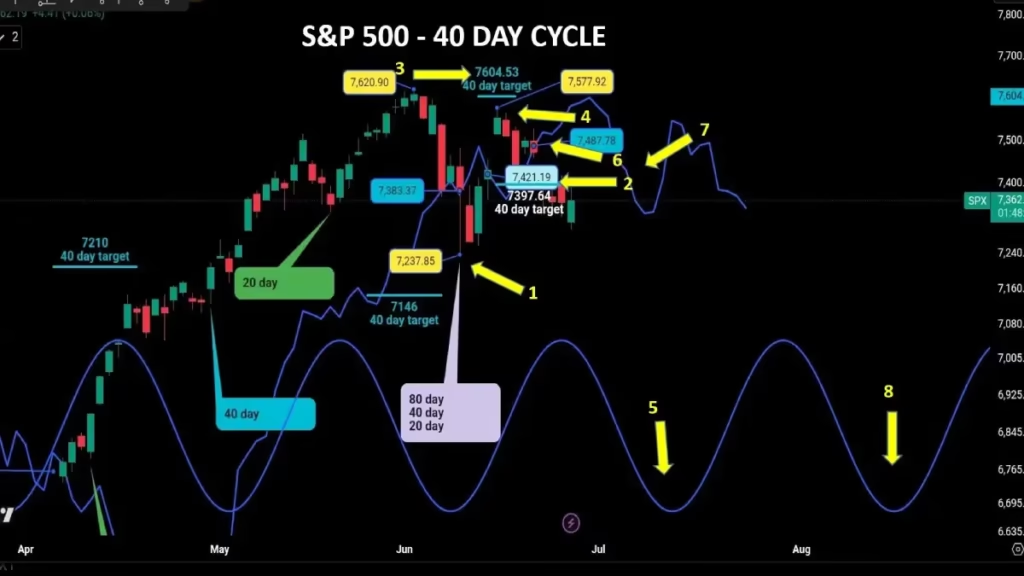
June 9 marked the most recent 40-day cycle low (arrow 1). After forming this low, the S&P 500 crossed back above its cycle line at 7,421.19 on June 12 (arrow 2), aiming for a 7,604 potential upside target (arrow 3).
The next day, after opening with an upward gap, the S&P 500 formed a high at 7,577.92 (arrow 4). This was just 27 points, or 0.35%, below its original target. Because the high formed well within the 1% margin of error, the target is officially considered met.
The next 40-day low is expected to form around July 13 (arrow 5). During this upcoming low formation, the market cross below its cycle line, or FLD, at 7,487 (arrow 6) providing a new downside target, met the next day.
Afterward, in a balanced market, the S&P 500 should rebound toward its cycle line without crossing above it (arrow 7), treating it as resistance before resuming its decline. This will form the last 40-day cycle of this current 20-week cycle, which should conclude around mid-August (arrow 8).
With four positive signals out of five since the beginning of the year, the 40-day cycle maintains an 80% success rate.
The Gold Market Analysis
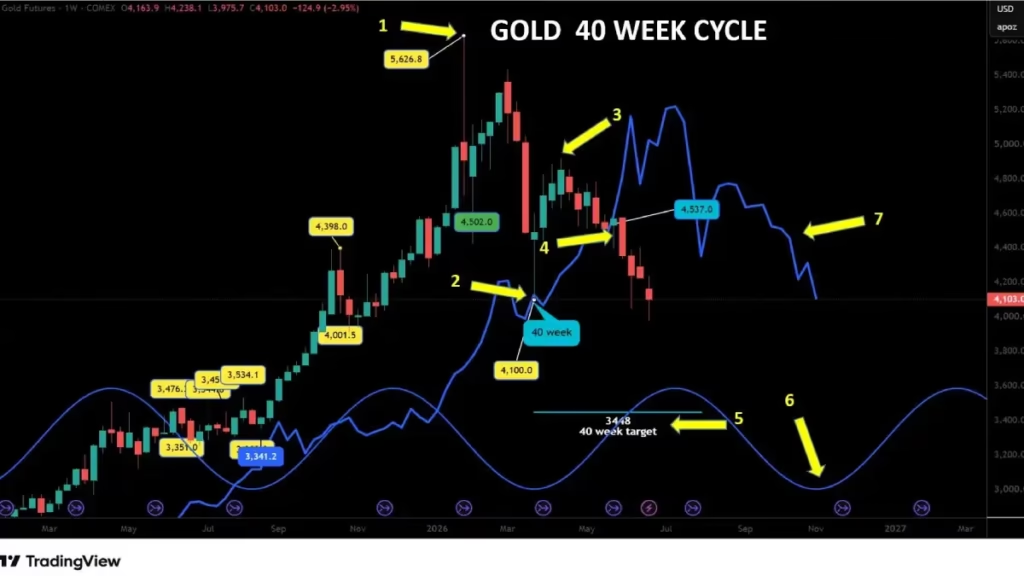
For the gold market, the $5,626.80 January high (arrow 1) is definitively a very long-term peak. This is probably the 18-year cycle peak, which officially drags the gold market into a secular bear market. Having said that, let us look at the shorter cycles to identify the nearest trading opportunities.
The 40-Week Cycle
During my last weekly update on March 22, I was expecting the gold market to form its 40-week low during the first two weeks of March and to find firm support on its cycle line, or FLD.
In fact, the gold market formed its low on March 23 (arrow 2), right on its FLD. The gold market then rebounded for three weeks (arrow 3) before continuing its broader decline. During this drop, the gold market crossed below its cycle line during the last week of May at $4,537 (arrow 4), providing a target of $3,448 (arrow 5). This offers a potential profit of $1,089, or 24%.
The next 40-week cycle low is expected to form during the second week of November (arrow 6). The May crossover represents the first major trading signal since the beginning of the year.
The $3,448 target remains completely valid until the gold market crosses back above its cycle line (arrow 7) without meeting it. A cross back above would invalidate this downside target, but for now, due to the heavy bearishness in the gold market, there is a very high probability this target will be reached.
The 20-Week Cycle
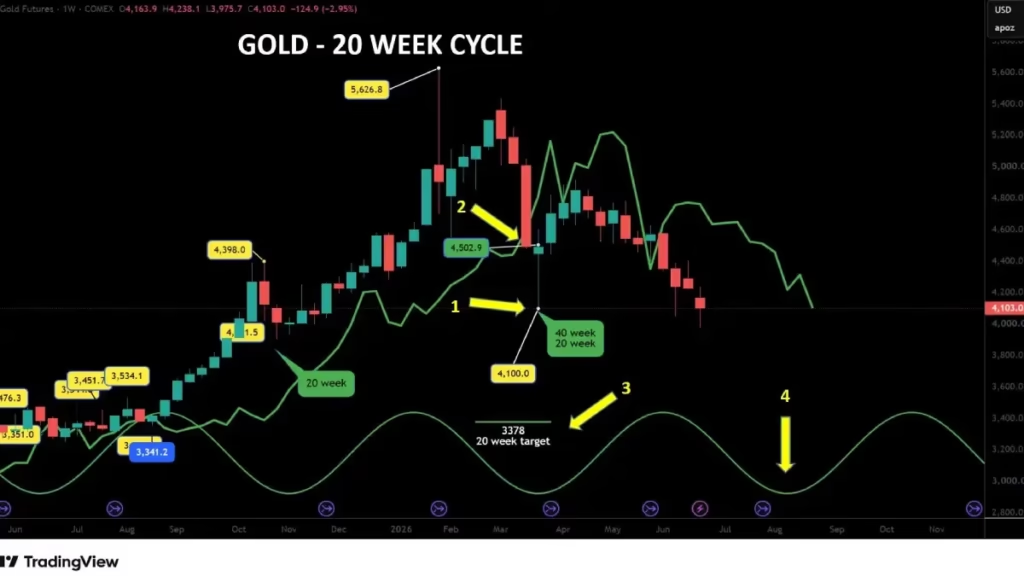
The last 20-week cycle lasted 21 weeks, which is about 1.5 weeks longer than the 19.48-week average found in the Hurst nominal model.
During the formation of the $4,100 March low (arrow 1), the gold market crossed below its cycle line, or FLD, at $4,502 (arrow 2).
This action provided a downside target of $3,378 (arrow 3), representing a potential decline of $1,124 or almost 25%.
The next 20-week low is expected to form during the first week of August (arrow 4).
The 80-Day Cycle
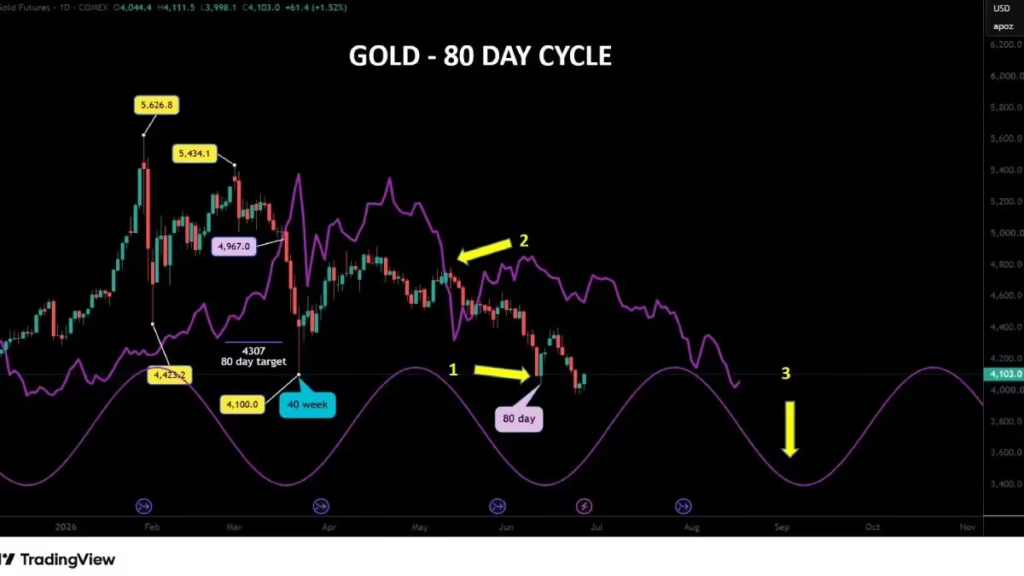
The most accurate place to label the last 80-day cycle low is certainly June 11 (arrow 1).
If this analysis is correct, this specific 80-day cycle lasted exactly 80 days. In the Hurst nominal model, the average length is 68 days, but since the gold market is stuck in a strong bearish trend, an extended 80-day cycle is absolutely possible.
What is next?
In a balanced market following the March 40-week low formation, the market was supposed to cross back above its cycle line (arrow 2) to provide a new upside target. However, the gold market failed to cross clearly above its cycle line. This failure means we are still dealing with an immense amount of bearish momentum in the gold market, so we can expect further declines toward at least our weekly targets.
Using June 11 as the definitive last 80-day low, the next 80-day low should form between August 15 and August 31 (arrow 3).
Since the beginning of 2026, with one positive trading signal out of one, the 80-day cycle holds a 100% success rate.
The Bitcoin Market Analysis
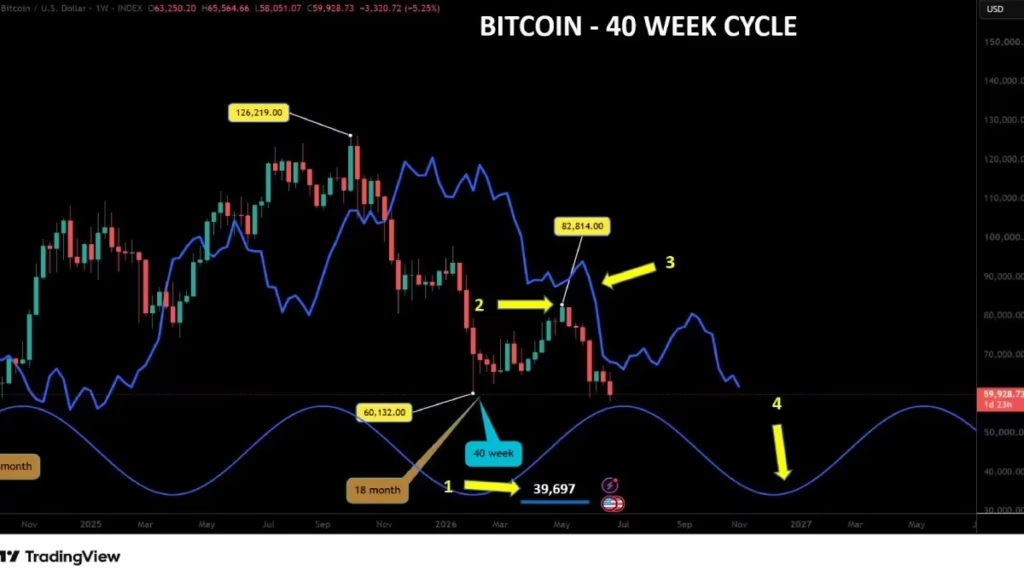
During the January 2026 decline, Bitcoin triggered and validated a downside target of $39,697 (arrow 1).
The 40-Week Cycle
During my last Bitcoin market update, I expected the price to establish its 40-week peak around May. On May 6 (arrow 2), Bitcoin formed a high at $82,814. This high could very well be the official 40-week cycle peak. If that is correct, the peak occurred right on our projected time target. Additionally, during that same update, I was expecting the peak to find resistance on its cycle line (the blue line) (arrow 3).
The peak formed remarkably close to its cycle line, or FLD, exactly as anticipated. The next 40-week cycle low should form during the first week of November (arrow 4).
.
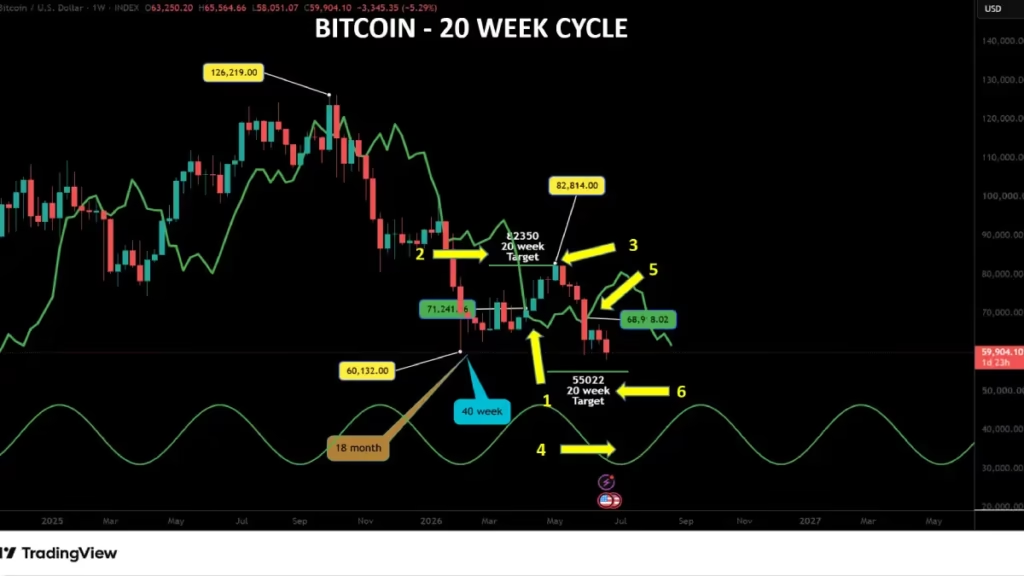
The 20-Week Cycle
In April, by crossing above its 20-week cycle line (arrow 1), Bitcoin confirmed that the February low is at least a 20-week cycle low.
This also confirmed that the first scenario from my last update was the correct one.
The crossing at $71,241 in April provided an upside target of $82,350 (arrow 2). With a high of $82,814 on May 6 (arrow 3), Bitcoin perfectly met its $82,350 target.
Also, during that same update, I mentioned that I expected the current 20-week cycle low to form in the middle of June (arrow 4). That time has now arrived. However, since Bitcoin is currently operating in a broader bear market, and cycles have a tendency in bear markets to stretch longer than the Hurst nominal model averages, there is a distinct possibility Bitcoin forms its low this week or next week.
During the last week of May, Bitcoin crossed below its FLD at $68,918 (arrow 5), providing an active downside target of $55,022 (arrow 6).
With one positive trading signal this year, the 20-week cycle maintains a 100% success rate.
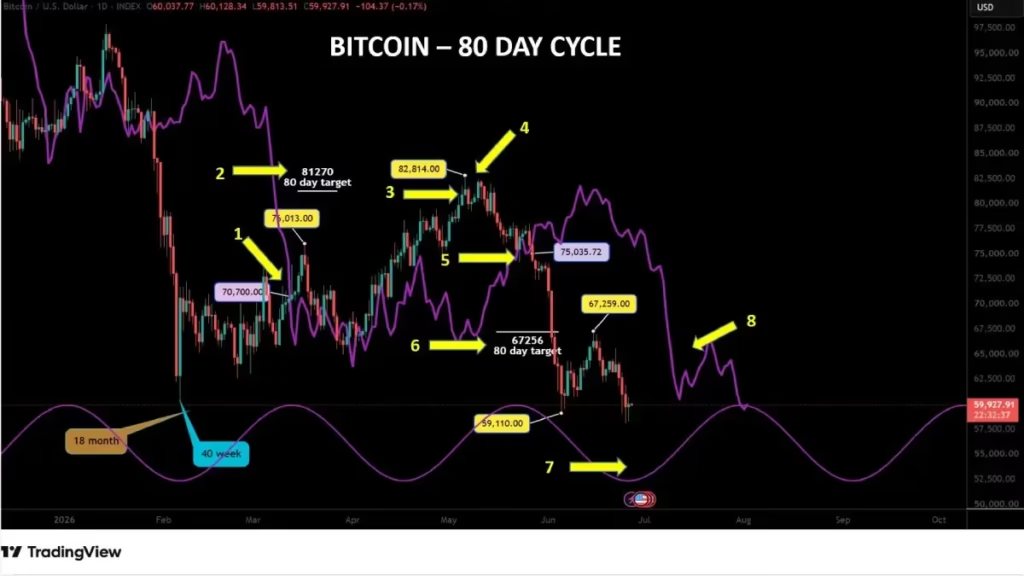
The 80-Day Cycle
The March 13 crossing (arrow 1) provided an upside target of $81,270 (arrow 2). On May 5, a high of $81,771 met this target (arrow 3). The very next day, Bitcoin made a final high of $82,814(arrow 4) before crossing back below its cycle line, or FLD, at the $75,035 mark (arrow 5).
This breakdown provided a downside target of $67,256 (arrow 6), and the Bitcoin market met this target just 6 days later.
We can expect the second 80-day cycle since the February low to form its bottom either this week or next week (arrow 7).
Since this second 80-day cycle will also represent the 20-week low according to the Hurst principle of synchronicity, we can expect the market to rebound after forming this low.
This should result in a cross back above its cycle line (arrow 8), providing a fresh, short-term upside target.
With three positive trading signals out of three, the 80-day cycle holds a perfect 100% success rate.
Conclusion
Our structural cycle analysis highlights vital inflection points arriving across all three major asset classes as we head into late summer.
The S&P 500 continues to display incredible historical consistency, boasting near-perfect success rates on its 40-week, 20-week, and 80-day trading signals, though a major synchronized nesting low awaits in August.
Conversely, Gold remains firmly locked in a secular bear market environment, where its inability to breach key FLD resistance confirms overwhelming downward momentum toward our structural targets.
Meanwhile, Bitcoin is testing the patience of crypto traders as it balances extended bear-market cycle lengths against highly accurate short-term FLD targets. By integrating these precise time and price windows into your risk management framework, you can anticipate upcoming market rotations rather than reacting to them. Stay disciplined, track the cycle line intersections closely, and join us next week for further technical updates.