

NIFTY 50 Cycle Analysis: Price Targets and Hurst Roadmap for April 2026
Introduction
Welcome back to our weekly market update for April 20, 2026. Due to high demand this week, we will dive into the NIFTY 50, which represents the Indian stock market. We begin our analysis with the long-term cycle, specifically the 18-month period.
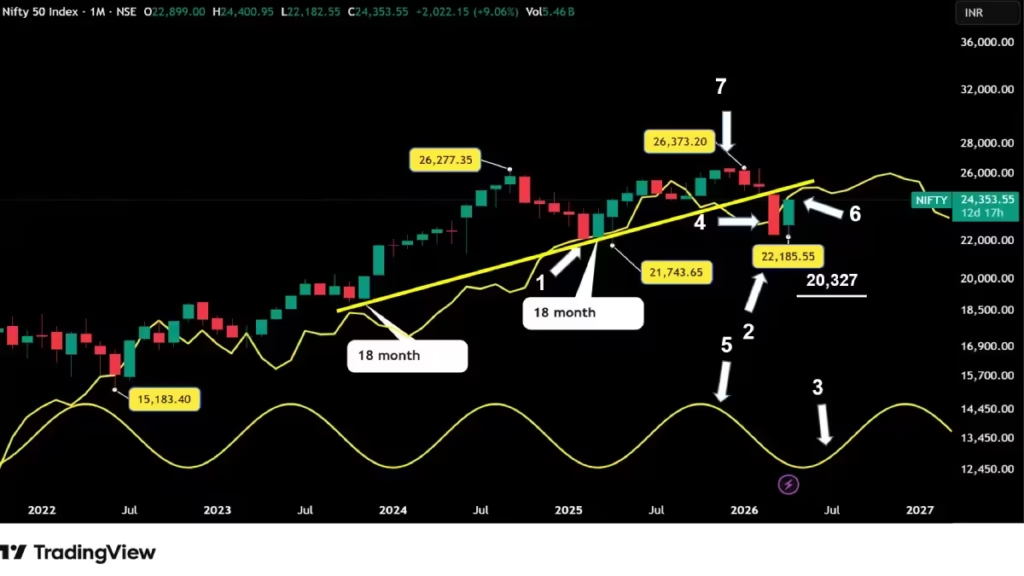
The 18 month cycle
In April 2025 (arrow 1), the Nifty 50 formed a major low, which was at least an 18-month cycle low and perhaps even a longer 54-month cycle low. However, for this discussion, let us focus only on the 18-month cycle.
Between the April 2025 low and last month’s low (arrow 2), 11 months have elapsed. 11 months is far too short for an 18-month cycle low to complete; therefore, we can expect this significant low to occur between September and October (arrow 3).
After forming a 26,393 all-time high in January of this year, the Nifty 50 crossed below its cycle line (arrow 4) at 23,350. The crossing below its 18-month cycle line, or FLD, provides two very important pieces of information.
First, the crossing confirms that the previous high before the crossing is at least an 18-month cycle peak. Second, it indicates that we have a potential downside target of 20,327. By forming its peak in January, the Nifty 50 hit its high right at the crest of the cycle, showing perfect timing (arrow 5).
Also, last month, the Nifty 50 crossed below its cycle trend line, or VTL (arrow 6). This is another very important detail. According to Hurst rules, when prices cross below the VTL, it confirms that a peak of the next longer cycle has formed—in this case, the 54-month peak.
To officially label the January peak (arrow 7) as a 54-month cycle peak, the Nifty 50 must continue trading below its VTL for at least two months. Now, let us move to the next shorter cycle, the 40-week cycle.
The 40-Week Cycle
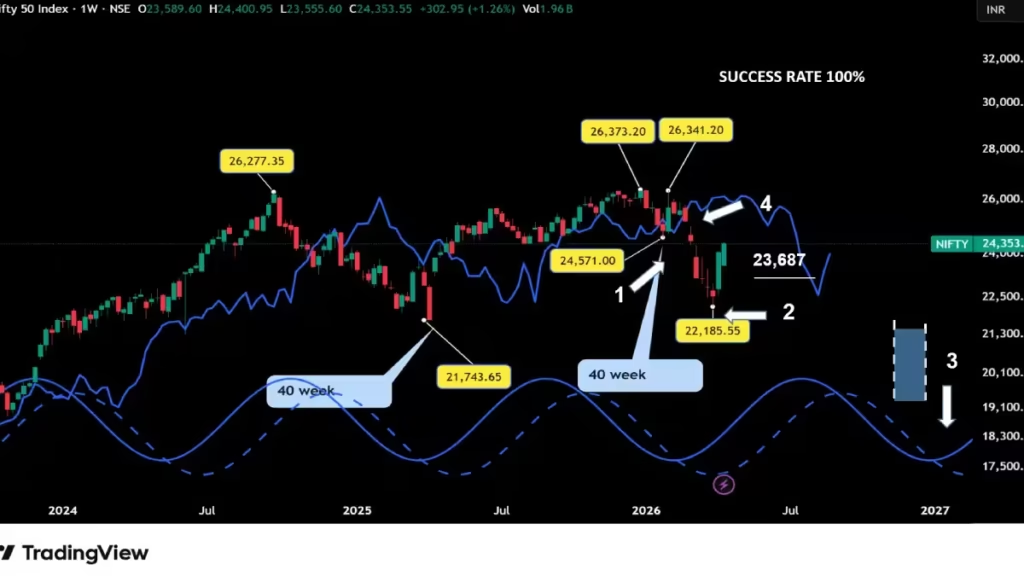
By placing the first 40-week cycle low since the April 2025 low at the end of January (arrow 1), the 40-week cycle measures 42 weeks long. This is only 3 weeks longer than the 38.97-week average from the Hurst nominal model.
There is another possible scenario: by placing the 40-week low in March (arrow 2), this cycle would be 51 weeks long. While 51 weeks is quite long—11 weeks longer than the nominal model—it is not impossible.
Due to the size of the correction following the all-time high, this scenario is very plausible, and we must keep this possibility in mind.
What is next for the 40-week cycle?
If the second 40-week cycle has the same length as the first one, we can expect the Nifty 50 to form its low during the third week of November. If the market matches the Hurst nominal model, then we can expect the low during the first week of November. The overall time zone is during the first three weeks of November (the blue zone).
If we place the last 40-week cycle low in March, we can expect the next low to form by the end of December (arrow 3).
How can we solve this problem?
We should be able to resolve it by analyzing the shorter cycles, especially the 80-day cycle. During the first week of March, the Nifty 50 crossed below its cycle line (arrow 4) at 25,030, providing a 23,687 potential downside target. The week after, the market met its target. This was the first trading signal of the year.
With 1 successful signal out of 1, the 40-week cycle currently has a success rate of 100%.
The 20-Week Cycle
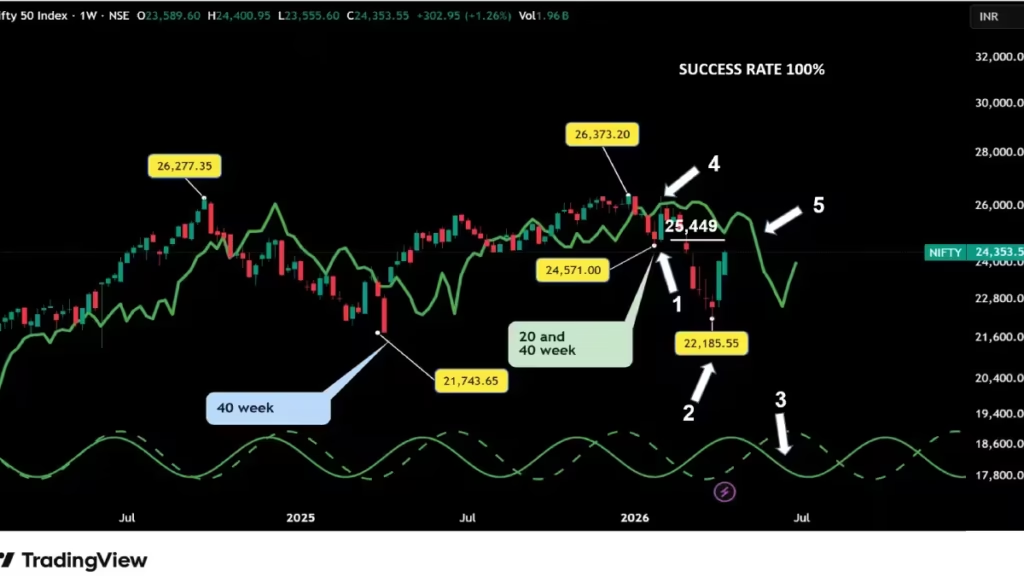
Due to the Hurst rule of synchronicity, the last 20-week cycle formed at the same time as the 40-week cycle at the end of January (arrow 1) or in March (arrow 2). Since we are currently uncertain where to place the 40-week low, we have the same issue with this 20-week cycle since it is synchronized with the 40-week.
Every 6 cycles, I process a new spectral analysis to update the cycle length. For the 20-week, the length is now 19.6 weeks, which is still very close to the 19.48 average from the Hurst nominal model. Adding this average to the January low, the next time target for this 20-week cycle is the second week of June (arrow 3). The peak for this 20-week cycle should form about now.
During the third week of January (arrow 4), the Nifty 50 crossed below its cycle line at 25,911 for a target of 25,449. The target was met one week later.
With 1 successful trading signal, the 20-week cycle has a 100% success rate.
Technically, at this stage of the cycle, the Nifty 50 should cross above its cycle line (arrow 5), providing an upside target. This will be crucial information to determine how much bullishness remains in the market.
From a trading point of view, knowing exactly where to place the 40 and 20-week cycles is not very important, since weekly cycles are used more for the longer trend direction than for active trading. Let us see the 80-day cycle now.
The 80-Day Cycle
Let us see if by analyzing the 80-day cycle we can solve the weekly cycles problem.
The beauty of the Hurst cycle is that, at one point, the shorter cycles identify the longer cycles. Due to the very important Hurst rule of synchronicity, cycles are like a puzzle where everything has to fit together.
In a balanced market, after forming a 40-week cycle, the market should cross above its 80-day cycle line, confirming the trough is the 80-day, 20-week, and 40-week trough. After reaching its target, the market should form its first 80-day low on its cycle line.
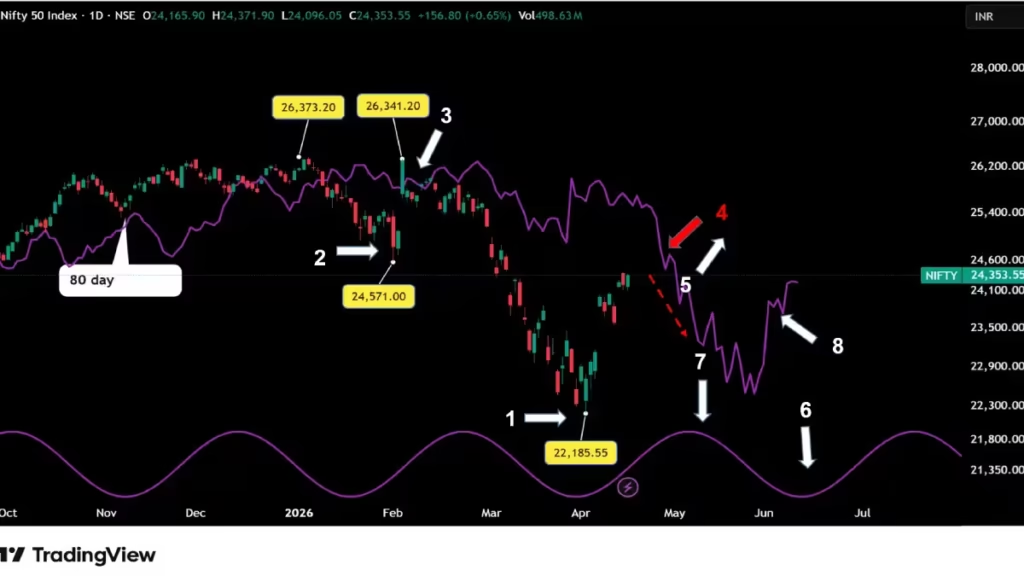
We know with certainty that the March low is an 80-day low (arrow 1). Indeed, from the January low (arrow 2) to the March low, 60 days have passed. 68 days is the average length for the 80-day cycle on the Hurst nominal model. With a very high degree of confidence, we can label March 30 as the 80-day trough.
The January low is also an 80-day low. As I mentioned above, after the 80-day low formation, the market should cross above its cycle line. After the January low, the Nifty 50 found resistance on its cycle line (arrow 3) and resumed its decline.
From there, there are 2 different possibilities.
The first is if the January low is the 40-week low; since the market did not cross above its cycle line, this is a very bearish signal. In this scenario, we can expect the actual rally to end at its cycle line (arrow 4) and then resume its decline.
In the second option, if the March 30 low is the 40-week low, then the Nifty 50 should cross above its cycle line (arrow 5), provide an upside target, and then form its next 80-day low on its cycle line on June 6 (arrow 6) with a peak around May 3 (arrow 7). On June 6, the Nifty 50 cycle line or FLD will be around 23,800 (arrow 8).
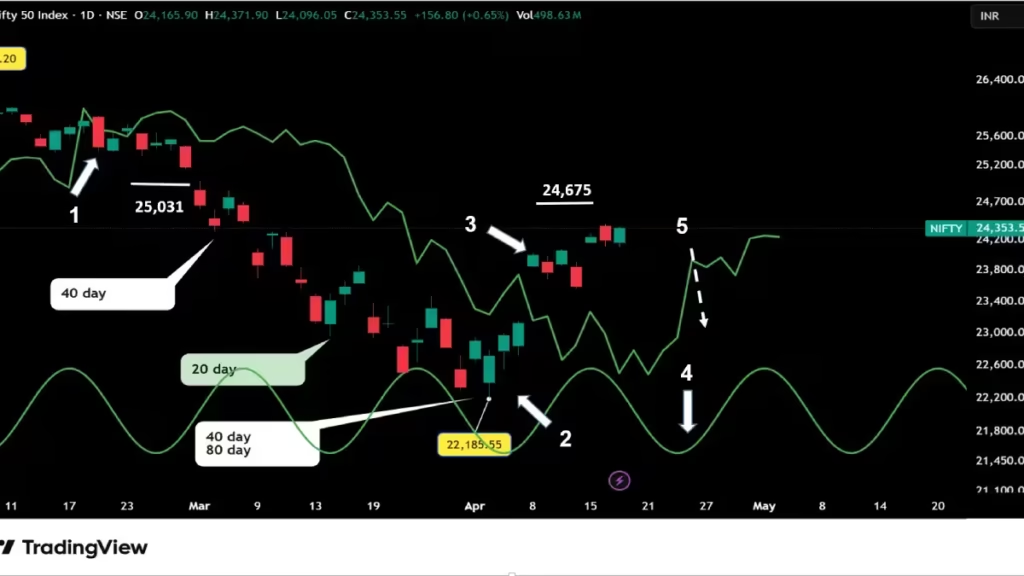
The 40-Day Cycle
The last 40-day cycle was on March 30 (arrow 1). If we add the Hurst average length nominal model for the 40-day cycle (34.1 days) to the March low, May 3 (arrow 2) will be the potential date for the next 40-day low formation. The peak should occur about now. If the peak occurs on the right part of the cycle (arrow 3), Hurst calls that “right-hand translation.” This would be a bullish sign, and we can expect a moderate correction for the next 40-day low formation. Technically, in a balanced market, the Nifty 50 should form its next 40-day low on its cycle line (arrow 4), which will be around 22,770.
Last week, on Wednesday the 15th (arrow 5), the market crossed above its cycle line at 23,800, providing a 25,145 potential upside target.
Since the beginning of the year, the 40-day cycle has provided 3 trading signals, with 2 positive out of 3. The success rate for the 40-day cycle is 66.66%.
The 20-Day Cycle
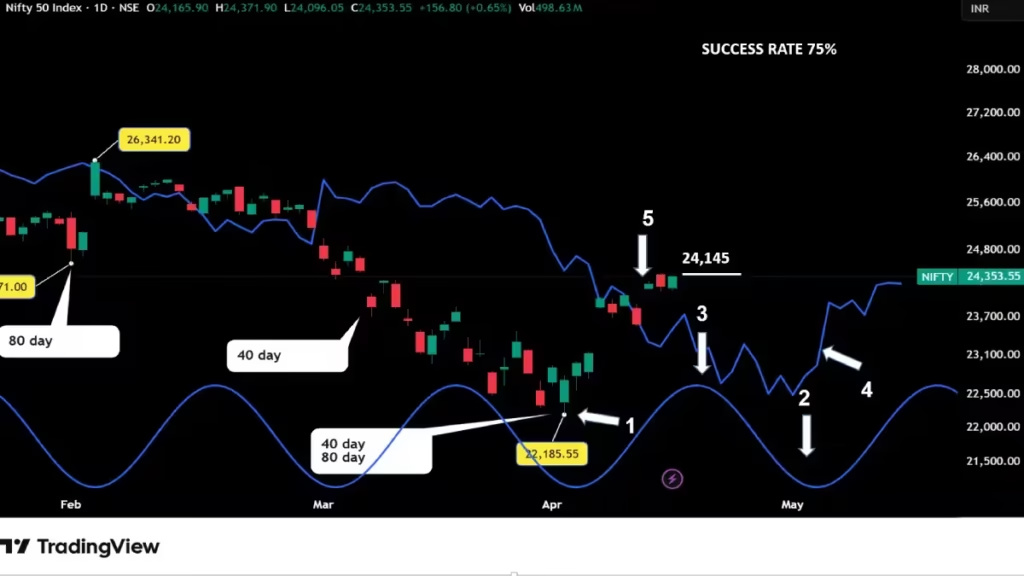
This cycle is usually very popular with short-term traders. From January 1st, the 20-day cycle has provided 3 trading signals. The first was on January 6, when the market crossed below its cycle line at 26,114 for a potential downside target of 25,855. The next day, the market met its target for a 259-point profit.
The second was when the Nifty 50 crossed back above its cycle line at 25,500 on February 3 for a potential 26,429 upside target. That same day, with a high of 26,341, the market met its target. Since the market missed its target by only 88 points and was within the 1% margin of error, the target is considered met.
The third signal was on the downside on February 19 (arrow 1) when the Nifty 50 crossed below its cycle line at 25,690 for a 25,031 target. This target was met and even exceeded by a large margin, confirming that the March low is an important low (arrow 2).
The last one was on April 8 (arrow 3) with a crossing at 23,430 for a 24,675 upside target.
The next 20-day low is scheduled for Tuesday, April 21. Technically, the market should find support on its cycle line (arrow 4). Unless we have a very short-term sharp decline, there is a high probability the market will form its next 20-day low well above its cycle line, which would be a bullish sign.
If during the next 20-day low formation it crosses sharply below its cycle line (arrow 5), this will be bearish for the rest of the trend. If this happens and the market crosses back below its cycle line before meeting its target, this will invalidate the target and we can expect further declines. Until then, the 24,675 target remains valid.
With 3 positive signals out of 3 the 20 day cycle has a success rate of 100%.
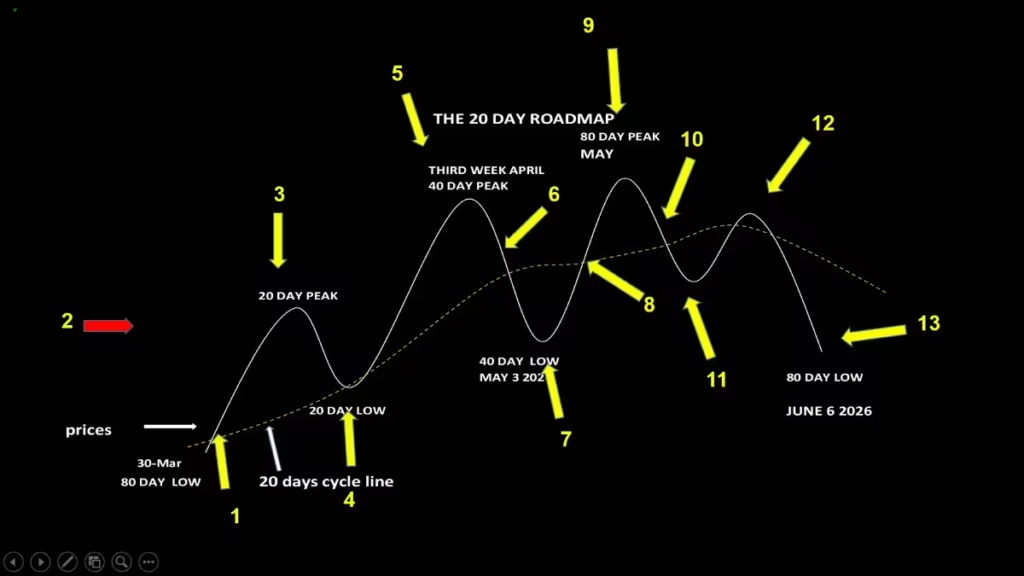
The Roadmap
This chart is the roadmap to help traders navigate through the next 80 days. This is not trading advice; it is just my personal analysis.
As mentioned, on April 8, the market crossed above its cycle line (arrow 1), projecting a 24,675 target (arrow 2) on its way to its 20-day peak (arrow 3). Then, it should form its low on its cycle line (arrow 4) and rebound to the 40-day peak (arrow 5) during the third week of April.
After forming its 40-day peak, the Nifty 50 will start its correction and should cross below its cycle line (arrow 6) on its way to the 40-day low around May 3 (arrow 7).
Then it will rebound, crossing back above its cycle line (arrow 8) to form its 80-day peak around May 6 (arrow 9). It should then cross back below its cycle line (arrow 10) on its way to form its 80-day low. Before that, the Nifty 50 should form a first low (arrow 11) during the third week of May, then rebound toward its cycle line (arrow 12), using it as resistance, and resume its decline until June 6, where it should form its 80-day low (arrow 13).
.
Conclusion
In conclusion, the NIFTY 50 is currently at a critical juncture where short-term bullishness is battling a confirmed long-term peak. Our analysis shows that while the 20-day and 40-day cycles are providing immediate upside targets, such as the 24,675 and 25,145 levels, the broader 18-month and 54-month cycles suggest that a much larger correction is unfolding toward the late 2026 period. The success rate of our Hurst signals remains exceptionally high, with the 40-week, 20-week and 20 day cycles maintaining a 100% accuracy rate so far this year.
Traders should watch the cycle line interactions closely; a failure to hold these levels during the May 3rd or June 6th low formations would signal extreme bearishness.
Use the provided 80-day roadmap to anticipate these turns, but always manage your risk as the market transitions between these synchronized waves. We will continue to update these spectral lengths as new data arrives.
Discover more from tradingmarketcycles
Subscribe to get the latest posts sent to your email.